
Fermi Blazars in the Zwicky Transient Facility Survey: A Correlation Study
2023-09-03 15:24:16SiSiSunZhongXiangWangandYiXing
Si-Si Sun ,Zhong-Xiang Wang, ,and Yi Xing
1 Department of Astronomy,School of Physics and Astronomy,Yunnan University,Kunming 650091,China;wangzx20@ynu.edu.cn
2 Shanghai Astronomical Observatory,Chinese Academy of Sciences,Shanghai 200030,China
Abstract We report on our correlation analysis for the γ-ray blazars detected with the Large Area Telescope(LAT)onboard the Fermi Gamma-ray Space Telescope (Fermi),for which we use the Fermi-LAT data and the optical zr and zg band data from the Zwicky Transient Facility survey in the time period approximately from 2018 July to 2022 February.We start from the full sample of the Fermi-LAT blazars and find~38%of them as significant variables in both γ-ray and optical bands.Among the variables,which are 705 blazars,95 are selected as our targets based on the requirement for the γ-ray brightnesses.Then 15 out of the 95 blazars are found to show the γ-ray–optical correlations in the~3.7 yr time period.Most of the 15 blazars are classified as low synchrotron peaked(LSP)ones with the time lags between the γ-ray and optical bands in a range from-19 to+25 days.The results generally fit the often-considered emission scenario for the LSP blazars.Two cases of showing~-100 days time lags are discussed,which require further studies for confirmation.Our analysis results suggest that among the detected significant variables,~23% LSPs can show γ-ray and optical correlations,while their average γ-ray fluxes are above~4×10⁻⁸ photon cm-2 s-1.
Key words: gamma-rays: galaxies–(galaxies:) quasars: general–(galaxies:) BL Lacertae objects: general
1.Introduction
As a subclass of Active Galactic Nuclei(AGNs),blazars are characterized by strong emission variability owning to having a jet pointing close to our line of sight (Urry &Padovani 1995).The jets are relativistic,inducing the Doppler beaming effect to their emissions toward us,such that the emissions over the entire electromagnetic wavelengths can be dominant over those of the host galaxies and show variabilities of different timescales.The spectral energy distributions (SEDs)of blazars often consist of two broad bumps,one with the peak at radio to ultraviolet/X-ray wavelengths and the other at hard X-ray to γray.In the often-considered leptonic scenario,the former is due to synchrotron radiation of relativistic electrons in the jets and the latter due to Compton scattering of internal or/and external low energy photons by the electrons (i.e.,the synchrotron-self Compton and the external Compton process;see,e.g.,Konigl 1981;Marscher &Gear 1985 and Begelman &Sikora 1987 respectively).
Two types of studies on blazars have often been conducted,one is the SED-fitting with different theoretical models and the other is focusing on their variabilities(see,e.g.,B?ttcher 2019).The latter can provide constraints on the emission region,jet properties,and radiation mechanisms.Since in the leptonic scenario,the same population of relativistic electrons is responsible for the production of the observed two bumps,correlation studies between two bands,respectively at the wavelengths of each bump,provide a probe into the physical processes of the jets.They help distinguish the radiation mechanisms for high-energy X-ray and γ-ray emissions.In an also-considered hadronic scenario that involves radiation processes of relativistic protons (B?ttcher 2019 and references therein),no strong correlations between low-energy and highenergy emissions are predicted,while on the other hand the correlations are natural results from the leptonic scenario.Moreover,when correlations are found,the time delays between two bands may reveal locations of the emission regions.For example,Das et al.(2021)have considered a twozone model for the blazar 4C+28.07,in order to explain several tens of days time delays between γ-ray and radio as well as the related SED changes.Blazars are further divided into two types,flat-spectrum radio quasars (FSRQs) and BL Lacertae objects (BL Lacs),where the latter show weak or no emission lines in their optical emissions (Stickel et al.1991)and thus their high-energy emissions should primarily due to the synchrotron-self Compton (SSC) process with negligible contributions from the external Compton (EC) process.Cohen et al.(2014)have found that the delay times of the FSRQs and BL Lacs in their correlation-study sample appear to have different patterns and thus suggested that the results support the SSC process is dominant in BL Lacs,an interesting example showing that correlation analysis can serve as a tool possibly probing the radiation processes.
Because of the high-energy bump,blazars are the prominent γ-ray sources in the sky.As the results of the all-sky survey conducted with the Large Area Telescope (LAT) onboard the Fermi Gamma-ray Space Telescope(Fermi),more than 6000 γray sources have been detected,and among them,98% of approximately 3800 AGNs are blazars (Fermi-LAT collaboration et al.2022).These Fermi-LAT detected blazars constitute a valuable sample for our understanding of the physical properties of blazars,as the Fermi-LAT data,collected for~14 yrs since Fermi’s launch in 2008 Aug.,provide not only spectral but also long-term light-curve information for these blazars.With the Fermi-LAT data,the studies at the γ-ray band(e.g.,Abdo et al.2010b;Meyer et al.2019;Rajput et al.2020;Bhatta 2021) as well as at multi-bands for correlation analysis have been greatly facilitated.For the latter,many authors(e.g.,Bonning et al.2012;Cohen et al.2014;Williamson et al.2016;Liodakis et al.2018,2019;Majumder et al.2019;Bhatta 2021;de Jaeger et al.2023) have conducted their work on γ-ray,radio,and optical/infrared light curves.The samples in most of these correlation studies were only a few either well-monitored at radio/optical/infrared wavelengths or selected blazars.Now with the great capabilities(with respect to the sky coverage and cadence)of the latest optical transient surveys,in particular the Zwicky Transient Facility (ZTF;Bellm et al.2019),such studies including as many as possible number of blazars are enabled.In this regard,we note that de Jaeger et al.(2023)recently have used the optical data from the All-Sky Automated Survey for Supernovae (ASAS-SN) for correlation studies of the Fermi-LAT blazars and their sample size was 1180 blazars.
We have also carried out a correlation study by using the optical light curve data provided from the ZTF survey and by starting with the full sample of the Fermi-LAT blazars.Here we report the results.In the following Section 2,we describe the blazar sample,ZTF data,and Fermi-LAT data analysis.Variability and correlation analyses and related results are presented in Section 3.We discuss our results and provide a summary in Section 4.
2.Data and Data Analysis for the Fermi-LAT Blazars
The list of Fermi-LAT blazars are provided in the latest Data Release 3 of the Fourth Source Catalog (4FGL-DR3;Fermi-LAT collaboration et al.2022).There are 3743 blazars.Inputting their positions into the ZTF data archive and requiring at least 10 data points at one band,2411 of them were found (note that the ZTF-survey sky coverage is approximately decl.>-30°).
2.1.ZTF Optical Light Curve Data
The ZTF data start from 2018 March (MJD 58194) in three bandszg,zr,andzi(Bellm et al.2019).Because usually there are limited data points at theziband,we chose to use the data at thezgandzrbands.The light curve data of the 2411 blazars were downloaded from the ZTF Data Release 11 (released on 2022 May 9) using the ZTF API.3https://irsa.ipac.caltech.edu/docs/program_interface/ztf_lightcurve_api.htmlIn order to keep the cleanness and goodness for each downloaded light curve,we requiredcatflags=0 andchi<4 in our selection of data points.We counted the numbers of the data pointsndetfor the blazar sources and show the distributions at thezrandzgbands in Figure 1.Most of the sources havendet<300–400,and a few havendetupto~1000.Since our purpose was to find correlation cases between γ-ray and optical light curves,which required certain numbers of data points in an optical light curve,we chose 100 data points as the minimum and excluded the sources with data points less than it.From this exclusion,we ended with 1842 and 1579 sources in thezrandzgbands,respectively.
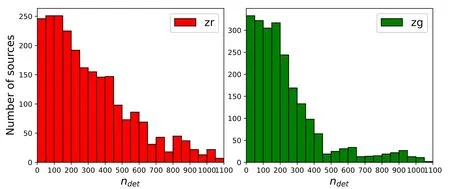
Figure 1.Distributions for the numbers of the data points for 2411 Fermi-LAT blazars at the ZTF zr (left) and zg (right) bands.
2.2.Fermi-LAT Data and Analysis
As shown below in Section 3.1,705 Fermi-LAT blazars were selected for further analysis.We extracted their γ-ray light curves from the Fermi-LAT data.In this extraction analysis,we selected 0.1–500 GeV LAT events from the Fermi Pass 8 database inside a 20°×20° region centered at the position of each of the blazar targets.The time period of the LAT data was set from 2018 July 1 00:00:00 (UTC) to 2022 March 3 22:39:55 (UTC).We included the events with zenith angles less than 90°,which prevents the Earth’s limb contamination,and excluded the events with quality flags of “bad.” Both of these are recommended by the LAT team.4http://fermi.gsfc.nasa.gov/ssc/data/analysis/scitools/
We constructed a source model for each of the targets,which included all sources in the 4FGL-DR3 catalog within 20°of the target.The spectral forms of the sources are provided in the catalog.We set the normalizations of the sources within 5°of a target as free parameters and fixed other spectral parameters at their catalog values.In addition,the background Galactic and extragalactic diffuse emission components were included in the source model.Their spectral models were gll_iem_v07.fits and iso_P8R3_SOURCE_V3_v1.txt,respectively.The normalizations of the two components were set as free parameters.
Because the ZTF observations generally have a cadence of 2–3 days for a source (Bellm et al.2019) when it is visible to the telescope,we chose 7 days time bin for each of the light curves so as to obtain comparable γ-ray light curves.The γ-ray data points were obtained by performing the standard binned likelihood analysis to the data of 7 days time bins.In this analysis,the γ-ray emission of a target was assumed to have a simple power in the source model,and the normalization and index were set as free parameters.The Test Statistic(TS)value of each of the time bins resulting from the analysis,which represents the measurement of the fit improvement and is approximately the square of the detection significance (Abdo et al.2010a),was checked.For each of the targets,we kept the data points with TS values >4(i.e.,>2σ detection significance)in a light curve.The distribution for the numbers of data points for the blazars is shown in Figure 2.Unfortunately,most of the sources have only <60 data points,which is due to the faintnesses of the sources in most of the 3.7 yr long time period.
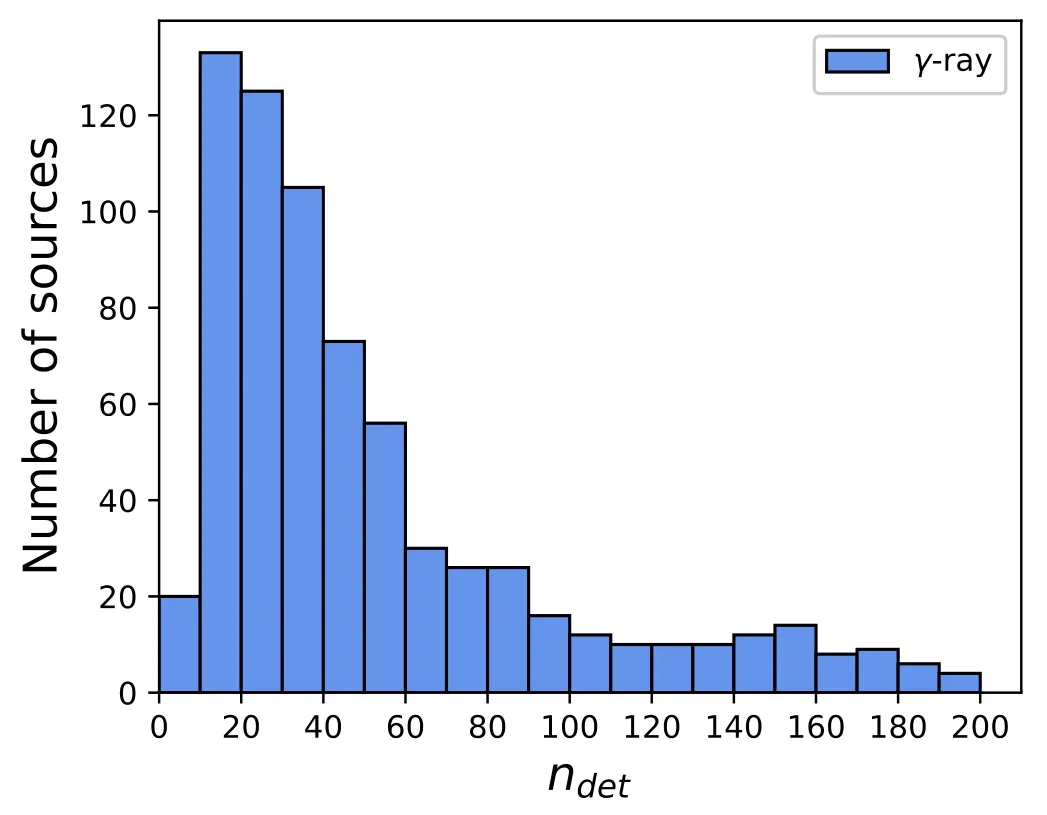
Figure 2.Distribution of the numbers of the data points at γ-rays for 705 blazars.
3.Analysis and Results
3.1.Variability Analysis
We checked the variability for the 1842 (at thezrband)and 1579 (at thezgband) blazars (see Section 2.1).For each optical light curve,we calculated the χ2value,χ2=wheremiis a magnitude measurement,is the mean of the light curve,and Δmiis the uncertainty ofmi.The reduced χ2/N≥6.63,whereN=ndet-1,was used to determine if the light curve has significant variations (at a 99% confidence level).At γ-rays,a parameter Variability_Index has been calculated and used by Fermi-LAT as the variability indicator (Fermi-LAT collaboration et al.2022).For each source,its fluxes or flux upper limits of 1 yr time bins with a total time period of 12 yr(i.e.,12 bins) in 4FGL-DR3,were calculated and Variability_Index was derived(Nolan et al.2012).Given 12 bins,the threshold value of Variability_Index is 24.725,above which a source is identified as a variable at a 99%confidence level (Fermi-LAT collaboration et al.2022).We cautiously note that Variability_Index indicates the long-term variability.If we were to derive the index for the short-term variability,such as on a monthly or even shorter timescales,it would require much large amount of computing time.We thus used the Variability_Index values already given by 4FGL-DR3 instead.
We plotted the χ2/Nand Variability_Index values of the blazars in Figure 3.In the upper right section of the plot,which is defined by requiring χ2/N≥6.63 and Variability_Index ≥24.725,approximately 38% of the blazars were identified to have shown significant variations at both γ-rays and optical bands.We used the analysis result at thezrband for further source selection.The number of blazars in the upper right section of the left panel of Figure 3 is 705.We checked these 705 sources and found that they contain all the sources(the number is 604,in the upper right section of the right panel of Figure 3) calculated from thezglight curves.We thus extracted the γ-ray light curves for the 705 sources (see Section 2.2).
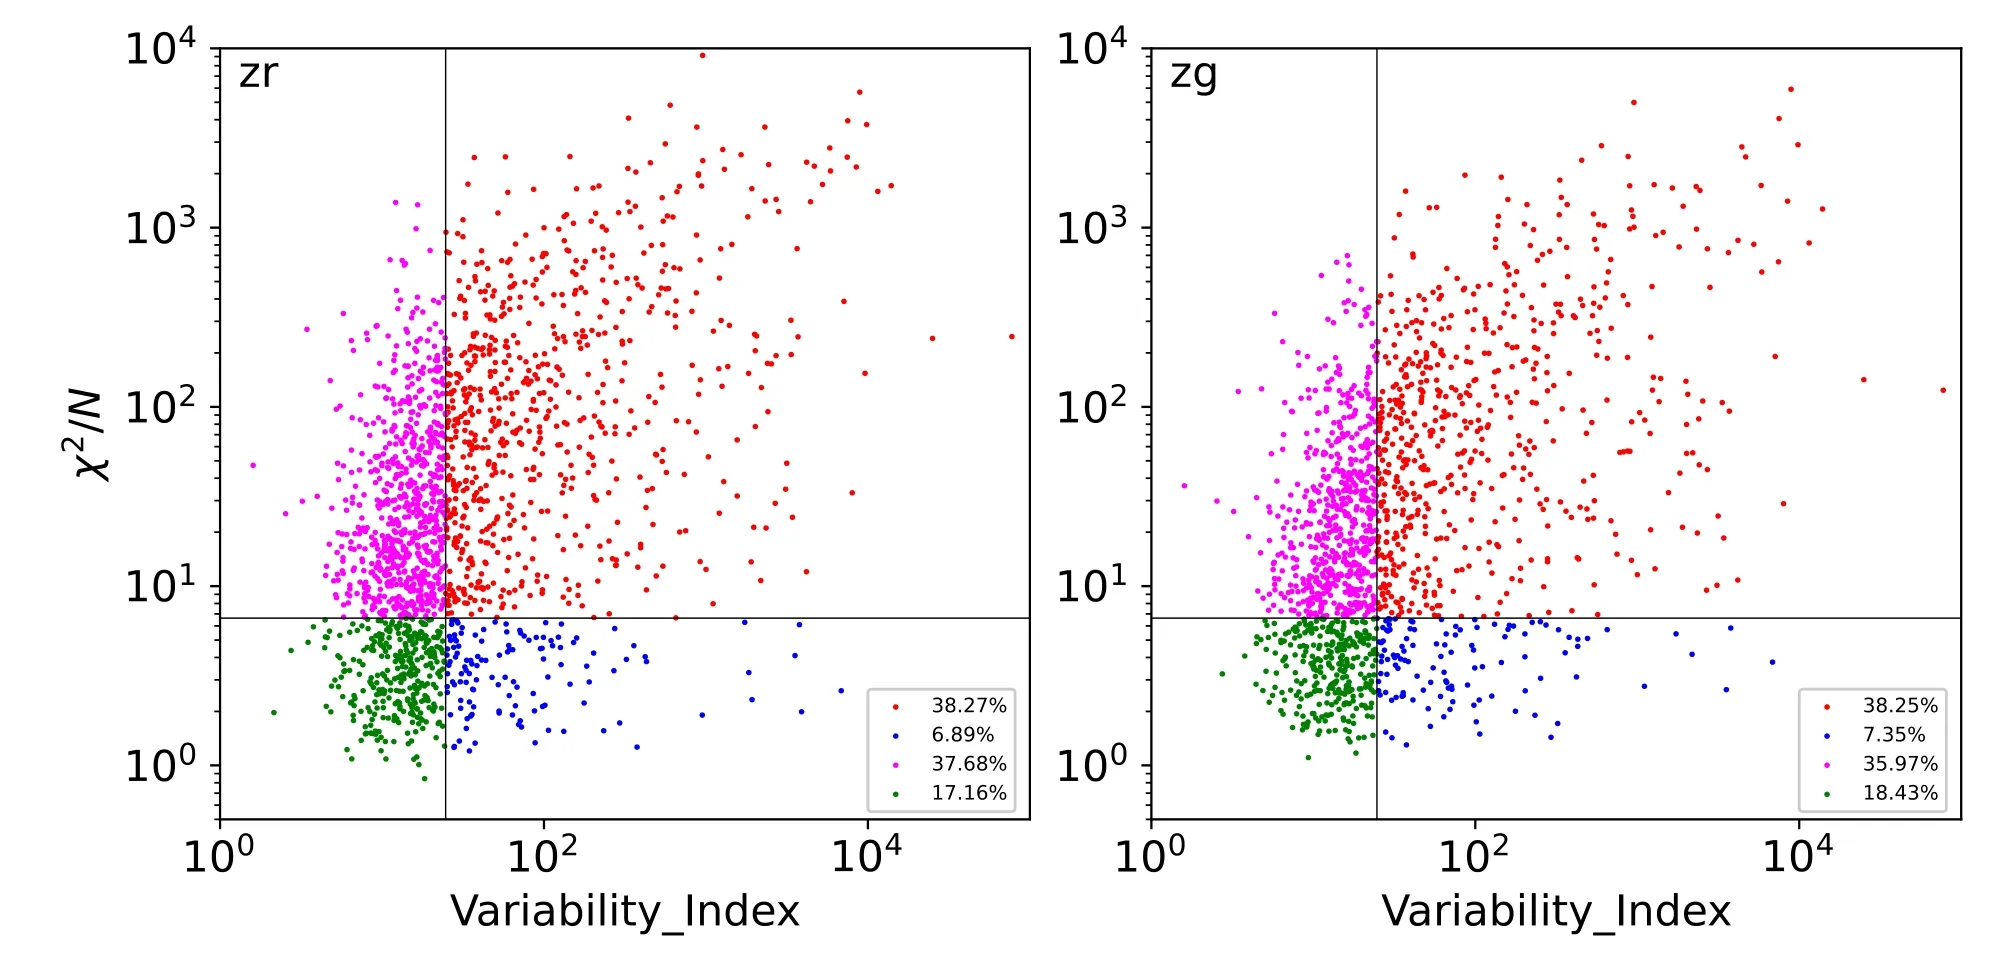
Figure 3.Variability analysis for 1842 and 1579 blazars at γ-rays and optical zr (left) and zg (right) band respectively.The vertical and horizontal lines in the two panels indicate the Variability_Index value of 24.725 and χ2/N value of 6.63 respectively.
3.2.Discrete Correlation Function Analysis
To study the correlations between the γ-ray and optical bands,we used the method of discrete correlation function(DCF) analysis.This method has been commonly applied to multi-band correlation analyses (for recent examples,see Sarkar et al.2019;Das et al.2021;Gong et al.2022),with the advantage of not requiring interpolation in the case of irregularly sampled time series.First there is the unbinned DCF(UDCF) defined as the following between theith data pointaiin one band andjth data pointbjin another band (Edelson &Krolik 1988;Fan et al.2017):
whereMis the number of the pairs in the bin.The standard deviation for each bin is given by
In order to have sufficient number of data points in the analysis,we selected the sources having ≥100 data points at both γ-ray and optical bands,and ended with 95 blazars.For each of them,the DCF curves between the γ-ray andzr/zgband were obtained.The time delay range searched was from-200 to 200 days.We considered a peak with values greater than 0.6 as a correlation signal.For each signal peak,we performed a Gaussian fit to determine the peak time (i.e.,the time lag τ) and its uncertainty.
In the end,15 of the 95 blazars were found to show correlations.They are listed in Table 1 with the determined time lags τγ-zr(τγ-zg)between the γ-ray and opticalzr(zg)band given.Their light curves and corresponding DCF curves are shown in Figures 4,5,and A1.We checked the types for the 15 blazars.Among them,11 are FSRQs and four BL Lacs.
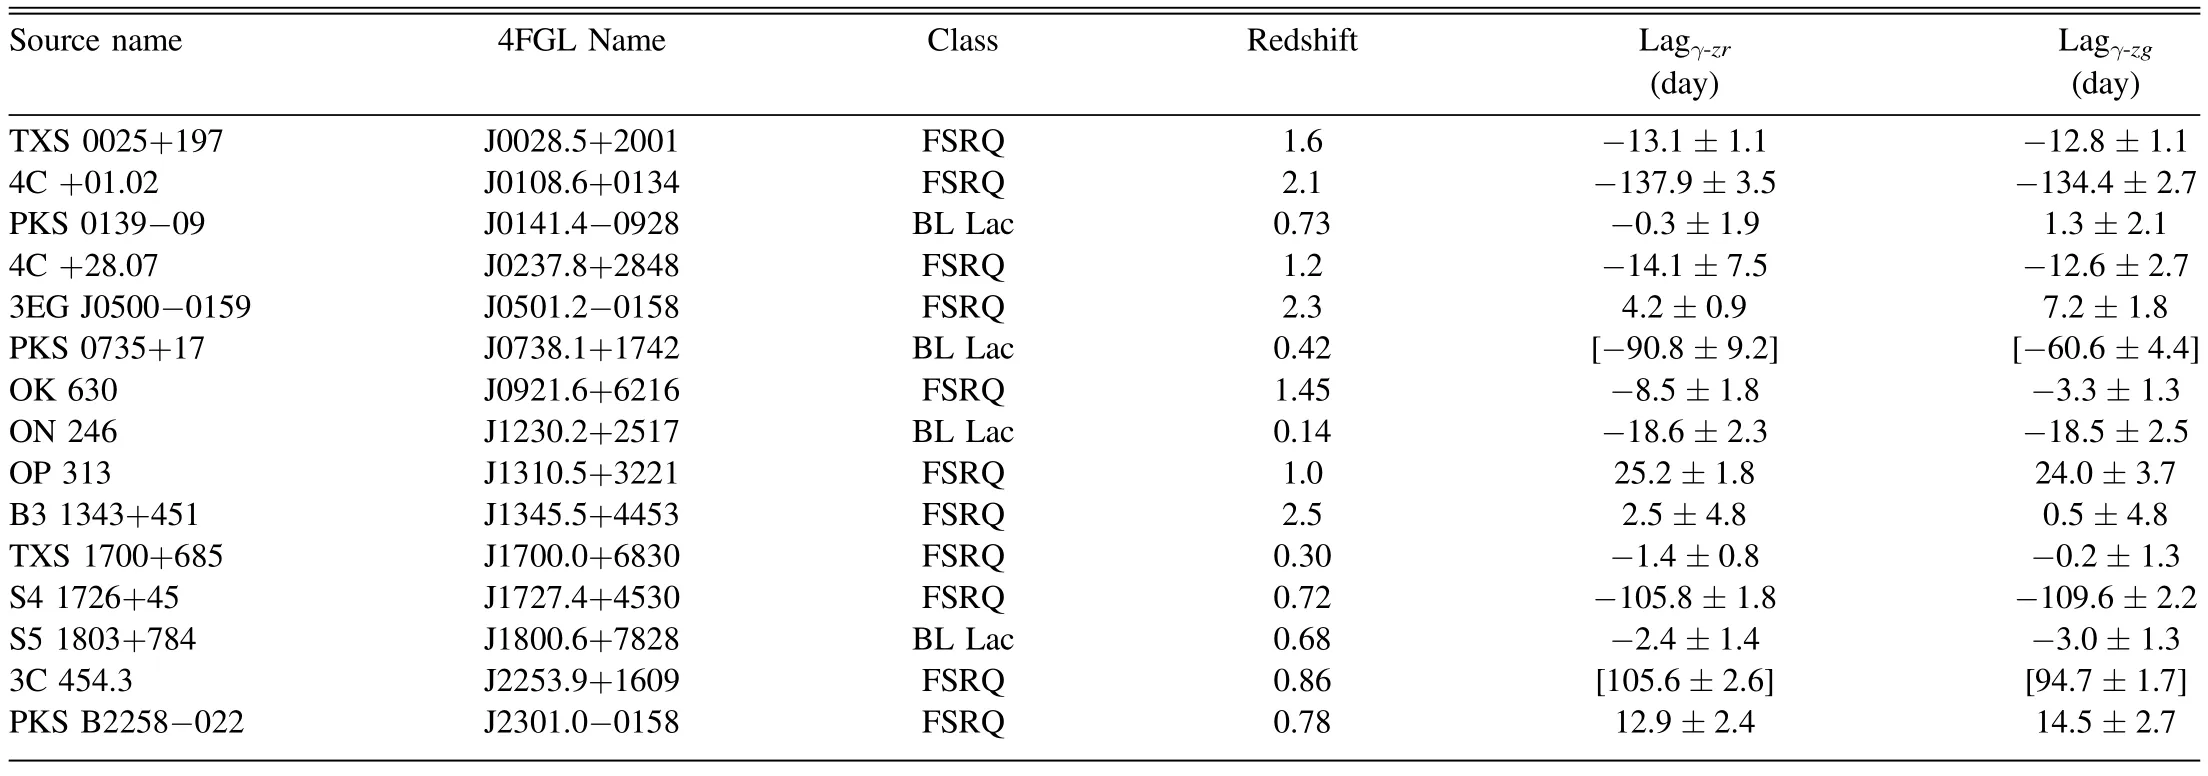
Table 1Cross-correlation Analysis Results between the γ-Ray and Optical Light Curves for 15 Blazars
4.Discussion
Taking advantage of the Fermi LAT all-sky survey results and the availability of the ZTF survey data,we have conducted correlation analysis for γ-ray blazars.For the 15 blazars found with correlations,most of the τγ-zrand τγ-zgvalues are consistent with each other,but there are exceptions.The two values for PKS 0735+17 are only consistent within 3σ.We show its DCF curves in Figure 4,and as can be seen,they are rather jumpy with the peaks not well in a smooth Gaussian shape.Examining its light curves (Figure 4),we can see that while the γ-ray light curve is flat over most of the time period and then shows one flare at the end,the optical ones appear to only cover the rising part of the flare.Thus the lack of variations and sufficient coverage of the only flaring activity is the likely reason for the results.There is also the case 3C 454.3,the difference between the two time-lag values is approximately 3.5σ.As shown in Figure 5,its DCF curves contain complex structures with another bump at the right side of the main peak.Examining the light curves(Figure 5),we think that the discrepancy and complexity of the DCF curves should be caused by the apparent time differences of the flares seen in the γ-rays and the optical bands.For example in the first half of the light curves,the first optical flare(MJD 58350–58380)could be considered to lead before a γ-ray flare and then the second (a major one at~MJD 58680)appears to lag behind a major γ-ray flare.We tested to divide the part of the light curves into two and to calculate the corresponding DCF curves.The results confirmed the confusing behavior,having the peaks at~-40 days and~+50 days respectively.Thus the light curves of 3C 454.3 in the time period cannot be used to derive reliable correlation values.The values of~100 days given in Table 1 are for the completeness purpose and should be taken with caution.

Figure 4.γ-ray light curve (top) and optical zr and zg light curves(middle) for PKS 0735+17,and the corresponding DCF curves (bottom).The peaks of the DCF curves are not in a smooth Gaussian shape.
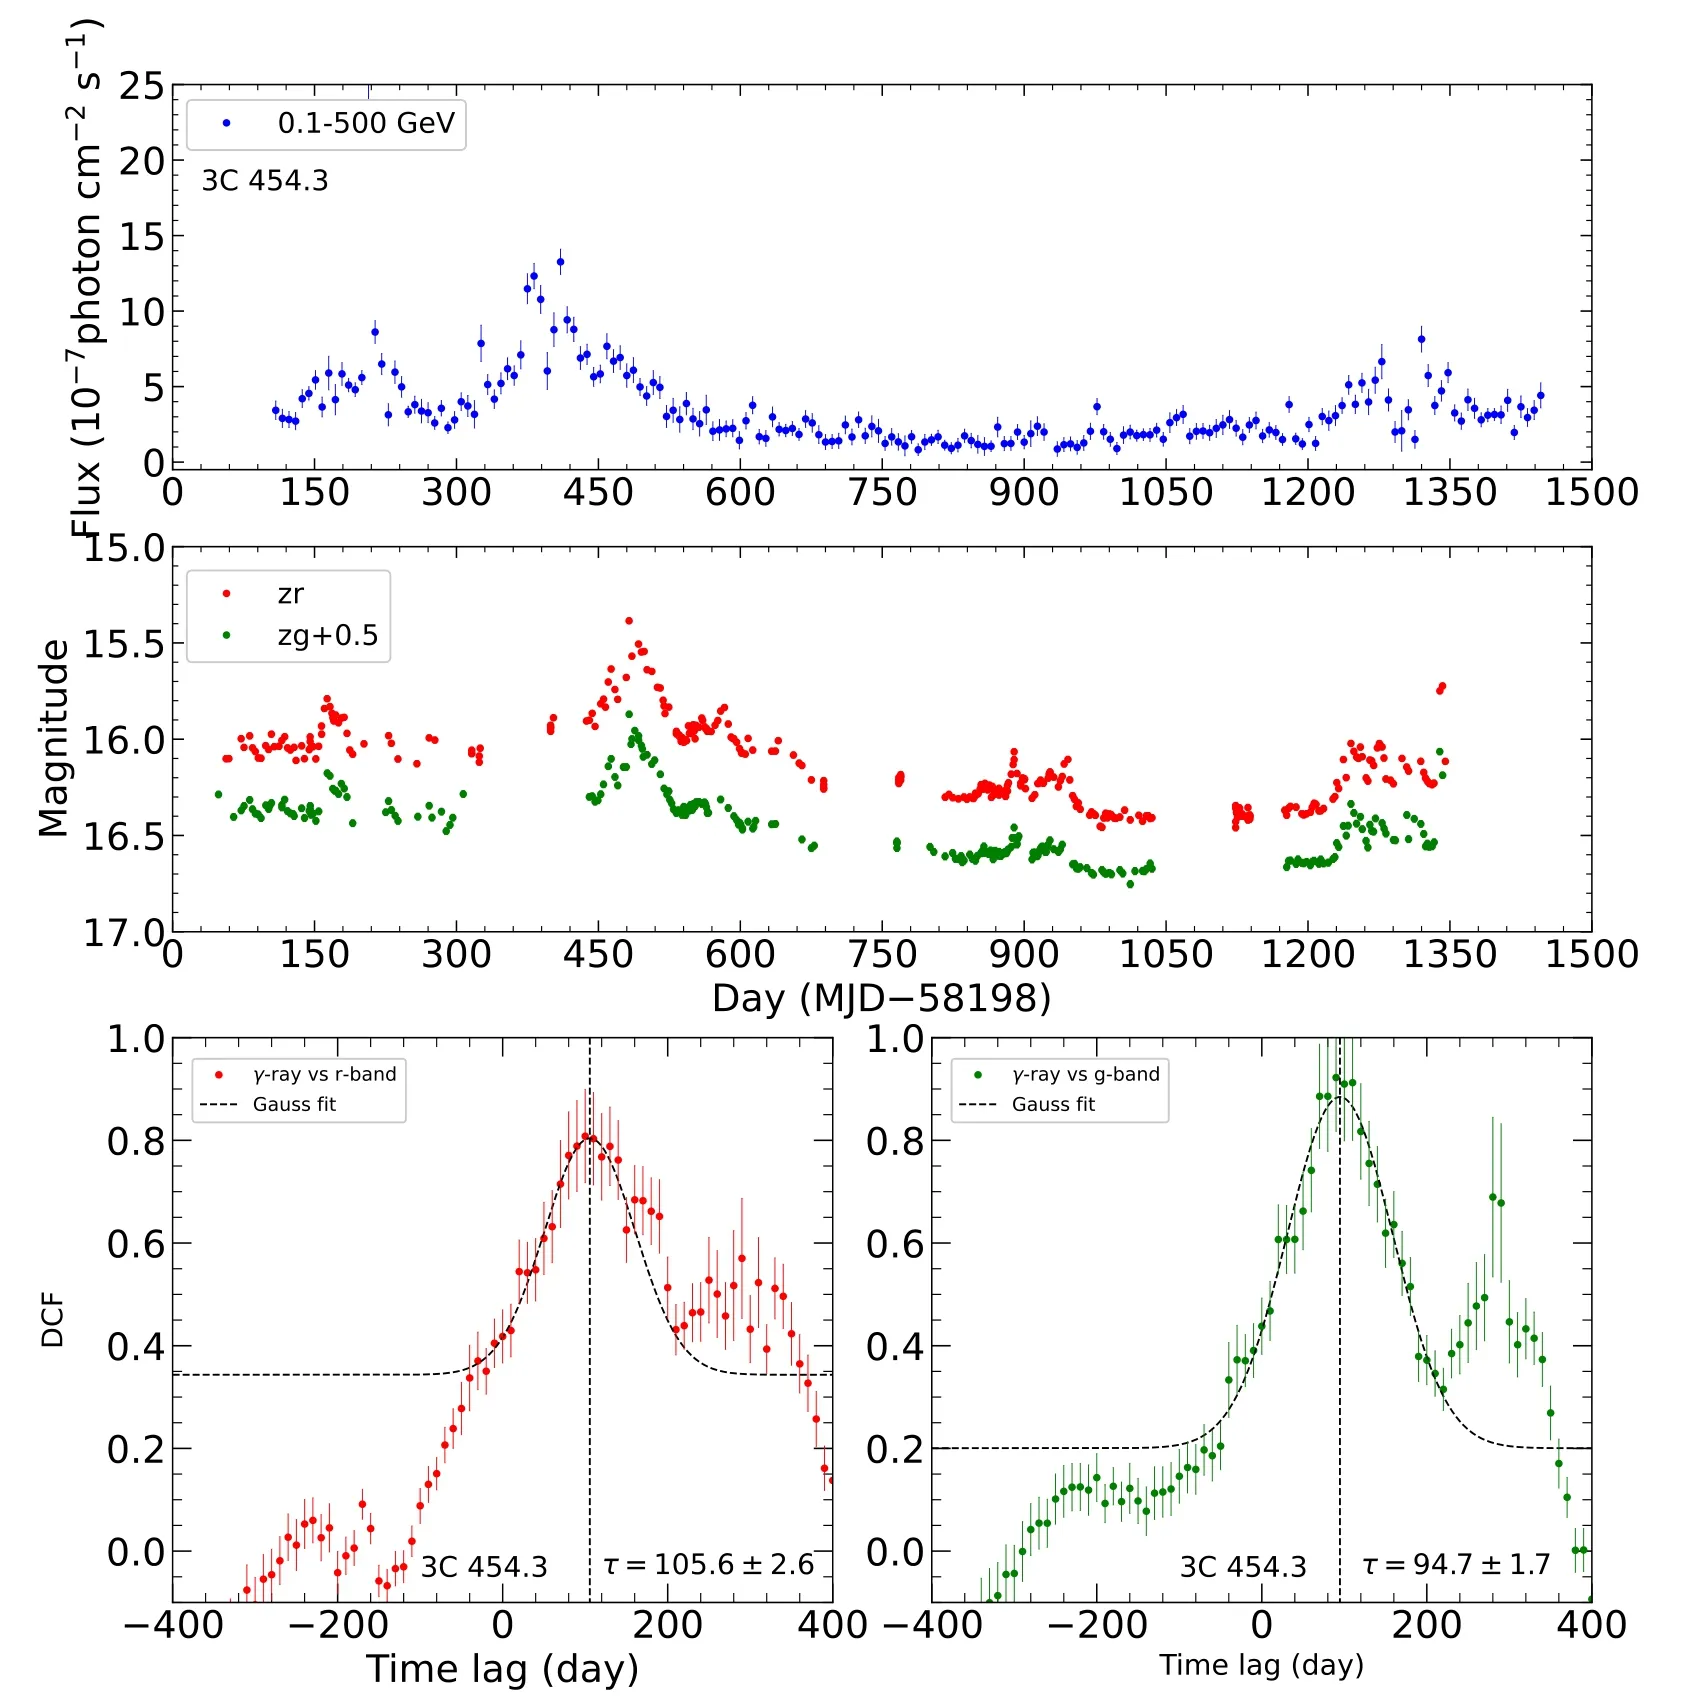
Figure 5.Same as Figure 4 for 3C 454.3.The DCF curves show complex structures with a bump at the right side of the main peak.
Most of the obtained time lags are between -19 to+25 days (positive values indicating γ-rays leading optical),which are -16 to +13 days in the rest frame after being corrected with the redshifts (Table 1).The range is consistent with those,typically in a range of±15 days,obtained from previous studies(e.g.,Cohen et al.2014;Liodakis et al.2019;de Jaeger et al.2023).Because the correlation cases are 15,among which only four BL Lacs,the case sample is too small for making the similar comparison to that Cohen et al.(2014)have conducted,where they have found that FSRQs tend to have leading γ-ray emissions while BL Lacs are rather widely scattered with no clear tendency.We note that if we exclude the two suspicious cases (PKS 0735+17 and 3C 454.3),two sources,which are 4C+01.02 and S4 1726+45,have their time lags <-100 days.The rest-frame time lags,corrected with their respective redshift values (Table 1),are approximately -45 and -62 days respectively.The values indicate that the optical activity led the γ-ray one significantly.This possibly suggests the need of a two-zone emission model for the two sources (e.g.,Das et al.2021).We note that for 4C+01.02,Schutte et al.(2022) have recently conducted multi-wavelength studies on it,and found that the region for the high-energy emission is likely further out along the jet in the quiescent state because of the suppression of the EC component.The distance of the region from the opticalemission region Δrwould be Δr~δΓbτc/(1+z)~8 pc(Pushkarev et al.2010)if we follow the parameter setup for its jet given in Schutte et al.(2022),where the Doppler factor δ is simply assumed to be equal to the bulk Lorenz factor Γb(=15) andcis the light speed.Such a distance difference is in line with the observational facts that γ-ray emissions of some blazars were found to be from locations~20 pc away from their central engine (i.e.,well beyond their broad line region;see,e.g.,Schinzel et al.2012;Kramarenko et al.2022).In any case we cautiously note that the two time-lag results were mostly derived from one major flare,as indicated by their light curves (Figure A1).One or a couple of flares in two observational bands that have a large wavelength difference could be mis-correlated,producing mis-leading results.As both ZTF and Fermi-LAT keep collecting data,it will be necessary to check the results again for the two sources when a significant time period of data is added.
We went through published literature for previous γ-ray–optical correlation analysis results for the 15 blazars (Table 1).Cohen et al.(2014) have detected time lags of 4.1±1.3,6.3±7.7,and -32.0±3.0 days for 4C+28.07,OP 313,and S5 1803+784,respectively.The first two are consistent with our results within the uncertainties,but the last one is different although approximately within the often-considered 30 days range (de Jaeger et al.2023).For the first source,Das et al.(2021) also have carried out multi-wavelength studies and found a time lag of approximately -6 days for a flare before MJD 56000;for the third source,Nesci et al.(2021) have conducted multi-wavelength studies using data before 2019,and for two flares they have found~0 time lags.These results are consistent with ours.In addition,Fang et al.(2022) have collected optical data from different facilities for a long term of~7000 days (until MJD 58200) for PKS 0735+17,but only found a weak signal at 22 days (with a large uncertainty)between the γ-ray and opticalRband.
Since 3C 454.3 is one of very active blazars at multiwavelengths,there have been many studies on it and different interesting properties have been revealed (e.g.,Raiteri et al.2011;Jorstad et al.2013;Fan et al.2018;Zhang et al.2018,2020).While it has been shown by us to have a possible~+100 days time lag,Bonning et al.(2012) and Zhang et al.(2018)have found nearly zero time lags for the time periods of approximately from MJD 54000 to MJD 55500(or MJD 57500 in the latter),and Bhatta (2021) has found a time lag~+11 days from analyzing~6000 day data (before MJD 59000).Interestingly,when Zhang et al.(2018) divided their light curves into two segments,a positive time lag was seen in one light-curve segment(see their Figure A.1),which is similar to that from our analysis of this source.Complicated multi-wavelength behaviors on different timescales could exist in it(and likely other sources as well).In order to catch its fine and different timescale variations and thus have a better understanding for its properties,high-cadence as well as longterm coverages of this source are warranted.
The reason for having more FSRQs in our results is likely because of more FSRQs being low synchrotron peaked (LSP)blazars (e.g.,Abdo et al.2010c).There is a classification scheme built for Fermi-LAT blazars(Abdo et al.2010c),which is based on the peak frequency of the synchrotron componentHz,the blazars are classified as LSPs;forHz,intermediate synchrotron peaked ones (ISPs);and forHz,high synchrotron peaked ones(HSPs).We checked the classifications for the 15 blazars,and 13 of them are LSPs,one is an ISP,and one is unclassified.The latter two are ON 246 and TXS 0025+197 respectively.This result of most correlation cases being LSPs raises a question about the classes of the blazars in our sample.We further checked their classes,and found that among the 95 blazars,57 are LSPs,16 ISPs,19 HSPs,and three unclassified.A simple result may be drawn about the ratios of the correlation cases:~23% LSPs and~6% ISPs show γ-ray–optical correlations,while it is rare to see the correlation in HSPs.
However,our results are likely biased,which is probably controlled by whether the sources are sufficiently bright at γrays.In Figure 6,we show the average optical magnitudes and the average γ-ray fluxes of the blazars in our sample,where the former were estimated by averaging the respective optical light curves and the latter were derived from the binned likelihood analysis of the Fermi-LAT data of the 3.7 yr time period for each source.As can be seen,all the 15 correlation sources were relatively bright at γ-rays,above an approximate line at 4×10⁻⁸photon cm-2s-1.Moreover,most LSPs are located above this line.We chose two likely representative sources that did not have the correlations(marked by arrows in Figure 6)for comparison.Their light curves are shown in Figure 7.One(TXS 0506+056) had a relatively low γ-ray flux and is not an LSP;the other (PKS 1510-089) had a high γ-ray flux (among the highest) and is an LSP.The first one had significant,~1 mag variations at the two optical bands,but its γ-ray fluxes were relatively low,staying most time at a constant level.This could be a case that there were corresponding γ-ray variations but the sensitivity of Fermi-LAT is not high enough to have detected them.The second one,an LSP,showed multiple flares in its high-flux γ-ray light curve,but the optical ones either did not catch them or were less variable.Therefore it is likely that from the observational side,findings of the correlation sources rely on the detectability of the γ-ray variations and then the optical coverage of indicative flares as well.
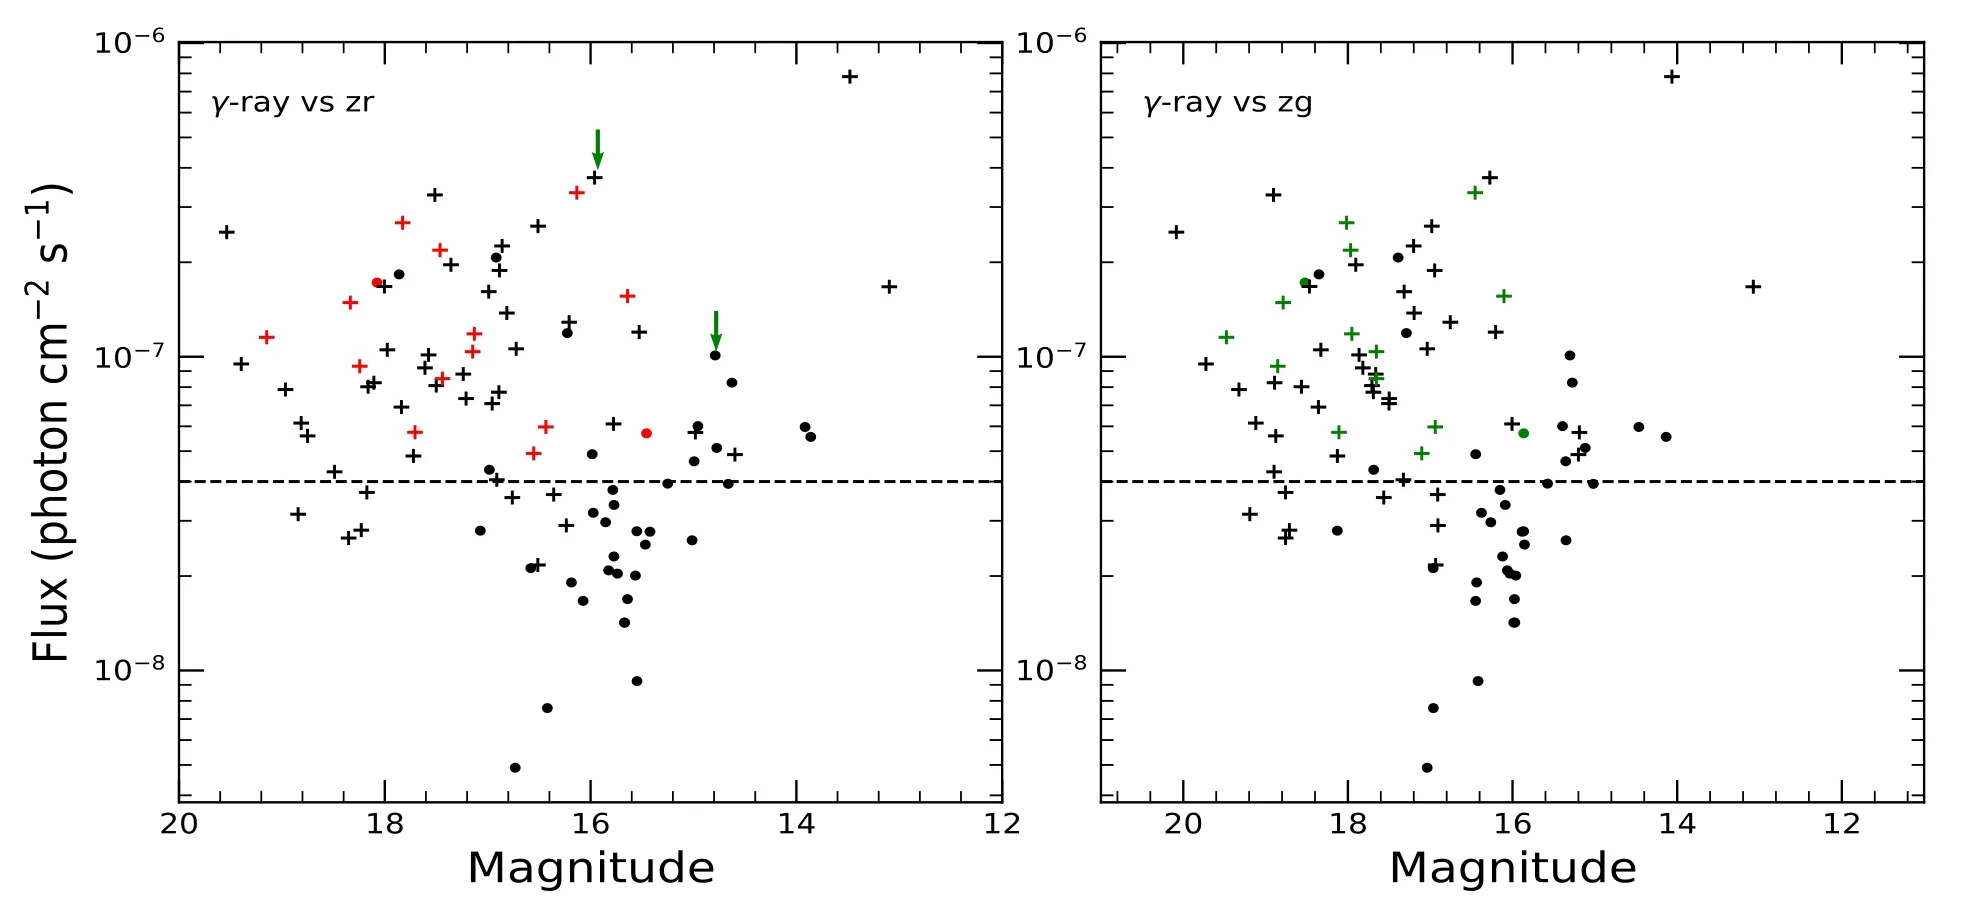
Figure 6.Average optical magnitudes and average γ-ray fluxes of the 95 blazars in our sample,in which the LSPs are plotted as plus signs.The correlation cases are marked with red in the left panel and green in the right panel.It can be noted that below the γ-ray flux of~4×10⁻⁸ photon cm-2 s-1(indicated by the dashed lines),most of the sources are non-LSPs and none of them are the correlation cases.Two non-correlation sources,marked by arrows in the left panel,are chosen as the representative examples for comparison,with their light curves shown in Figure 7.
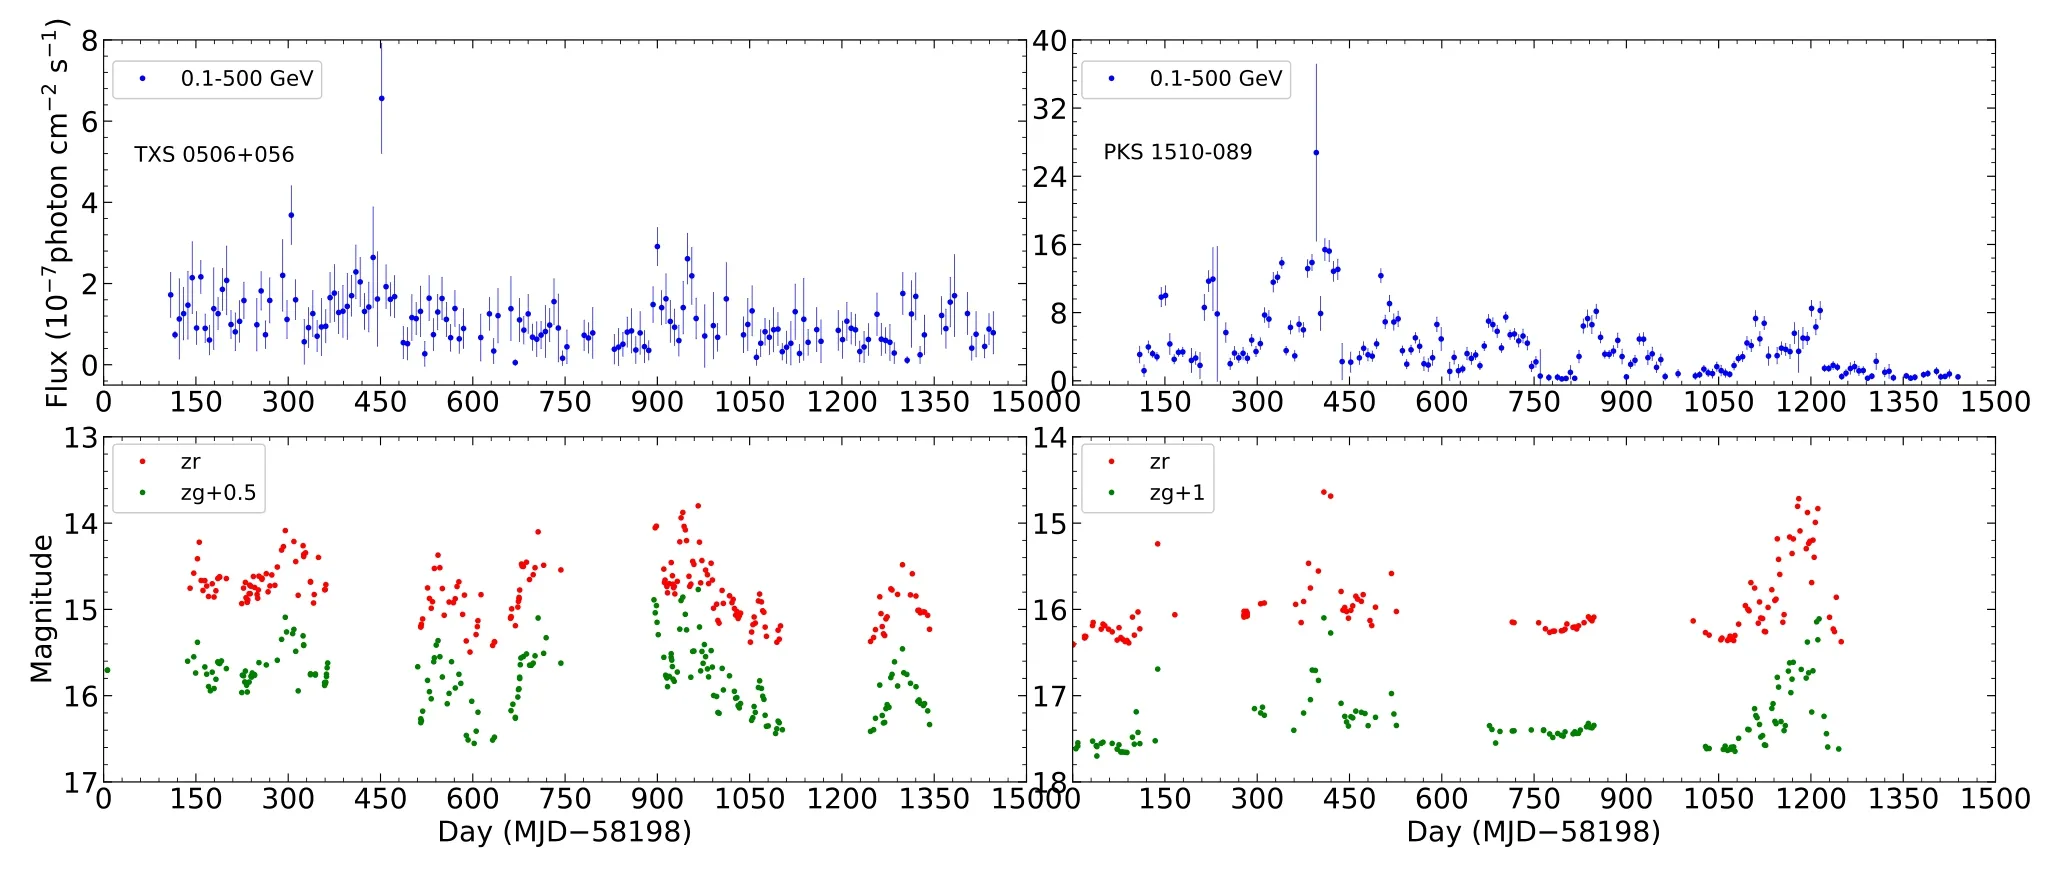
Figure 7.Two light curve examples for the non-detection of the γ-ray and optical correlations.(Left) A non-LSP with relatively low γ-ray fluxes.(Right) An LSP among the brightest γ-ray sources in our sample.
As a summary,we have started from the full sample of the Fermi-LAT blazars and carried out a selection process through the ZTF coverage,variability analysis,and γ-ray brightnesses.Among them,95 passed the selection and 15 have been found with γ-ray–optical correlations.Most of them are LSPs,and they have average γ-ray fluxes greater than 4×10⁻⁸photon cm-2s-1.The time lags are mostly in the range of from-19 to+25 days(or-16 to+13 days in the rest frame),and there are two clear cases having the optical variations leading the γ-ray ones by more than 100 days.Further studies of the latter cases are needed in order to confirm the results,which would help establish a multi-emission-zone picture for the two blazars.
Acknowledgments
We thank the referee for constructive suggestions.This research is supported by Basic Research Program of Yunnan Province(No.202201AS070005),the National Natural Science Foundation of China (12273033),and the Original Innovation Program of the Chinese Academy of Sciences (E085021002).
Appendix γ-Ray and Optical Light Curves and DCF Curves
The γ-ray and opticalzrandzglight curves of 13 blazars,in addition to PKS 0735+17 and 3C 454.3 (see Figures 4 and 5),are shown in Figure A1.Using them,we have found the γ-ray–optical correlations,for which the DCF curves for each source have been calculated and the time lags between the γ-ray and each of the two optical bands have been derived.
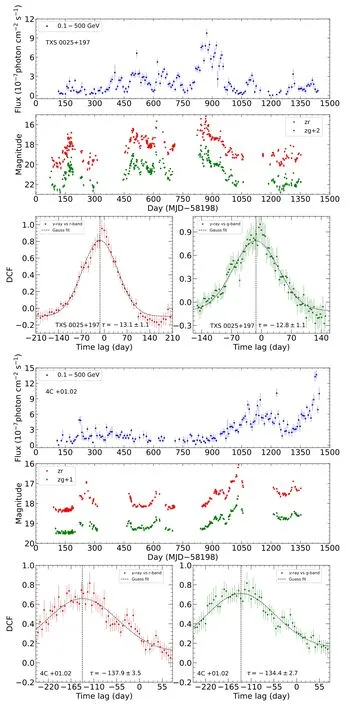
Figure A1.(a) Same as Figure 4 for TXS 0025+197 and 4C+01.02.(b) Same as Figure 4 for PKS 0139-09 and 4C+28.07.(c) Same as Figure 4 for 3EG J0500-0159 and OK 630.(d)Same as Figure 4 for ON 246 and OP 313.(e)Same as Figure 4 for B3 1343+451 and TXS 1700+685.(f)Same as Figure 4 for S4 1726+45 and S5 1803+784.(g) Same as Figure 4 for PKS B2258-022.
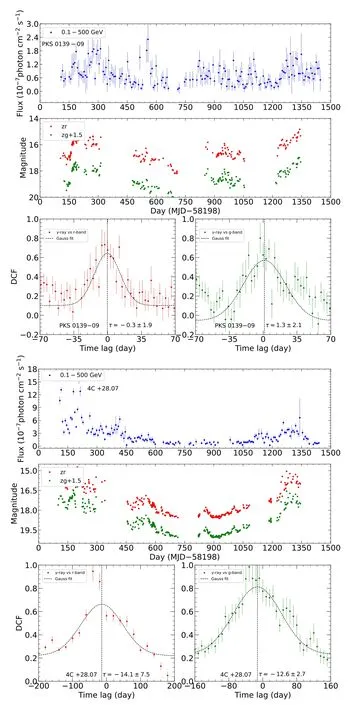
Figure A1.(Continued.)
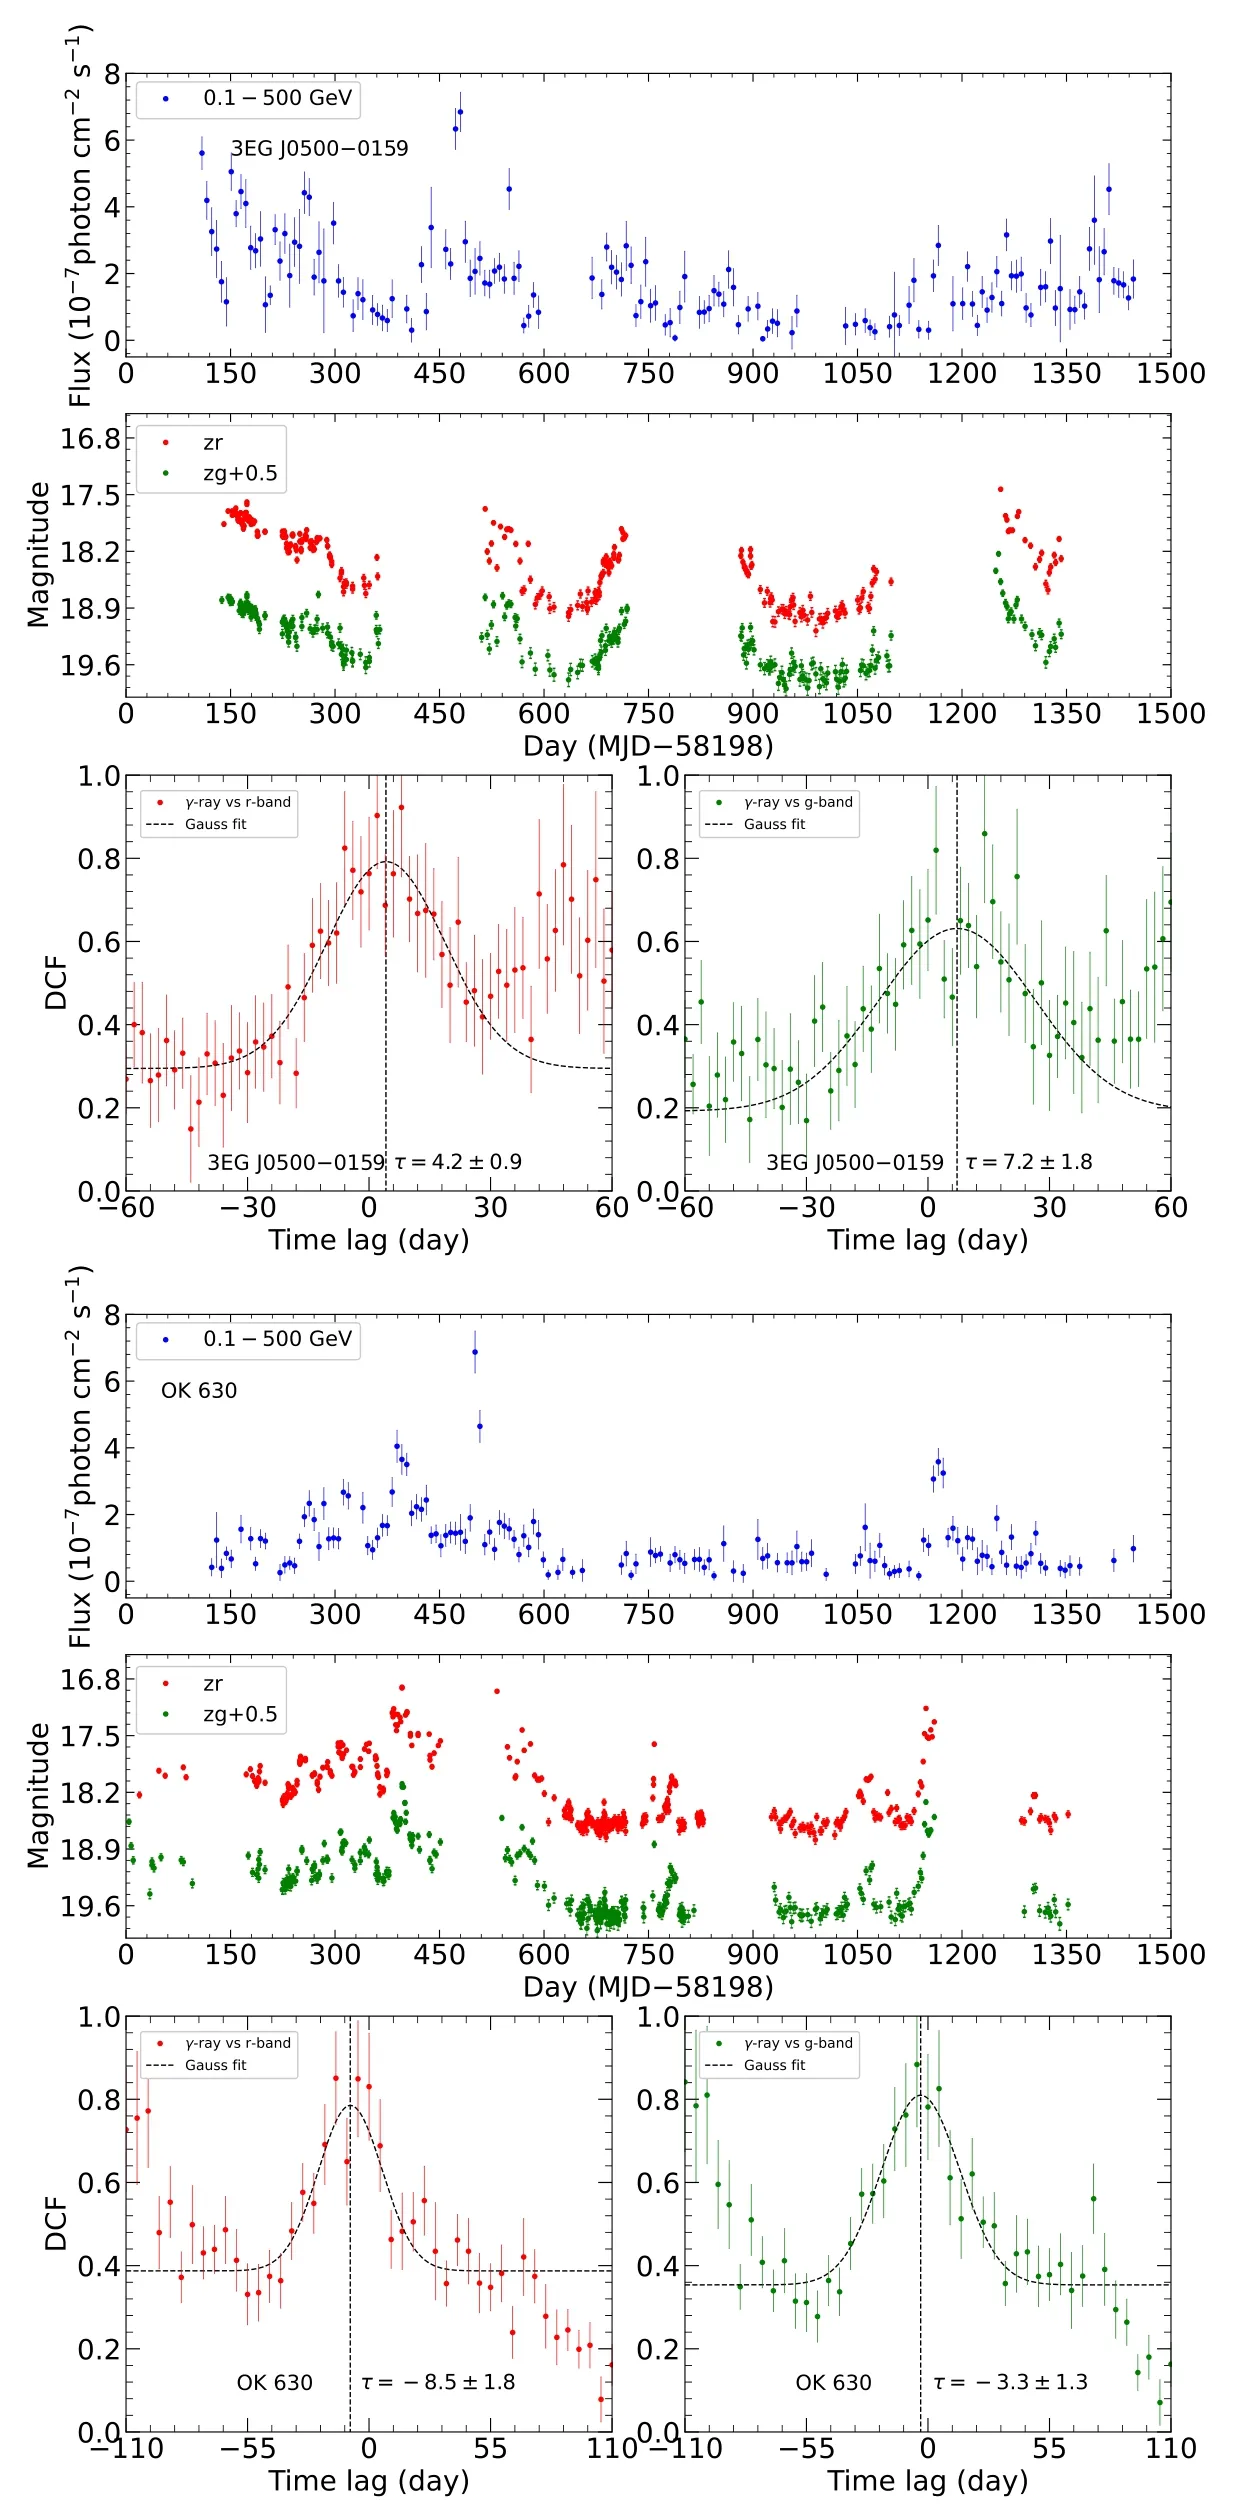
Figure A1.(Continued.)
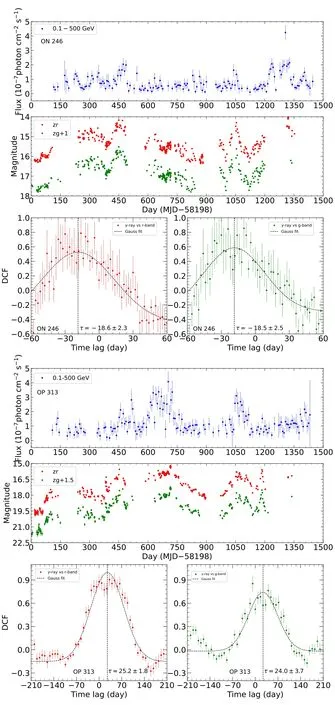
Figure A1.(Continued.)

Figure A1.(Continued.)
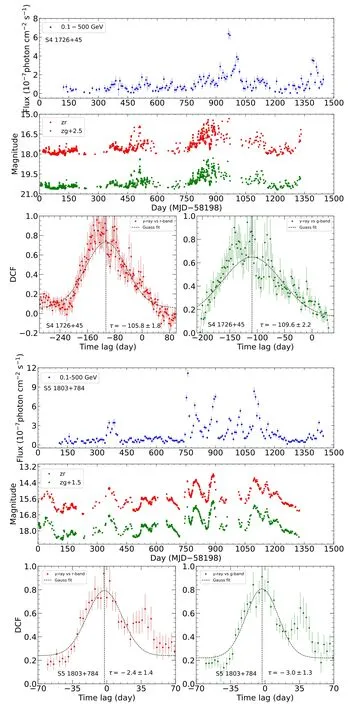
Figure A1.(Continued.)
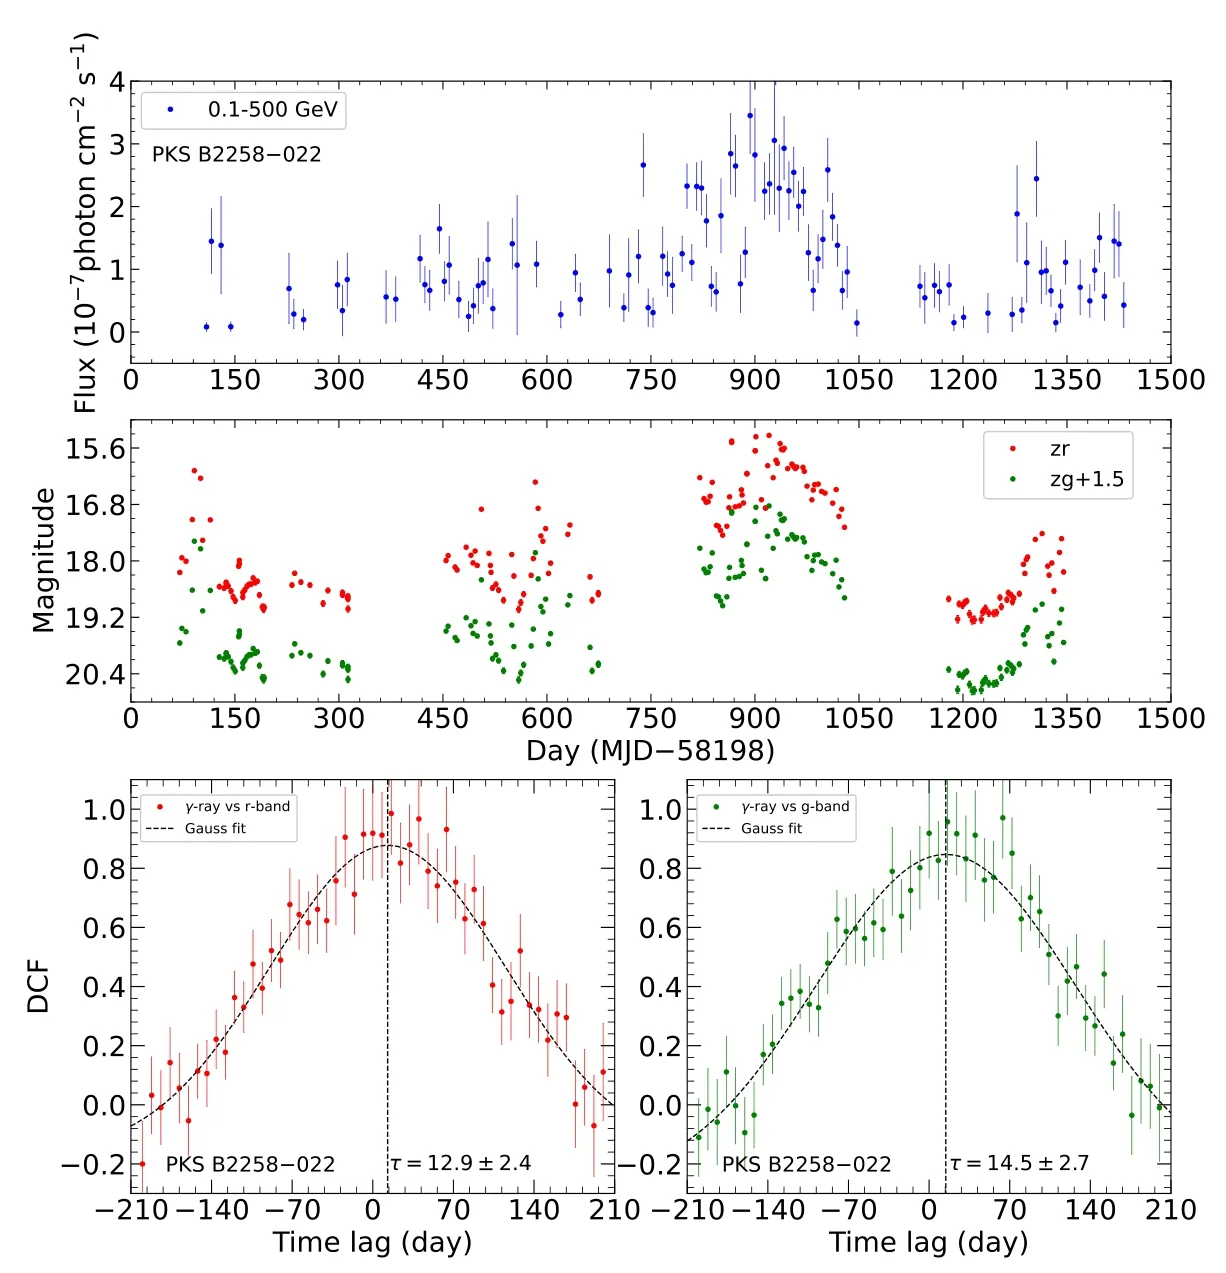
Figure A1.(Continued.)
 Research in Astronomy and Astrophysics2023年7期
- Research in Astronomy and Astrophysics的其它文章
- Unveiling the Initial Conditions of Open Star Cluster Formation
- The Spin Measurement of MAXI J0637-430: a Black Hole Candidate with High Disk Density
- The Chromatic Point-spread Function of Weak Lensing Measurement in the Chinese Space Station Survey Telescope
- Evaluation of Coronal and Interplanetary Magnetic Field Extrapolation Using PSP Solar Wind Observation
- Sodium Abundances in Very Metal-poor Stars
- Speckle-interferometric Study of Close Visual Binary System HIP 11253(HD 14874) using Gaia (DR2 and EDR3)