
1d3v PIC/MCC simulation of dielectric barrier discharge dynamics in hydrogen sulfide
2022-03-10 03:49:56JingZHANG張婧ShurongYE葉書榮TianxuLIU劉天旭andAnbangSUN孫安邦
Plasma Science and Technology 2022年2期
關鍵詞:安邦
Jing ZHANG(張婧),Shurong YE(葉書榮),Tianxu LIU(劉天旭) and Anbang SUN(孫安邦),*
1 State Key Laboratory of Safety and Control for Chemicals,SINOPEC Research Institute of Safety Engineering Co.,Ltd.,Qingdao 266071,People’s Republic of China
2 State Key Laboratory of Electrical Insulation and Power Equipment,School of Electrical Engineering,Xi’an Jiaotong University,Xi’an 710049,People’s Republic of China
Abstract In this study,we computationally examined the dynamics of dielectric barrier discharge in hydrogen sulfide.The simulations were performed with a 1d3v particle-in-cell/Monte Carlo collision model in which a parallel-plate electrode geometry with dielectrics was used.Particle recombination process is represented in the model.The discharge mode was found to be initially Townsend discharge developing from the cathode to the anode,and at the peak of the current,a more stable glow discharge develops from the anode to the cathode.A higher applied voltage results in sufficient secondary electrons to trigger a second current peak,and then the current amplitude increases.As the frequency is increased,it leads to the advance of the phase and an increase in the amplitude of the current peak.A higher dielectric permittivity also makes the discharge occur earlier and more violently in the gap.
Keywords:plasma simulation,dielectric barrier discharge,PIC simulation
1.Introduction
As new energy technologies such as solar,geothermal,and wind,have not yet been developed to maturity,oil,natural gas,and other fossil fuels will continue to play a significant role in social and economic development[1].However,due to the excessive exploitation of high-quality oil and gas resources,few now remain.This means that the industry has turned to highly acidic reservoirs,which are rich in hydrogen sulfide[2].Hydrogen sulfide(H2S)is a poisonous,corrosive,and flammable hydride gas with the characteristic foul odor of rotten eggs[3].It is considered to be a contaminant in natural gas processing due to its ability to corrode pipelines and deactivate metal-based catalysts[4].
The Claus process is the conventional industrial method for decomposing H2S by oxidation at high temperatures to generate sulfur and water vapor[5].However,the Claus process represents a significant waste of hydrogen energy due to combining the available hydrogen with oxygen to generate water.In recent years,the use of non-thermal plasma(NTP)for the decomposition of H2S has started to attract increasing attention.The main reason for this is that the products of H2S decomposition by NTP are hydrogen and sulfur,meaning that the hydrogen can be recovered.Hydrogen is recognized as a valuable resource due to its use as a raw material for the chemical industry and as a feedstock for clean-energy fuel cells[6].Compared with the Claus process,NTP decomposition not only produces hydrogen but is also a more costeffective way to handle H2S off-gassing[7,8].
The decomposition of H2S in different NTP processes(pulsed corona discharge[9,10],gliding arc discharge[11-14],microwave discharge[15],rotating glow discharge[16],and dielectric barrier discharge[17-19])has been investigated for a long time.Early in 1993,Helfritch[9]found that H2S concentrations could be reduced to very low levels by treatment with corona discharge,especially in a flowing gas.Johnet al[10]found a minimum decomposition energy consumption of about 4.9 eV/molecule-H2S in a linear tube-type pulsed corona plasma reactor,but the H2S conversion was only about 30%.By a similar method,the conversion of H2S was also tested in an arc discharge[11-14].Nunnally[11]used a gliding-arc plasma tube to obtain a highest decomposition conversion of about 40%and alowestdecomposition-energyconsumptionof 7 eV/molecule-H2S.Gutsolet al[12]found that a gliding-arc plasmas reactor in combination with a cooling unit could achieve hydrogen yields of 50%-60%,and a decomposition energy consumption of 4 eV/molecule-H2S could be achieved.Dalaineet al[13,14]investigated H2S decomposition using gliding-arc discharge in air,and they reported an energy cost ~500 eV/molecule-H2S.The best experimentally obtained specific energy requirement(SER)was found to be 0.76 eV/molecule-H2S by using a low-pressure microwave plasma reactor[15].Nevertheless,experiments on the decomposition of H2S by microwave plasma are normally carried out at sub-atmospheric pressure,and more energy is required for this reduction in gas pressure.Trauset al[16]investigated H2S decomposition in a rotating glow-discharge reactor in Ar,N2,and H2,and they achieved an energy consumption of 27 eV/molecule-H2S.
Currently,dielectric barrier discharge plasma is the most effective and promising approach to H2S gas conversion.Due to the presence of a dielectric layer,the discharge only exists for a very short period of time,and higher voltages can be applied to the reactor without fear of breakdown.Thus,a higher energy can be injected into the reaction system[17],and this can achieve a greater non-equilibrium state at normal temperatures and pressures,avoiding the use of expensive high-power nanosecond pulses.Traus and Suhr[18]applied a modified ozone generator to the decomposition of H2S.They found that the conversion of H2S was 0.5%-12%,and the minimum decomposition energy consumption was about 50 eV/molecule-H2S.Subrahmanyaet al[19]used a dielectric barrier discharge reactor with catalytically active sintered metal fibers as the inner electrode.The conversion of H2S reached 40% and the decomposition SER was about 2.8 eV/molecule-H2S when the specific energy input was 1.2 kJ l-1.
In the experimental process of dielectric barrier discharge,there are continuous short-pulse discharges,and at the microscopic level,there is a rapid increase in the number of charged particles during the discharge followed by a rapid decrease in the number of charged particles.Assuming that there is no particle annihilation,this rapid decrease cannot be realized in a simulation,which will make the results from simulation models deviate from the actual physical phenomena.Electron-ion recombination by collision is the dominant mechanism for the loss of electrons in atmospheric-pressure dielectric barrier discharge[20].In 1998,Nanbuet alproposed that the non-equilibrium recombination rate constant can be defined and calculated using the cross-section for reactive collision,which is derived from the equilibrium recombination rate constant using the inverse Laplace transform[21,22].
However,there is still a lack of effective measurement methods for the various microscopic quantities of H2S decomposed by dielectric barrier discharge methods.For example,existing diagnostic methods are unable to accurately measure the distribution of energetic particles.Therefore,it is necessary to use simulation methods to study the characteristics of the microscopic parameters of the process.In this work,we investigated H2S decomposition with a view to explaining the underlying mechanisms of its plasma properties through a 1d3v particle simulation model based on first principles.The simulation work reported here reveals the basic processes of the discharge,along with the effects of different voltage amplitudes and frequencies on the discharge patterns,particle number densities,and electron temperature distributions.The simulation results are compared with related experiments,and they show good agreement.
2.Simulation model
2.1.Computational model
The particle model employed in our study was derived from the 1d3v particle-in-cell(PIC)/Monte Carlo collision(MCC)method described in[23],which has been used to investigate capacitively coupled radio-frequency discharges in helium and was verified by comparison with the capacitively coupled radio frequency discharge benchmark[24].The flowchart of our 1d3v PIC/MCC simulations is shown in figure 1 below.Adaptive particle management,a grid-based solution of Poisson’s equation,and message-passing interface parallelism were adopted to facilitate the simulations[23,25].In this model,two charged species,electrons and H2S+ions,are considered as particles.Neutral gas molecules provide a homogeneous background with which the electrons and ions can randomly collide.The density of the neutral gas is assumed to be constant.
The collision processes considered in the simulations are listed in table 1.The cross-sections(elastic collisions,excitation,and ionization)of electron-neutral gas collisions were taken from previous reports[26-28].Assuming a similar diameter[29],which is a determining factor for hard-sphere collisions with H2S[30],the isotropic elastic scattering cross section of ion-neutral gas collisions was taken from[29],and the charge-exchange cross sections were taken from[31,32].The charge-exchange collision cross-section data in the interval of 0.02-20 eV was taken from[31],and[32]provided the charge-exchange cross section in the interval of 100-10 000 eV.These two sets of data were compared,and their trend lines were found to be consistent.Therefore,crosssection data could be fitted for the range of 0.02-10 000 eV.
It is assumed that electrons and ions moving to the dielectric will not react with the surface and adhere to it.Secondary electron emission(SEE)from the surface is taken into account,and a SEE coefficient γiis used for the impact of positive ions.A positive surface charge is left on the dielectric as a result of SEE.Thus,the surface charge density σschanges in time as
whereeis the elementary charge,and the other terms correspond to the fluxes at the gas-dielectric boundary:Γefor electrons,for positive ions.
Poisson’s equation can yield the electric field strengthE:

where ε is the dielectric permittivity,ρ is the volume chargedensity,and δsmaps the surface charge σson the gas-dielectric interface to the grid cells adjacent to the dielectric.At the gas-dielectric boundary,the normal component of the electric field needs to satisfy the discontinuity condition
where ε0and ε1denote the vacuum permittivity and dielectric relative permittivity,respectively,andE1andE2are the electric field components normal to the interface.
Electron-ion recombination collision is realized by a particle recombination module,which uses ideas from fluid simulations.We define the particle source termSi(m-3s-1),indicating the number of particles compounded off per unit time per unit volume:
wherefrerepresents the total number of complex reactions,nerepresents the number density of electrons involved in the reaction(m-3),nirepresents the number density of ions involved in the reaction(m-3),narepresents the number density of neutral molecules involved in the reaction(m-3),krirepresents the reaction rate coefficient of theith reaction,kr(T)=k0(T0/T)n,wheren<3/2.Then,the number of recombination within each spatial grid point is

where Δtis the time step andVcellis the grid cell volume.The recombination collision processes considered in the simulations are listed in table 2.The electron-ion recombination collision reaction rate is taken from a previous report[33].
2.2.Initial computation conditions
The geometry of the simulation uses a parallel-plate electrode with two dielectric layers,as shown in figure 2.The computational length is 5 mm,and 1 mm dielectrics are present on both sides.The coefficients of sticking effect were set as 1.0 on both sides,i.e.all charged particles arriving at the boundary of the dielectric are adsorbed as a surface charge.The dielectric relative permittivity(ε)was set as 4.5,and the effect of this on surface discharges will be discussed in section 3.4.Under a pressure of 0.1 atm,the electron density can reach the order of magnitude 1018m-3,which means its Debye radius will be 1.2×10⁻⁵m and its oscillation frequency will be 5.64×10¹⁰Hz.Therefore,the spatial lattice length and time step were set to Δx=10-6m and Δt=2×10-12s,respectively,to meet the accuracy requirements of the PIC/MCC algorithm.
Pure H2S gas at 0.1 atm and 300 K was used in the simulation.The voltage source 3 kV at a frequency of 500 kHz was applied at the left boundary,and the right side was connected to ground.Nevertheless,the effects of voltage’s frequency and amplitude on discharge are discussed in sections 3.2 and 3.3.The background density of electrons and positive ions was set to 1015m-3[34].
3.Results and discussions
In section 3.1,the particles are initially seeded uniformly across the gas gap to study the development process of dielectric barrier discharge under an H2S atmosphere at 0.1 atm.The subsequent sections describe the systematic investigation of the influence of several parameters on the dielectric barrier discharge:the voltage amplitude(section 3.2),the voltage frequency(section 3.3),and the dielectric permittivity(section 3.4).Table 3 summarizes the parameters and their values for each part of the survey.

Table 1.Collision processes considered in hydrogen sulfide dielectric barrier discharge.

Table 2.Recombination collisions considered for modeling of dielectric barrier discharge in hydrogen sulfide with references to the source of cross-section data.

Table 3.Parameters of the simulations and their values in each section.Here, U is the applied voltage, F is the voltage frequency,and εr is the relative permittivity of the dielectric.

Table 4.Maximum surface charges and air gap voltages at different dielectric constants.
3.1.Discharge characteristics of dielectric barrier discharge in H2S
The simulation described in this subsection had a duration of 5.5 cycles,and it reached stability after the second cycle.Cycles 4-5 were selected for analysis.Previous experiments have revealed that current peaks occur at each voltage crossing point[35].Our numerical model also revealed a similar phenomenon.Figure 3 shows the evolution of the current density and the source voltage.
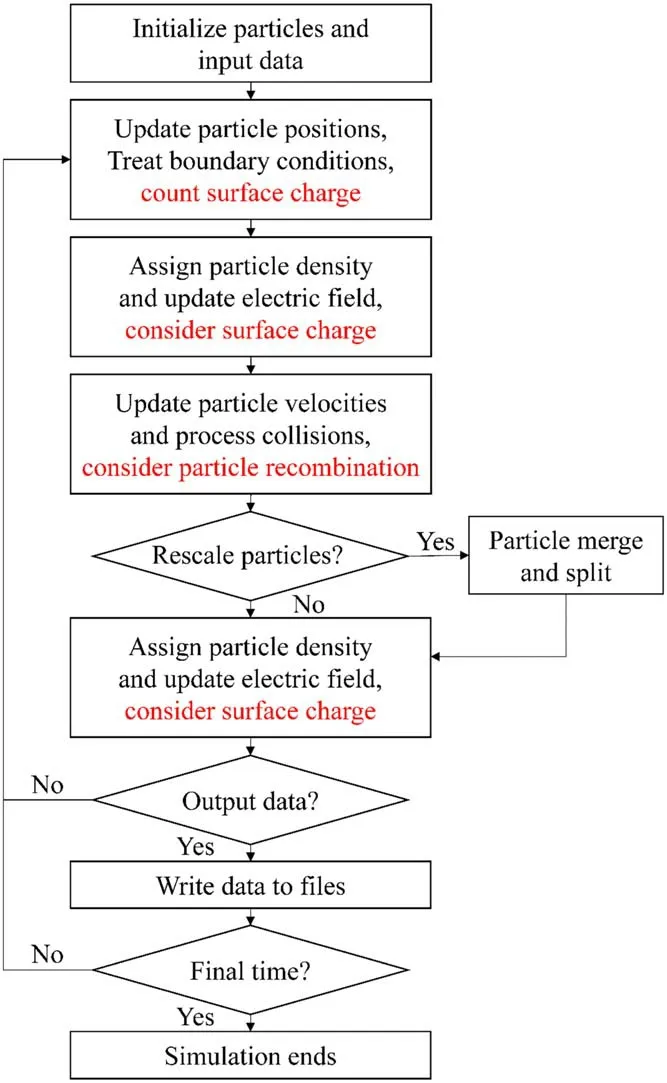
Figure 1.Flowchart of the PIC/MCC simulation.Red color shows the new modules added to this model that differ from[23].
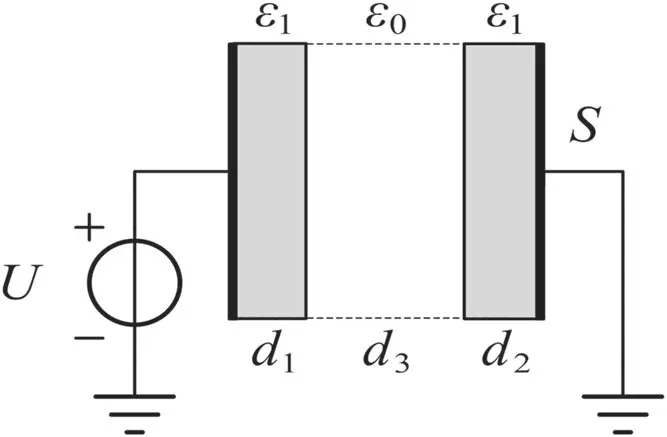
Figure 2.The computational domain.A parallel-plate geometry is used,with dielectrics present on both sides.

Figure 3.Current density and source voltage waveforms after stabilization.
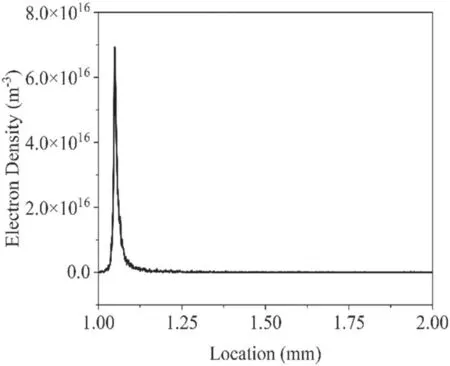
Figure 4.Spatial distribution of electron density at point A.
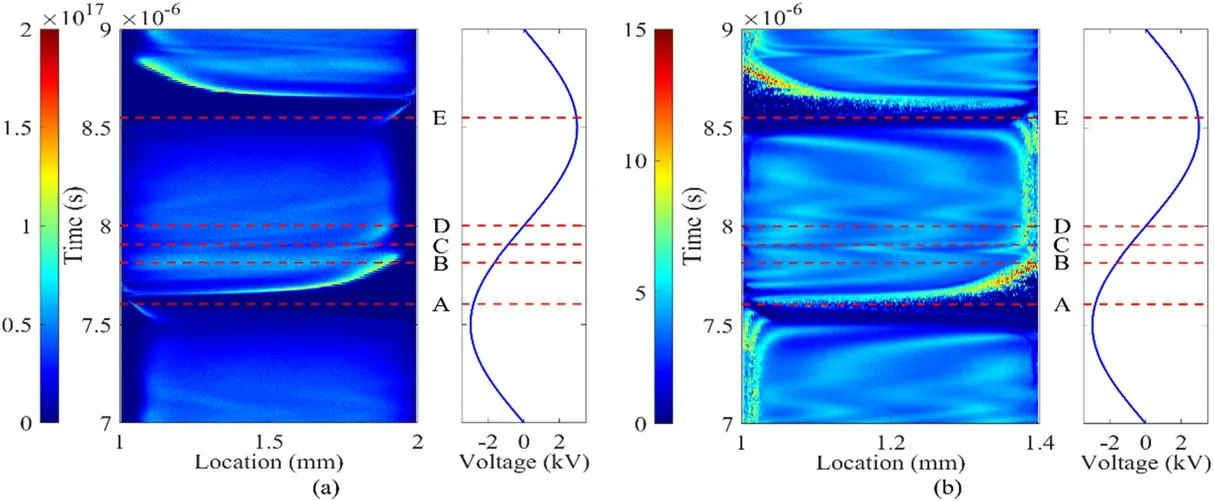
Figure 5.Spatial-temporal distributions of(a)electron number density and(b)average energy of electrons.
To explore the discharge process further,five specific moments in time were considered-A,B,C,D,and E-as shown in figure 3.Moment A corresponds to the time when the rising current pulse passes zero,moment B corresponds to the peak of the discharge,moment C corresponds to the time when the discharge current drops to a local minimum value,moment D corresponds to a time when the discharge current rises again to a local maximum value,and moment E corresponds to a time when the current drops again to zero,at which point the actual anode is atx=1 mm and the actual cathode isatx=2 mm.For thiscondition,Pd=1013.25 cm·Pa,and the discharge characteristics can be explained using Townsend discharge theory.BecausePdis small,photons are not easily captured by gas molecules to form photo-ionization,and the secondary electrons of the selfsustained discharge are mainly generated by positive ions hitting the cathode.As such,the photo-ionization module was not introduced into this particle model.
Figure 4 shows that a Townsend-type electron avalanche occurred before moment A with a peak of 7.0×10¹⁶m-3,and this developed from the cathode to the anode(about 0.1 μs).Thermal diagrams of the spatial and temporal distribution of the electron density and electron energy between 6×10⁻⁶s and 1×10⁻⁵s are shown in figures 5(a)and(b),respectively.Clearly,figure 5(a)shows that the electron density peak moves toward the anode with increasing time and gradually increased before moment A.Then,in the transition to moment B,the electron collapse develops rapidly from the anode to the cathode,and the electron density increases exponentially,reaching a maximum value of 1.1×10¹⁷m-3.
Considering the spatial and temporal distribution of the average energy of electrons,it can be seen that the electron energy is very low at moment A across the whole simulation domain.Between A and B,the electrons with higher energy shown in figure 5(b)(greater than the ionization energy of H2S,which is 10.38 eV)and the peak of the electron density in figure 5(a)overlap and are concentrated in the avalanche head,indicating that the ionization is the strongest here.Finally,the secondary electron avalanches move from the cathode to the anode and converge into the main electron avalanche.The enhanced electric field at the head of the avalanche drives the main electron avalanche to move continuously toward the cathode.It can be seen that a transition from Townsend discharge to glow discharge takes place between A and B.
Figure 3 shows that the current density decreases between moments B and C,and the current increases again from C to D.In figure 6,we consider moment B,the period between moments B and C,moment C,the period between moments C and D,and moment D to plot the spatial distributions of electron density,ion density,and electric field strength.As shown in figures 6(a)-(c),there is an electron avalanche towards the cathode,and the electron density at the head of the electron avalanche at moment B is 1.1×10¹⁷m-3.Between moments B and C,collision ionization produces a large number of ions(peak 1.95×10¹⁸m-3)moving towards the cathode while the sheath layer is getting shorter.These ions hit and are adsorbed onto the dielectric plate to form a surface charge,and the total number of ions in the cathode sheath layer decreases,leading to a decrease in the electric field strength from 1.85×10⁶to 1.0×10⁶V m-1.Between moments C and D,firstly,the high-energy ions generated by the electron avalanche between moments B and C hit the cathode,resulting in the acceleration of the secondary electrons generated by the γ process in the sheath layer to form an electron avalanche toward the anode,as shown in figures 6(c)and(d).Then,between moments C and D and at moment D,the electron avalanche moves toward the cathode in the very short sheath layer region of 1.95-2.00 mm,as shown in figures 6(d)and(e),respectively.Observation of figure 3 shows that the current tends to rise in this period,indicating that a process similar to the transformation from Townsend discharge to glow discharge occurs,which is consistent with the period between moments A and B.
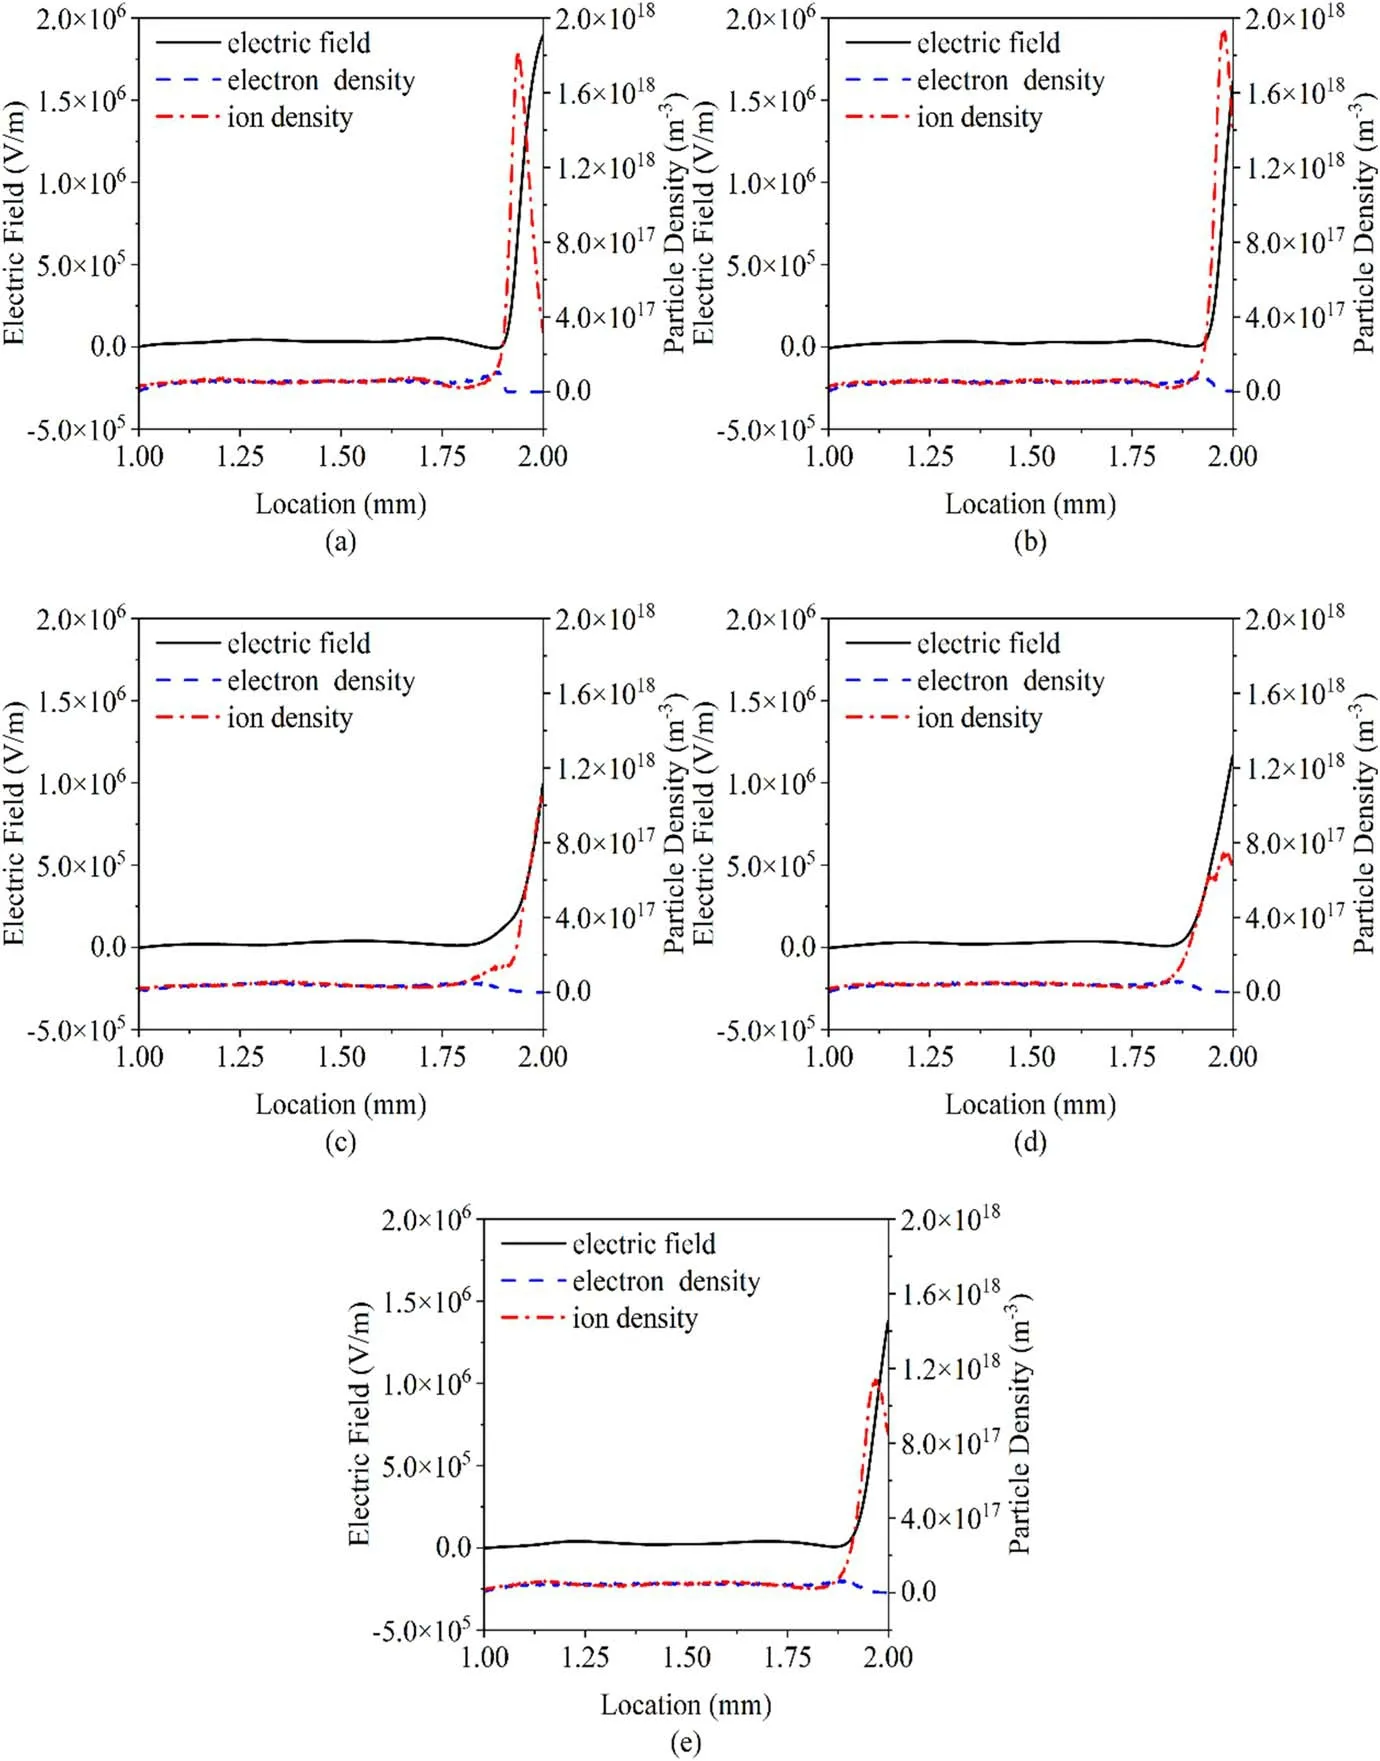
Figure 6.Densities of charged particles and field-strength distributions(a)at moment B,(b)between moments B and C,(c)at moment C,(d)between moments C and D,and(e)at moment D.
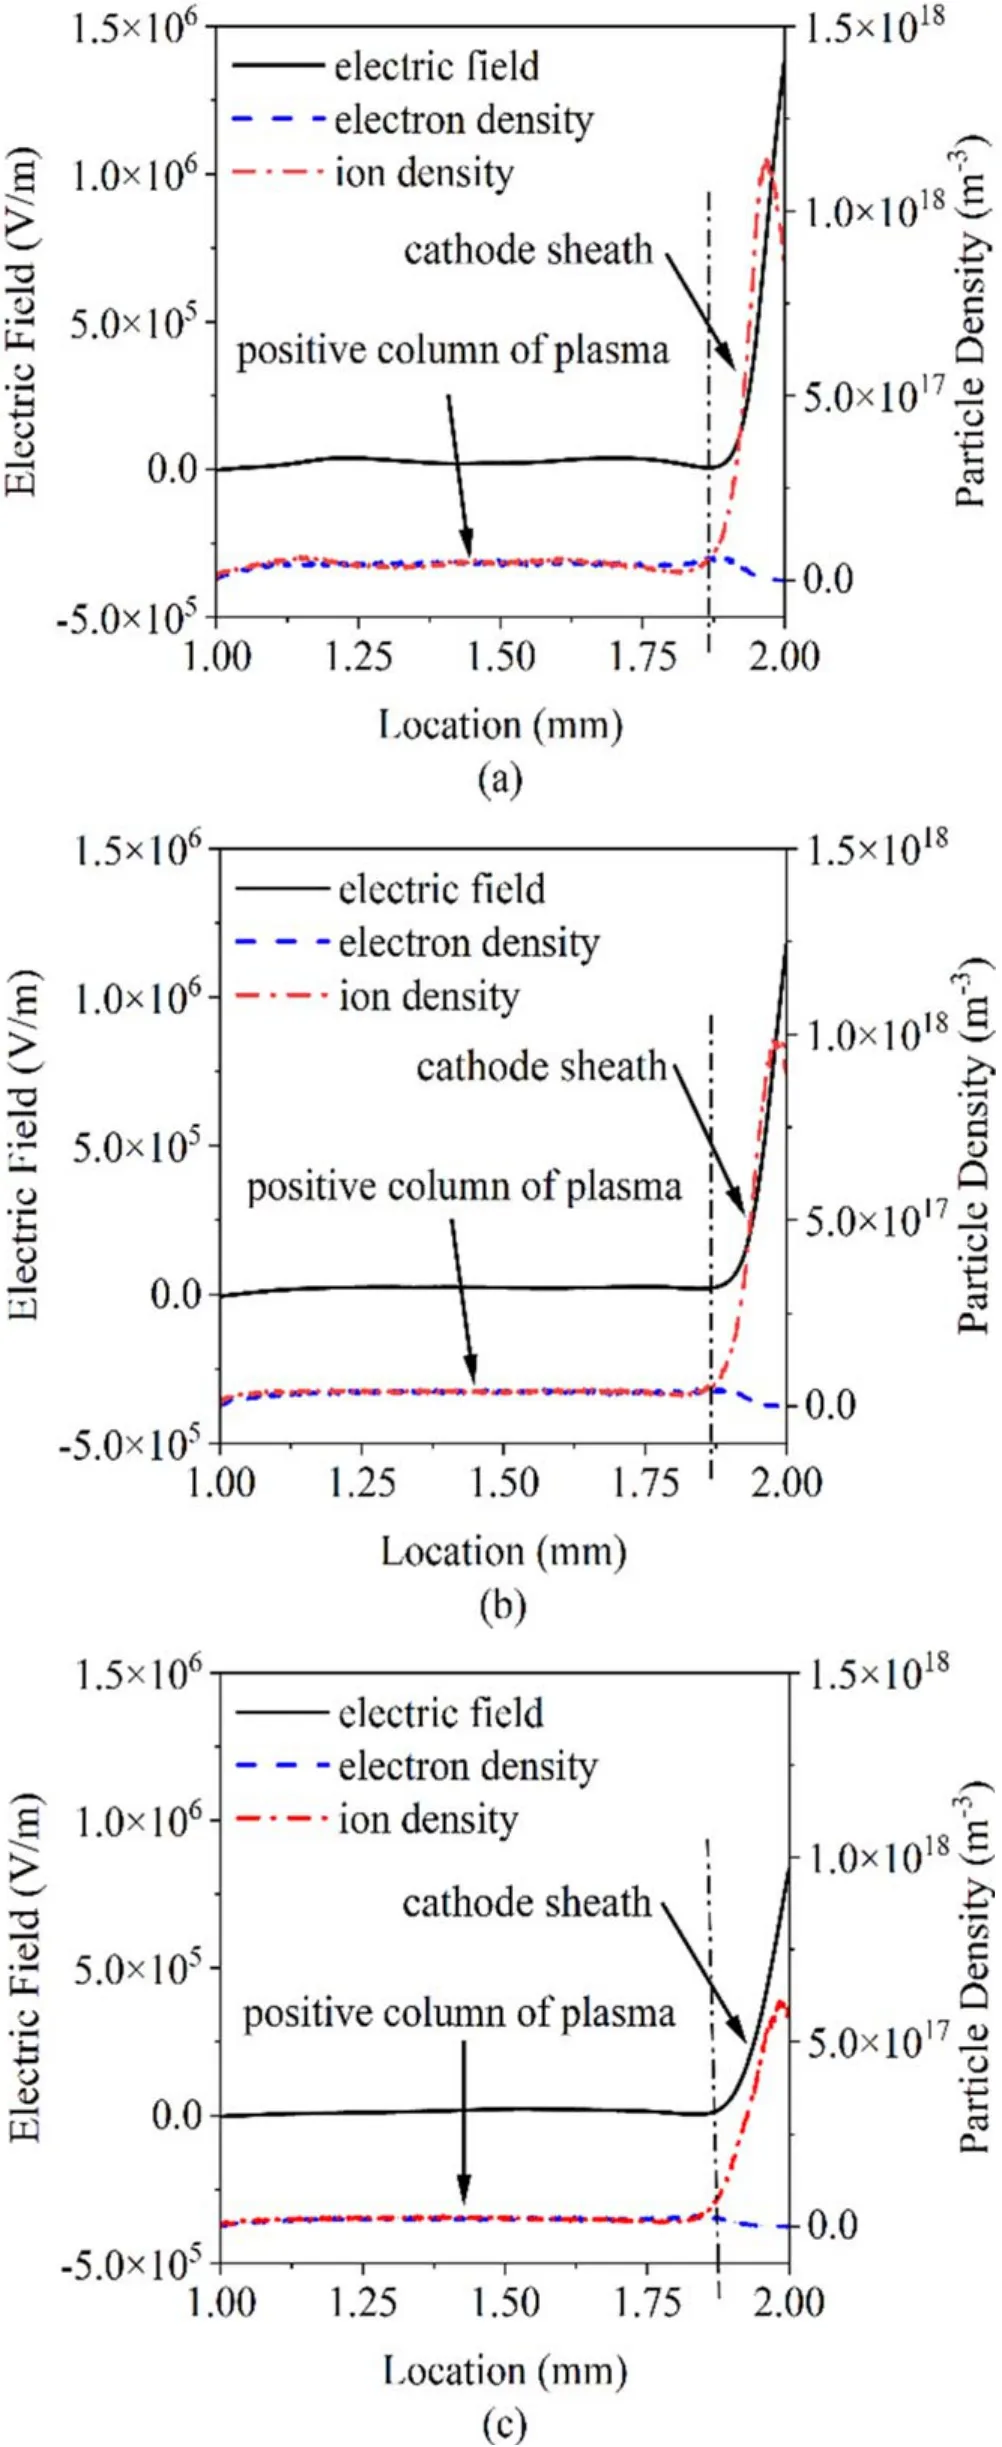
Figure 7.Densities of charged particles and field strength distributions(a)at moment D,(b)between moments C and D,and(c)at moment D.

Figure 8.Current density curves at different voltages.
At moment D,all the ions are low-energy ions newly generated from the secondary electron avalanche.Although the field strength is still very high in the 50 μm sheath,the ion mass in the sheath cannot obtain enough energy to make another impact on the cathode and lead to a violent γ process,so the discharge enters a stable glow mode after moment D.
Now we analyze the process from moment D to the end of moment E,i.e.half a cycle of discharge.This is a period of stable glow discharge.We choose moment D,the period between moments D and E,and moment E,and plot the electron and ion number densities and the spatial distribution of the electric field to analyze the characteristics of the discharge,as shown in figure 7.
In the positive column region of the plasma,the densities of electrons and ions are low and similar,and the electric field intensity tends to be uniformly 0.In the right-hand side of the cathode sheath,the ion concentration increases rapidly with increasingxcoordinate,while the electron concentration decreases.The electric field intensity increases from 7.5×10⁵to 1.35×10⁶V m-1,and the left boundary of the sheath is maintained near 1.8 mm and slowly moves toward doing so.Figure 7 shows that the energetic electrons are concentrated in the sheath region.The synthetic electric field continuously accelerates the ions in the sheath layer to hit the cathode and produce secondary electrons with high energy.As time goes by,the maximum ion densities are 1.1×1018,1.0×1018and 0.6×10¹⁸m-3,respectively.The reason for this is that the rate of new ion production by electrons through the α process is smaller than the combined rates of chargedparticle recombination and annihilation by collision with the electrodes.As shown in figure 7,the plasma patch is present at a certain distance from the dielectric surface and is not fully connected to it.Other simulations of dielectric barrier discharge have resulted in a similar sheath phenomenon being observed[36-39].
3.2.Effect of applied voltage
By simulating applied voltages of 1,3 and 5 kV,we investigated the effect of the applied voltage on dielectric barrier discharge.Figure 8 shows the applied voltage and current density curves,with the voltage amplitude normalized to observe the current phase at different voltages.As the applied voltage increases,the peak current density gradually increases,while the phase of the current peak is advanced,as also observed in[40].Because the potential difference value remains the same,the air-gap breakdown voltage remains the same.The applied voltage field increases with increasing voltage amplitude,and the time required for the same breakdown field is shorter for a higher voltage amplitude.
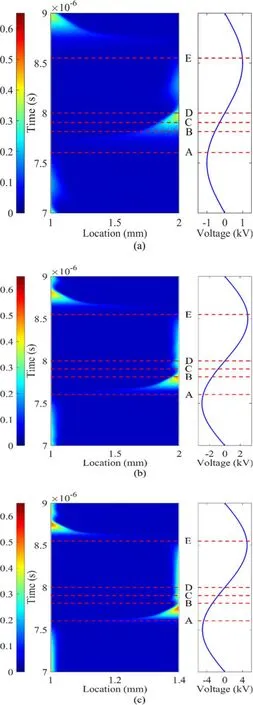
Figure 9.Spatial-temporal distributions of the average energy of ions at(a)1 kV,(b)3 kV and(c)5 kV.

Figure 10.Current density curves at different frequencies.
The applied voltage amplitude also has an impact on the shape of the discharge current.In our case,if the applied voltage is 3 or 5 kV,the current drops slightly after the first current spike and then rises to form a second peak when the voltage passes the zero point.However,when the applied voltage is 1 kV,there is only one current peak,and the current does not rise again.The second peak is caused by the large number of ions generated by the primary electron avalanche hitting the cathode plate,which accelerates the secondary electrons generated in the sheath layer and they then move toward the anode,forming an electron avalanche,as described in section 3.1.Figure 9 shows the spatial-temporal distribution of the average energy of ions at different voltages.It can be clearly seen that when the applied voltage is low,the ion energy within the first primary electron avalanche is low and is not sufficient to generate enough secondary electrons.
3.3.Effect of frequency
The frequency of the applied voltage can be varied over a wide range.By simulating frequencies of 50,100 and 500 kHz,we investigated the effect of the applied frequency on dielectric barrier discharge.
The current density curves at 50,100 and 500 kHz are shown in figure 10,and these are normalized for frequency to compare the phase and amplitude.The peak current density increases with increasing power-supply frequency,and the phase lags with increasing frequency,in agreement with the simulation results of[40].Figures 11 and 12 show the spatial distribution of electron number density at the time of peak current density and the change of charge on the surface of the left-hand pole plate during one cycle,respectively.The discharge current is the sum of the conduction current and the displacement current,so we can analyze the reason for the increase in the current density with increasing frequency from two perspectives.First,the capacitive impedance of the loop decreases with increasing frequency,so the displacement current increases.Second,the higher the frequency,the higher the density of electrons in the discharge,and the discharge is thus stronger,leading to a larger conduction current.
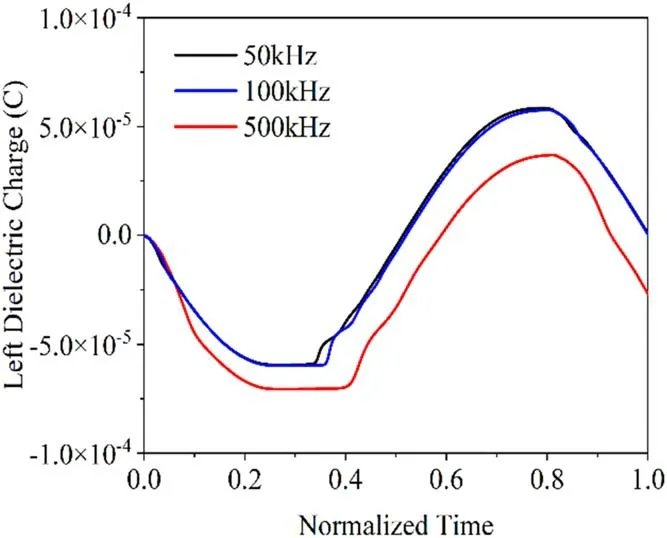
Figure 11.Charge curves of the pole plate at different frequencies.
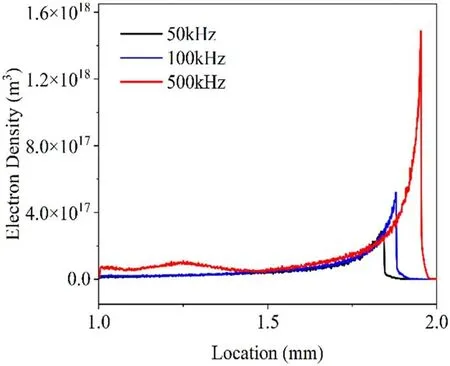
Figure 12.Spatial distributions of electron number density at the moment of discharge at different frequencies.
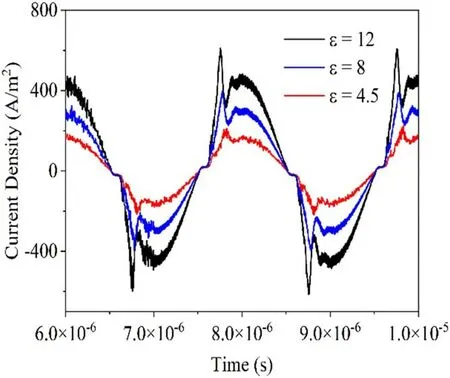
Figure 13.Curves of discharge current density versus time for different dielectric constants.

Figure 14.Temporal distributions of surface charge for dielectric plates with different dielectric constants.
When the power-supply frequency is low,electrons and ions have enough time to move to the dielectric plates.When the power-supply frequency is higher,the synthesized field strength will turn before the charged particles have moved to the pole plate,resulting in less charge reaching the dielectric plate than at lower frequencies.The charge accumulation at lower frequencies is thus greater at higher frequencies,producing stronger electric fields and prompting the discharge to occur earlier.
3.4.Effect of dielectric permittivity
Generally different dielectric materials have different dielectric permittivity ε,which varies across a wide range.By simulating relative permittivity values of 4.5,8 and 12,we investigated the effect of relative permittivity on dielectric barrier discharge.
Figure 13 shows the effect of different dielectric constants on the discharge current density.When the dielectric constant of the plate increases,the discharge current also increases,and the phase of the peak discharge current is advanced.This phenomenon can be explained by the trends of the dielectric plate surface charge and air-gap voltage over time.Figure 14 shows the effect of different dielectric constants on the number of charges on the dielectric plate surface.It can be seen that as the dielectric constant is increased from4.5 to 12,the charge accumulated on the surface of the dielectric plate increases significantly,by a factor of about 2.7.In contrast,the peak air-gap voltage at breakdown increases only slightly,by about 10%.The relevant values are shown in table 4.
Paschen’s law shows that the breakdown voltage of the gas gap is a function of the product of the gas pressurepand the gap distanced,and it is also affected by factors such as the spatial density of the charge in the gap.Therefore,the breakdown voltage of the gas gap does not vary much for a given air-gap and pressure.
According to Kirchhoff’s law of voltage,the supply voltageUis equal to the sum of the air-gap voltage and the dielectric plate voltage.When breakdown occurs,the dielectric plate voltage does not change significantly because the peak and phase of the air-gap voltage do not change significantly.From the definition equation of a capacitor,Q=CU,and the capacitance value of a parallel-plate capacitor,
it can be seen that the capacitance value is proportional to the relative dielectric constant.Therefore,the amount of charge accumulated on the dielectric plate is proportional to its dielectric constant.A change in the dielectric constant from 4.5 to 12 represents an increase of 2.67 times,and the peaks of surface charge increased by 2.7 times;these values are very similar.Since the dielectric plate accumulates more surface charge with a higher relative permittivity,it can generate a stronger electric field,making the discharge occur earlier and more violently in the gap.This explains the phenomena of the current peak increasing with the permittivity and the advancing of the phase.
4.Conclusions
In this study,a 1d3v particle model for dielectric barrier discharge was developed.This model includes some new features,such as adaptive particle management,a grid-based solution of Poisson’s equation,and MPI parallel processing.The model was used to investigate the dielectric barrier discharge characteristic in an H2S atmosphere.
Our main findings can be summarized as follows.In the basic process,Townsend discharge develops from the cathode to the anode at the peak of the current,and then a more stable glow discharge is established from the anode to the cathode.When the voltage amplitude is high,there are two peaks in the discharge.The reason for this is that the ion energy within the first primary electron avalanche is sufficient to generate enough secondary electrons to trigger a second current peak.As the power frequency is increased,the discharge becomes more intense and the steering time of the externally applied electric field becomes shorter.This leads to the advancing of the phase and an increase in the amplitude of the current.A higher dielectric permittivity also increases the ability of the parallel-plate capacitor to store surface charge and generate a stronger electric field,making the discharge occur earlier and more violently in the gap.
Because of the computational cost of particle simulations,we here focused on describing the dynamics of a dielectric barrier discharge in hydrogen sulfide,and more effective models are under development to investigate H2S conversion and decomposition energy consumption in the DBD.
Acknowledgments
This work was supported by National Natural Science Foundation of China(Nos.21503279,51777164,and 52077169)and the Fundamental Research Funds for the Central Universities,China(Nos.xtr042019009 and PY3A083)and HPC Platform,Xi’an Jiaotong University.
猜你喜歡
Chinese Physics B(2023年2期)2023-03-13 09:18:52
Plasma Science and Technology(2022年9期)2022-08-29 00:42:44
Chinese Physics B(2021年5期)2021-05-24 02:22:32
課程教育研究(2021年29期)2021-04-14 01:07:44
中國(韓文)(2018年6期)2018-11-20 03:09:26
三聯(lián)生活周刊(2017年26期)2017-06-29 18:16:18
證券市場周刊(2017年20期)2017-06-20 17:14:13
中國經濟周刊(2016年14期)2016-04-19 12:11:07
知識經濟·中國直銷(2016年11期)2016-02-27 16:17:28
中國證券期貨(2015年2期)2015-03-31 01:44:35
 Plasma Science and Technology2022年2期
- Plasma Science and Technology的其它文章
- Application of local Monte Carlo method in neutronics calculation of EAST radial neutron camera
- Effect of gas pressure on ion energy at substrate side of Ag target radio-frequency and very-high-frequency magnetron sputtering discharge
- Numerical simulation of hydrogen arcjet thruster with coupled sheath model
- An electromagnetic wave attenuation superposition structure for thin-layer plasma
- Plasma-assisted ammonia synthesis in a packed-bed dielectric barrier discharge reactor:roles of dielectric constant and thermal conductivity of packing materials
- A fast convergence fourth-order Vlasov model for Hall thruster ionization oscillation analyses