
A Novel Sensing Imaging Equipment Under Extremely Dim Light for Blast Furnace Burden Surface:Starlight High-Temperature Industrial Endoscope
2024-04-15 09:36:50ZhipengChenXinyiWangWeihuaGuiJilinZhuChunhuaYangandZhaohuiJiang
Zhipeng Chen , Xinyi Wang , Weihua Gui ,,, Jilin Zhu ,Chunhua Yang ,,, and Zhaohui Jiang ,,
Abstract—Blast furnace (BF) burden surface contains the most abundant, intuitive and credible smelting information and acquiring high-definition and high-brightness optical images of which is essential to realize precise material charging control,optimize gas flow distribution and improve ironmaking efficiency.It has been challengeable to obtain high-quality optical burden surface images under high-temperature, high-dust, and extremelydim (less than 0.001 Lux) environment.Based on a novel endoscopic sensing detection idea, a reverse telephoto structure starlight imaging system with large field of view and large aperture is designed.Combined with a water-air dual cooling intelligent self-maintenance protection device and the imaging system, a starlight high-temperature industrial endoscope is developed to obtain clear optical burden surface images stably under the harsh environment.Based on an endoscope imaging area model, a material flow trajectory model and a gas-dust coupling distribution model, an optimal installation position and posture configuration method for the endoscope is proposed, which maximizes the effective imaging area and ensures large-area, safe and stable imaging of the device in a confined space.Industrial experiments and applications indicate that the proposed method obtains clear and reliable large-area optical burden surface images and reveals new BF conditions, providing key data support for green iron smelting.
I.INTRODUCTION
ENERGY saving and emission reduction are the most important themes in the steel industry development [1].As the most critical equipment in steel smelting, the energy consumption and cost of the blast furnace (BF), accounts for about 60%-70% of the steel manufacturing process, and its CO2emission accounts for more than 90% of that, which has significant high-carbon characteristics [2].Therefore, controlling energy consumption of BF is the key to realize green production in the steel industry [3].
The BF top is the core window for the operation and fine control of the blast furnace.As the most critical parameter for furnace top control, the burden surface topography information can effectively reflect the operation conditions and distribution of the flow field in BF top, which are important references for guiding the refinement of burden distribution,improving gas flow and dust distribution, ensuring smooth operation of BF and saving energy [4].However, the complex environment inside the BF severely limits the detection range and performance of traditional equipment, making it difficult to obtain clear and bright burden surface images, specifically in the following aspects: First, to prevent the leakage of highpurity toxic gases, BF is enclosed without light, and its internal burden layer has a strong light-absorbing effect, making the illumination inside the BF top reach a starlight level of 0.001 Lux, so it is difficult to acquire bright images of burden surface under this extremely dim light environment [5]; Second, the BF top temperature typically ranges from 200 °C to 400 °C.Under abnormal operating conditions, it even reaches as high as 800 °C to 1000 °C.In such a high-temperature environment, conventional detection equipment faces challenges in maintaining long-term stable operation, making it extremely difficult to perform close-range burden surface detection [6]; Finally, there is high dust concentration within the BF top ranging from approximately 40 to 100 g/m3.Under the influence of pressure difference, the suspended dust in the BF top space forms a layer of dust.This dust layer not only erodes and damages the equipment shell but also blocks the detection hole and interferes the detection accuracy, severely limiting the value of detection equipment in BF top [7], [8].
Therefore, traditional detection equipment in BF top has given up the direct detection of the most abundant, intuitive,and reliable optical image information of the BF burden surface.Instead, utilize the mechanical probe, industrial radar,laser scanner and infrared camera to indirectly estimate the burden surface morphology, gas flow field, and dust field status based on limited point-level information or flow field information [9], [10].These methods commonly suffer from low detection accuracy and lack of furnace condition information, making it difficult to achieve precise charging control and leading to frequent abnormal operating conditions.
To obtain high-precision and real-time morphological imaging information of the BF top burden surface, a starlight hightemperature industrial endoscope (SHIE) detection method is proposed.This method consists of three parts: the design of a starlight optical imaging system with large depth of field and wide field of view, development of an intelligent self-maintenance protection device with water-air dual cooling system and the optimal installation posture configuration of SHIE.Firstly, to improve the imaging quality of endoscope in starlight environment, a starlight optical imaging system with large depth of field and wide field of view is designed.Specifically, a reverse telephoto structure and the high-transmission Hopkins relay lens are employed to increase the field of view and minimize light loss of the optical system, enabling the endoscope to have an extremely wide imaging range with large field of view characteristics, achieving starlight-level imaging performance.Secondly, to ensure long-term stable operation of SHIE in the harsh environment of BF top, the intelligent self-maintenance protection device with water-air dual cooling system is developed.Thirdly, to capture the complete burden surface morphology information, the maximum burden-surface imaging optimization model for the endoscope is established.Based on the material flow trajectory model and the dust distribution model in BF top, the constraints for the model are determined.By utilizing the particle swarm optimization (PSO) algorithm, the optimal installation scheme for the endoscope is obtained, which enables the endoscope to capture the complete burden surface images while avoiding the material flow and high-concentration dust inside the BF top, providing sufficient smelting status information for the onsite operation of BF.
To summarize, the main contributions of this paper are as follows:
1) A starlight optical imaging system with large depth of field and wide field of view is designed to obtain high-definition and high-brightness images of whole burden surface.
2) An intelligent self-maintenance protection device with water-air dual cooling system is developed to ensure the safe operation of equipment.
3) The optimal installation posture configuration of the equipment is obtained, which enables the endoscope to capture the complete burden surface morphology image and to avoid the material flow and high-concentration dust inside the furnace.
4) Both the qualitative and quantitative results on the captured burden surface images demonstrate the superiority of our approach over existing methods.
The rest of this paper is organized as follows: Related works are discussed in Section II.Section III describes the principle and structure of the developed industrial endoscope; Section IV introduces the installation scheme of the endoscope; Section V discusses the simulation and field test results; Finally,the work is concluded in Section VI.
II.RELATED WORK
This section gives a brief introduction of existing methods on the detection of BF burden surface information.There are two types of methods: the mathematical methods and the physical methods.
A. The Mathematical Methods
The mathematical methods utilize detection equipment to obtain the height information of each point on the burden surface and then adopt surface fitting methods to indirectly reconstruct the burden surface morphology.These methods include mechanical stock rod measurement, indirect judgment,laser scanning, and radar imaging.
The mechanical stock rod measurement method uses a mechanical probe between the inner walls of the BF throat to get 2- or 3-points’ height information of the BF stockline [11],which suffers from long-time measurement and limited information, and cannot measure continuously.The indirect judgment method combines the worker experience with the temperature data of the burden surface measured by a cross-temperature measurement device to estimate the approximate distribution of the burden surface.This method is subjective and lacks a quantitative description of the burden surface [12].The laser scanning method utilizes cameras to measure the twodimensional coordinates of the laser spot projected on the burden surface, thereby reconstructing the appearance of the burden surface [13].However, under the influence of dust and water vapor, the accuracy of this method is reduced and the laser head is easily scabbed and blocked.For the radar imaging method, using the phase difference between the transmitted signal and the received signal of the mechanical swing radar, the height information on the burden surface is measured point by point to reconstruct the shape of the burden surface.This method is greatly affected by the dust in the furnace, and multiple detection holes must be opened on the BF top, which easily affects the airtightness of BF and brings safety hazards to the steel production [14], [15].
To sum up, the mathematical methods can only obtain limited point-level height information and indirectly estimate the burden surface morphology, which are unable to provide accurate and reliable burden surface morphology information.
B. The Physical Methods
The physical methods include the video capturing method,the infrared thermal imaging method and the high temperature industrial endoscope method, which directly obtain image information of the BF burden surface from the detection equipment.
The video capturing method collects the burden surface information through the camera, but due to the dark and dusty environment, the expected image cannot be captured [16].The infrared thermal imaging method estimates the burden surface shape by obtaining the temperature distribution of the burden surface through infrared images.This method cannot accurately obtain the burden surface shape and is easily influenced by the high-temperature gas [17].The high temperature industrial endoscope method is a pioneering idea of us to use endoscopic optical imaging to detect the burden surface in BF top.The high-temperature industrial endoscope got far into the hinterland of the BF top, placing high-temperature-resistant optical lens inside the BF through the guiding fibers with the imaging chip outside.This method can obtain burden surface images, breaking the “black box” state on the BF top.However, the obtained burden surface images suffer from small imaging field of view, insufficient depth of field, low signalto-noise ratio and limited information in the starlight environment, therefore, the equipment requires to be optimized[18]-[20].
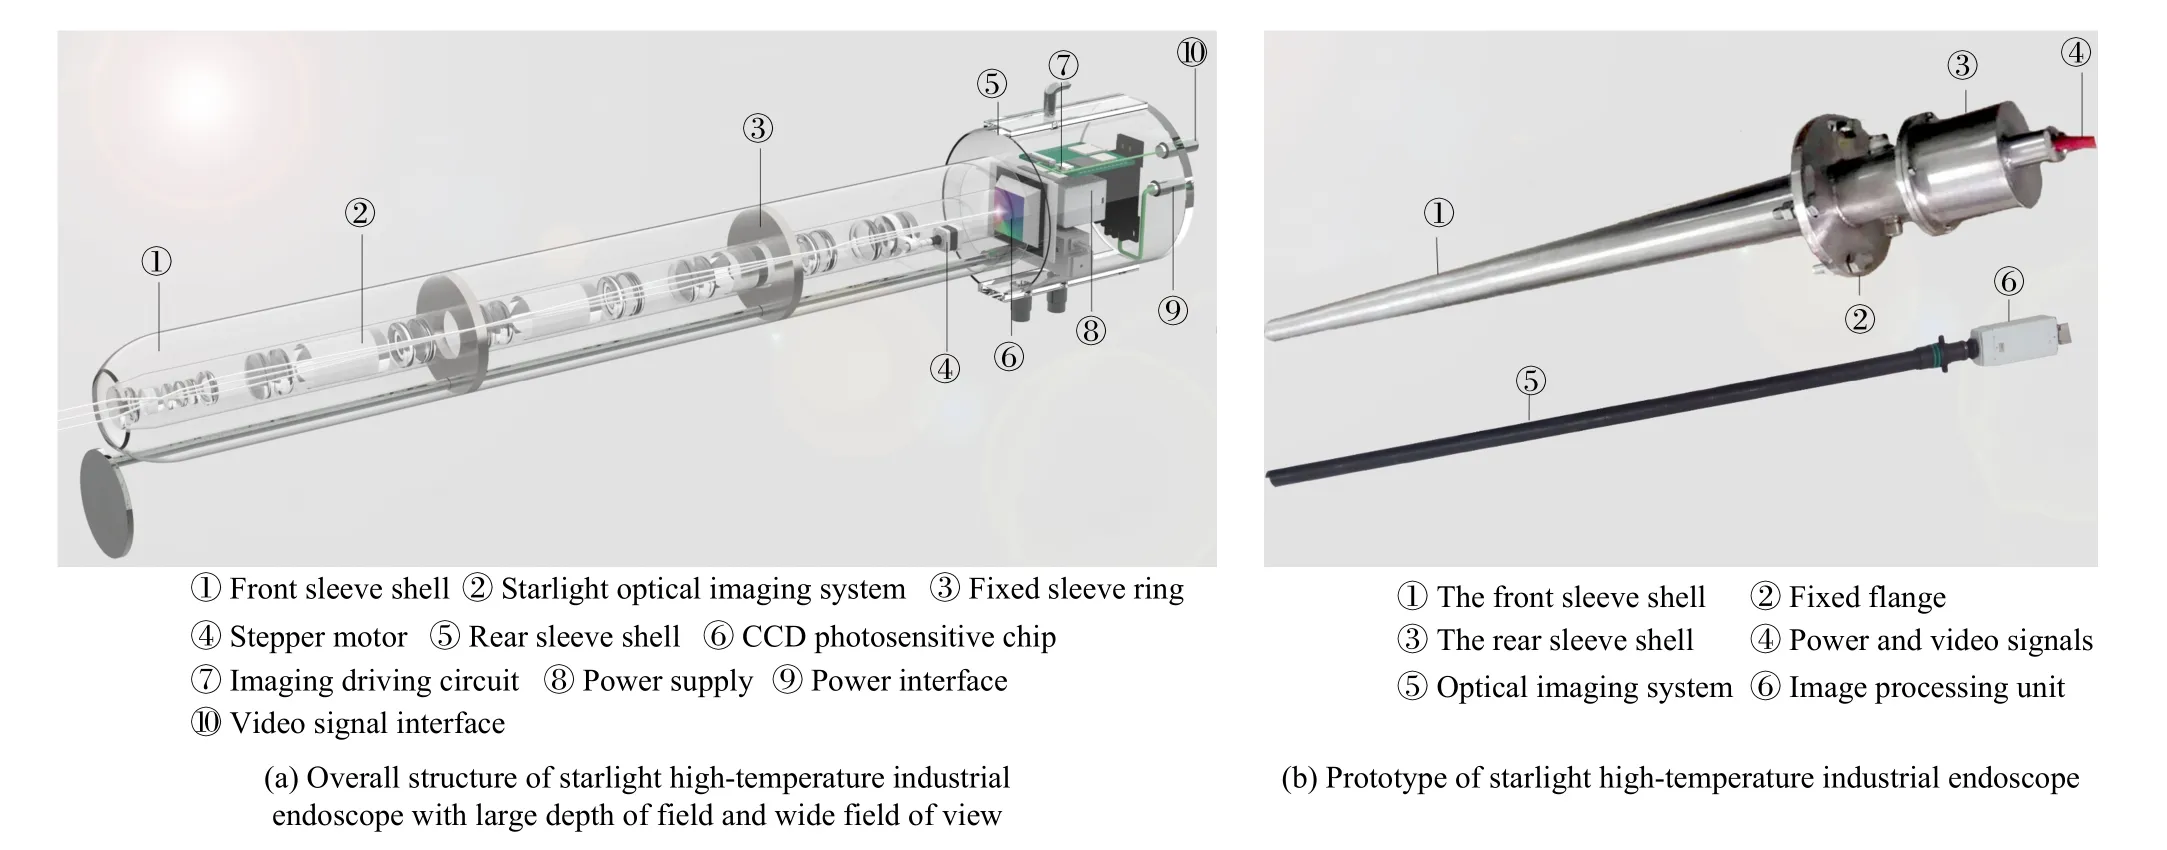
Fig.1.Structure and prototype of starlight high-temperature industrial endoscope with large depth of field and wide field of view.
To intuitively reflect the difference between different burden surface detection methods, data detected by different detection methods are compared in detail under different evaluation indicators.The comparison results are listed in Appendix A.As shown in Appendix A, the mechanical probe,the mechanical swing radar and the laser scanner can only obtain the height of material level at limited points on the burden surface, and indirectly estimate the trend of burden surface topography; The resolution of the images obtained by infrared camera is low, so it is impossible to see the burden surface morphology clearly; The images captured by the hightemperature industrial endoscope can observe the outline of the burden surface, but cannot reflect the specific details of the coke particles; While SHIE can directly obtain high-definition images of the topography of the burden surface, which contains higher quality data and larger amount of information.Thereby the proposed method can provide intuitive information on the distribution of the burden surface for the onsite workers.
III.THEORY AND STRUCTURE OF THE STARLIGHT HIGH-TEMPERATURE INDUSTRIAL ENDOSCOPE
The SHIE is the basis of the proposed burden surface detection method.With the purpose of obtaining clear and bright burden surface images in the harsh environment of BF, the developed equipment is mainly composed of two functional modules: a starlight optical imaging system with large depth of field and wide field of view and an intelligent self-maintenance protection device with water-air dual cooling system.The endoscope structure is shown in Fig.1(a), and its prototype is shown in Fig.1(b).The following section will introduce the specific principle and structure of each module.
A. Starlight Imaging System With Large Depth of Field and Wide Field of View
For the starlight imaging system, its performance indices are designed according to the relevant data of the BF, and based on the optical principle, the optical path and structure are developed.Then the imaging quality of the designed optical system is evaluated, to ensure that it satisfies the performance indicators.The specific steps are as follows.
1) Analysis of Design Indices of Starlight Imaging System
To ensure the BF airtightness, the installation aperture of the endoscope is limited, so the outer diameter of the starlight imaging system is set to 24 mm through the field test.The field of view 2 ω of the starlight imaging system is set to 103°according to technological conditions, so that the optical system can obtain the image of the whole burden surface and avoid the interference of dust and material flow on the BF top.Moreover, the starlight imaging system requires a large depth of field.The depth of field is calculated by
where ?L1and ?L2are the front and rear depths of field of the starlight imaging system respectively,Fis the aperture value,δis the diameter of the permissible circle of confusion,fis the focal length of the system,Lis the distance between the focal object surface and the system.According to the definition of large depth of field, the focus is set at the hyperfocal distance point, that is, the front depth of field isL/2, and the rear depth of field is ∞, thenf2=FδL.Based on the latest data of high temperature industrial endoscope, the shortest object distance between the burden surface and the industrial endoscope is about 0.77 m, so ?L1=0.77 m, thenLis 1.54 m.To make the imaging results of the starlight optical imaging system clearer, the diameter of the permissible circle of confusion is equal to the pixel sizeIdand the diameter of Airy diskAd, thus
where λ ( = 0.5876 μm) denotes the primary wavelength,Dis the diameter of the entrance pupil of the optical imaging system,Idis the pixel size, and the P2160 CMOS chip of 9.7 μm is used here.Then, substituting (2) into (1) obtains
Through the above analysis, the design indices of the starlight imaging system are listed in Table I.
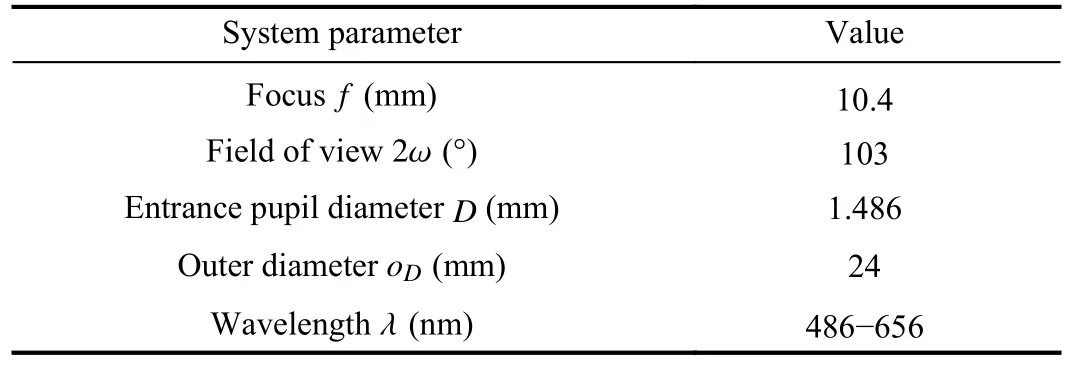
TABLE I DESIGN INDICES OF OPTICAL IMAGING SYSTEM
2) Structure of Starlight Imaging System
With the above design indices, the designed starlight imaging system is composed of an objective lens group, three relay lens groups and a zoom lens group.
a) Structure and principle of the objective lens group
The objective lens group is the imaging element of the starlight imaging system.To satisfy the large field of view and short focal length goals in the design indices, the reverse telephoto objective structure is adopted as shown in Fig.2, which includes six lenses.The first and second lenses form the front lens groupL1, which has the negative power φ1and has capability of large field of view.The third to sixth lenses form the rear lens groupL2, which has the positive power φ2and larger relative aperture, and can realize strong light transmission ability.As illustrated in the optical path structure in Fig.2, the off-axis large-angle α beam enters the front lens group and diverges, and the angle decreases to α′after passing the rear lens group, then the image is formed on the focal plane, which is the Principle of large field imaging.
b)Structure and principle of the relay lens group
To realize long-distance transmitting the acquired image to the back-end image processing unit without damage, the developed system adopts three identical relay lens groups.As displayed in Fig.2, the structure of each lens group adopts two symmetrical Hopkins rod lenses, which is cemented by a thick biconvex lens and two symmetrical negative lenses.The Hopkins rod lens reduces the Spherical aberration, vertical axis aberration and Petzval sum.And its refractive index is greater than that of the air, thus the light energy transfer efficiency is better.
The optical path structure of the relay lens group is shown in Fig.2, the focal length of the front rod lens is the same as the focal lengthf′of the objective lens group, so that the light emitted by the image plane of the objective lens group becomes parallel light after passing through the front rod lens.After the parallel light passes through the rear rod lens, it is focused on the focal plane again, so as to proportionally transmit the image.
c) Structure and principle of the zoom lens group
Since the BF stockline keeps changing in the whole distribution cycle, the distance between the burden surface and the starlight imaging system also changes, so the system utilizes a zoom lens group to realize the automatic focusing during the shooting process and guarantee the real-time clarity of the video.The zoom lens group consists of a front fixed lens, a movable lens, and a rear fixed lens as illustrated in Fig.2.According to Gaussian optics theory, the optical power of an optical system composed of two components is
where φ1, φ2are the optical powers of the two components respectively and cannot be changed.Therefore, the zoom lens group moves the lens through the stepping motor and changes the component intervaldto realize the change of the system’s focal length.
3)Design and Evaluation of Optical System
With the above design indices and structural parameters, the starlight imaging system with large depth of field and wide field of view is designed by using the Zemax software, and iterative optimization is performed.The structure of the system is shown in Fig.3.To evaluate the imaging performance of the optical imaging system, simulation tests were conducted on the system, as depicted in Fig.4.Fig.4(a) illustrates the modulation transfer function (MTF) performance chart of the designed optical imaging system.At the optical system resolutionN=1/(2Nd)=50 lp/mm, the MTF values in both the tangential and sagittal directions across the entire field of view are greater than 0.25, approaching the diffraction limit, thus meeting the imaging quality requirements.Fig.4(b) exhibits the spot diagrams of the optical system at different field of views, with the maximum root mean square radius for each field of view measuring 9.910 μm, which is smaller than the pixel size of 10 μm.This indicates that the optical system effectively controls the aberrations across different field of views.Fig.4(c) displays the field curvature and distortion curves of the optical system.The field curvature in both the tangential and sagittal directions within the entire field of view is less than 0.25 mm, and the maximum distortion is -40% of barrel distortion.In a wide-field optical system, distortion is inevitable, but it does not affect the imaging quality and can be corrected during the image processing stage.Fig.4(d) shows the wave aberration of the optical system, with the maximum wave aberration being less than 0.0418 wavelengths, which is far below 1/4 wavelength.Thus,according to the Rayleigh criterion, the imaging quality of the optical system is close to that of an ideal system.
Compared with other wide-field objective optical systems,as shown in Table II, it can be observed that the designed optical system has a larger field of view and can obtain a wider range of images.And the system pixel size is smaller, the system resolution is higher, and the captured image can reflect more details of objects.The aperture valueFis large, so the system has a large amount of light input, and can image in a dark environment.Besides, the ratio of wave aberration to wavelength is small, thus the imaging quality is relatively high, which can satisfy the clear imaging in starlight illumination environment.
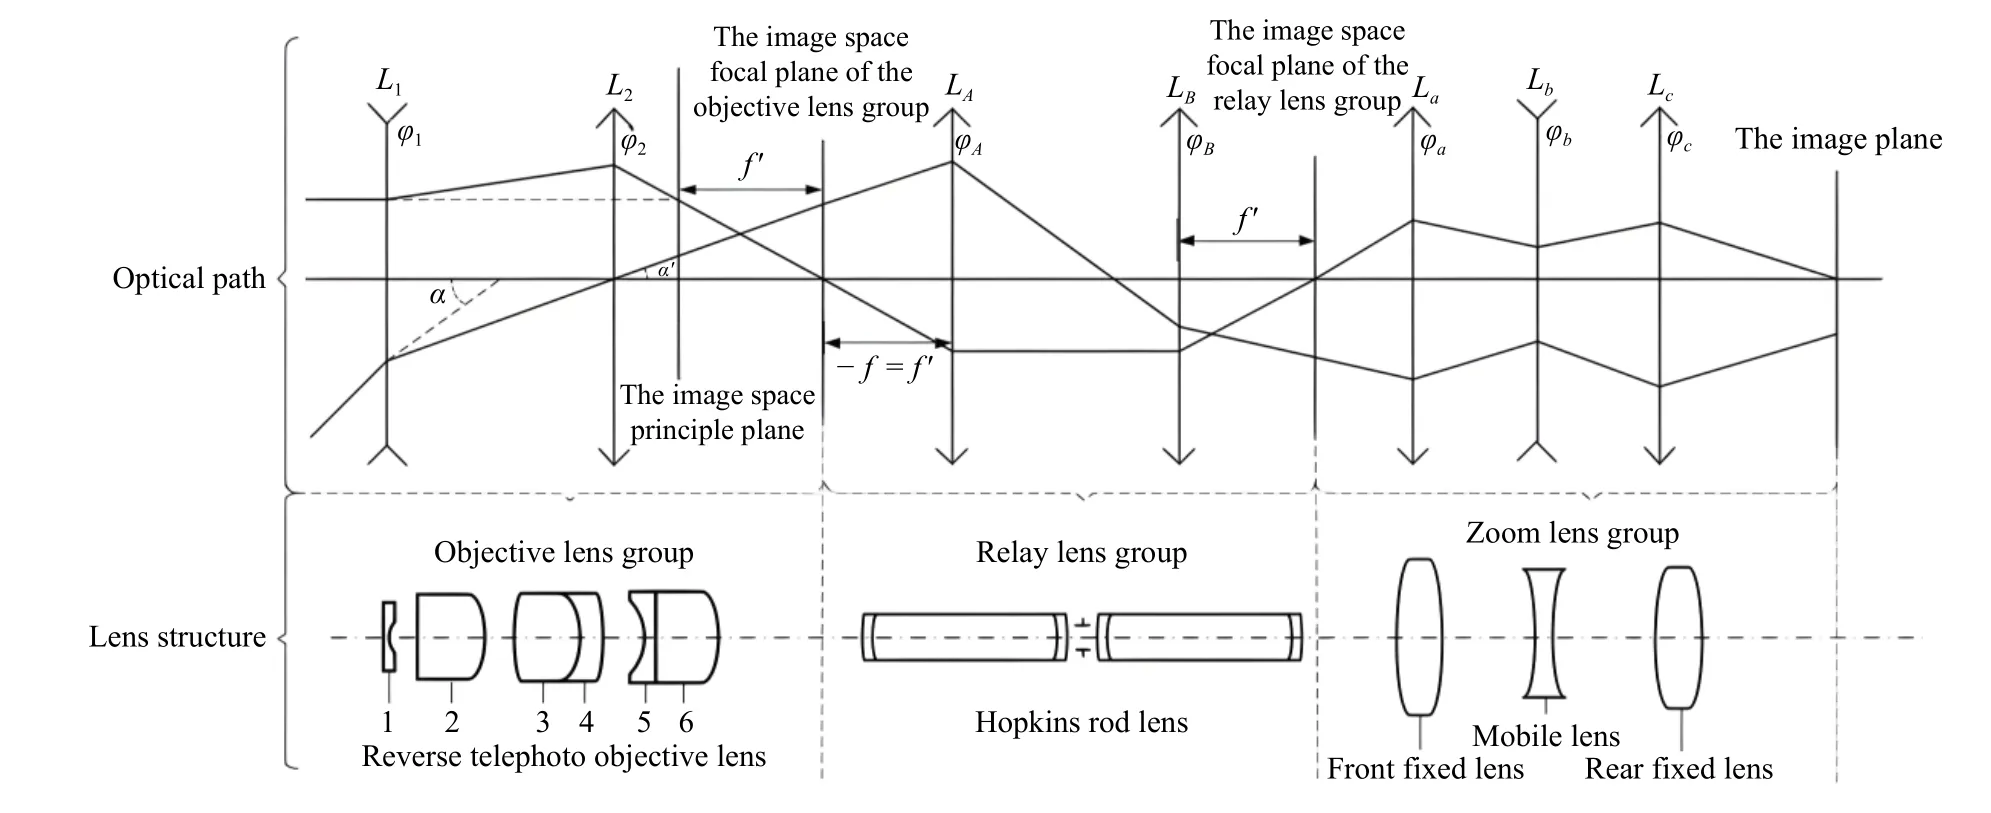
Fig.2.Optical path and lens structure of starlight-level optical imaging system with large depth of field and wide field of view.
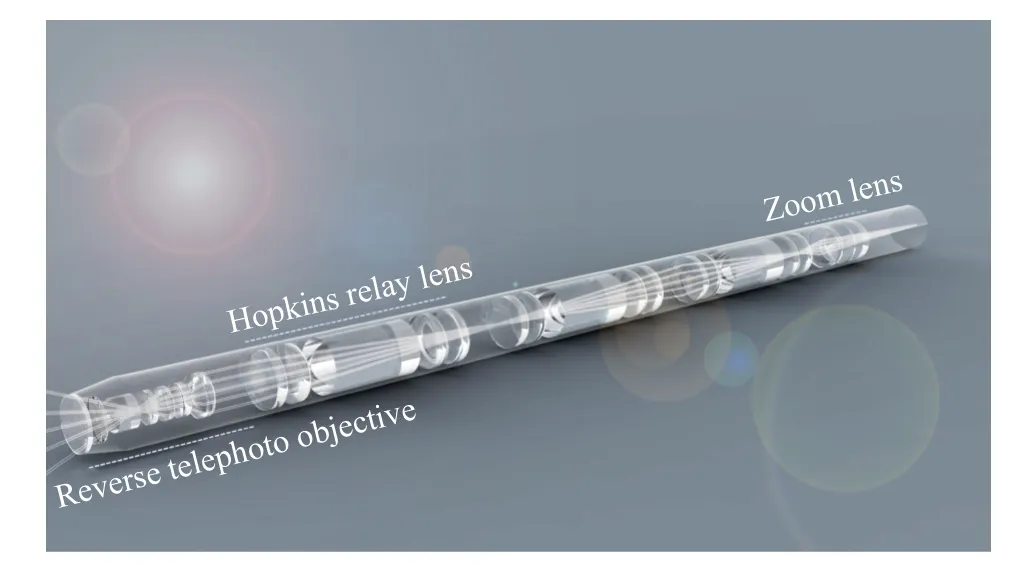
Fig.3.Structure of starlight optical imaging system.
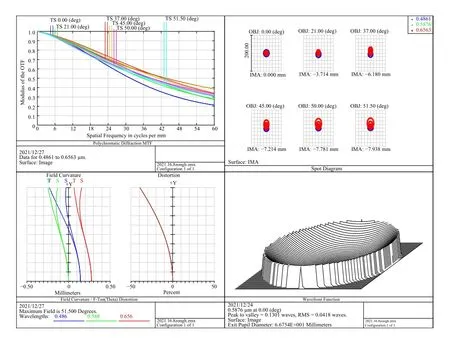
Fig.4.The performance indicators of the starlight optical imaging system.
B. Intelligent Self-Maintenance Protection Device With Waterair Dual Cooling System and the Overall Operation Flow
To ensure long-term stable operation of industrial endoscopes in the harsh environment, the intelligent self-maintenance protection device with water-air dual cooling system is designed, and its structure is shown in Fig.5.The front and rear sleeve shells, the fixed sleeve ring, the water-cooling circuit and the air-cooling circuit constitute the water-air dual cooling protection device.The intelligent self-maintenance device consists of the cleaning nozzles, actuator, shading cover.
The overall workflow of the SHIE is as follows: Firstly, the water-air dual cooling protection device utilizes cooling water and industrial nitrogen to cool the internal components and increase the internal pressure of the equipment, preventing dust in BF top from entering the device.Secondly, the starlight imaging system derives the obtained image of burden surface to the low temperature area at the back end of the equipment, and the charge-coupled device (CCD) chip image digitally with the imaging drive circuit.Finally, the video signal line interface transmits the acquired digital video information.In addition, when the endoscope lens becomes blurry, the intelligent self-maintenance device will control the actuator to rotate the shading cover, opening the light-passing hole, and automatically sprays high-pressure water to clean the dust scab at the front end of the lens, restoring clear imaging and ensuring the long-term stable operation of the equipment.
IV.OPTIMAL CONFIGURATION OF INSTALLATION POSITION AND POSTURE OF THE INDUSTRIAL ENDOSCOPE
The installation posture of the industrial endoscope is essential to be designed.The installation requires to overcome three major challenges: First, the equipment must be installed in the no-material-flow area on the BF top to prevent the material flow particles from causing damage to the endoscope; Second,the equipment should be settled in the low dust area to avoid the interaction between dust and gas flow.Third, the vertical distance between the starlight imaging system and the standard stockline of the BF must ensure that the imaging area of the equipment is large enough and the information of burden surface is complete.
Based on these, experiments were carried out on 2650 m3BF: Firstly, based on the obtained image area model of burden surface, a maximum burden-surface imaging optimiza-tion model of the industrial endoscope is established.Secondly, in order to obtain a safe installation region with few material flow and low dust on the top of the BF, the trajectory model of material flow and the coupling distributionk-Sε-upmodel of dust and gas are established.Finally,based on the field data, the optimal installation position and posture of the SHIE are calculated.
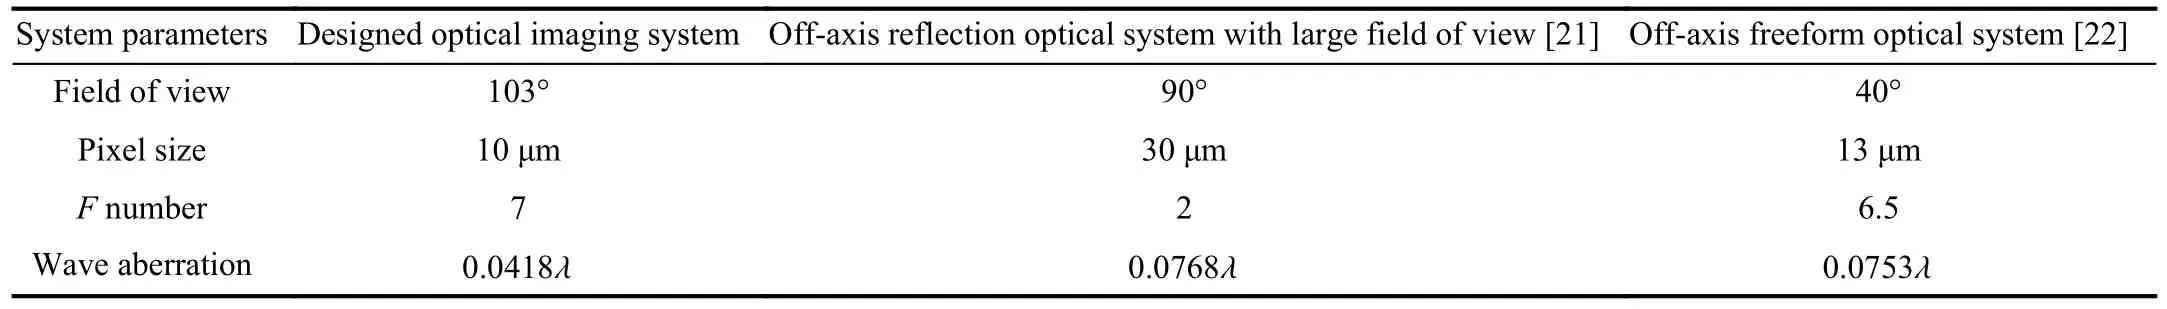
TABLE II COMPARISON OF DESIGN INDICES BETWEEN DIFFERENT OPTICAL SYSTEMS
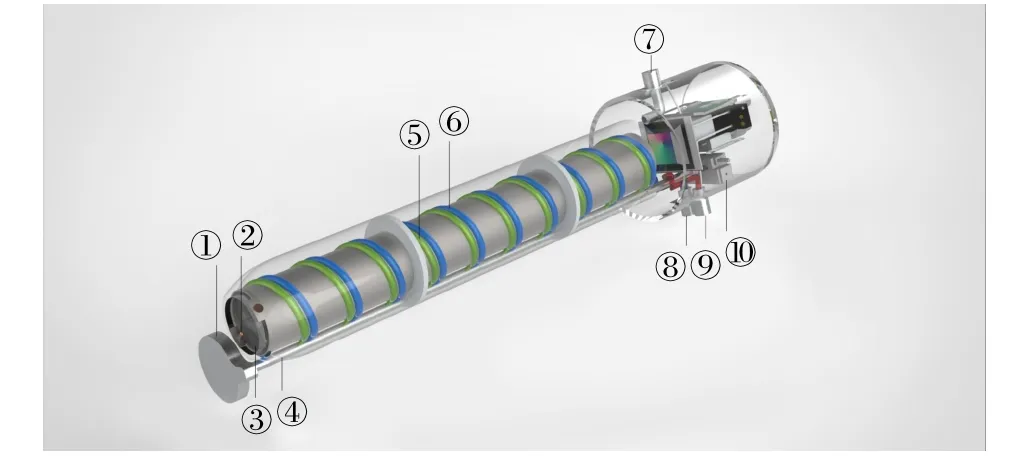
Fig.5.Intelligent self-maintenance protection device.
A. Maximum Burden-Surface Imaging Optimization Model
To obtain the complete detail information of the burden surface, the maximum imaging area model of the SHIE should be constructed.Since the imaging area is determined by the image ellipse of SHIE, it is necessary to calculate the cone equation of the field of view for the endoscope first, and then calculate the device’s imaging ellipse equation to acquire the imaging area model.The model is shown in Fig.6(a).The field-of-view cone equation can be regarded as the generatrixABof the field-of-view coneA-BO′Crotates once around the axis of rotationDA.The height of the burden surfaceqis the distance from the burden level to the standard stockline,and its coordinates are generally between -0.5 m and 0.7 m relative to the standard stockline, that isq∈[-0.5,0.7].Using the parallel latitude circle method, the cone equation of the field of view can be calculated as
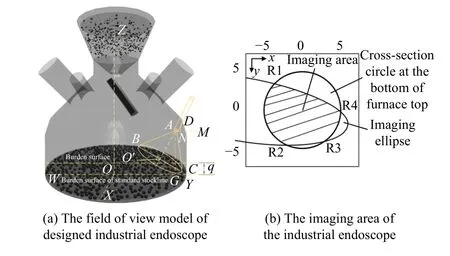
Fig.6.The field of view model of designed industrial endoscope.
where
The imaging area is the middle shadow part of the crosssectional circle formed by the image ellipse and the BF wall on the two-dimensional plane in Fig.6(b).To calculate the imaging area of the endoscope, (6) is rewritten as
To maximize the imaging area of the burden surface in the whole distribution period, according to the height of the burden surfaceq, the integral (7) can be calculated to obtain the imaging area of the endoscope in the entire material distribution cycle, thus the maximum burden-surface imaging optimization model of the industrial endoscope is established as
wherexR1,xR2,xR3andxR4are thex-coordinate of the intersections of the image ellipse and the section circle, respectively;Ris the radius of cross-sectional circle;C1-C10are model parameters; α and 2 ω are the shooting angle ∠WAYand the field of view of the industrial endoscope;dandzAare the horizontal distance and vertical distance respectively between the front probe of the endoscope and the center of burden surface; λ0, λ1, λ2and λ3are constraint parameters which need to be established.
B. Determination of Constraints for the Optimization Model
1)No-Material-Flow Safety Region on the Top of the BF
For the purpose of finding the no-material-flow region, the trajectory model of material flow in BF is established according to Newton’s equation of motion as follows [18]:
In Fig.7(a),ndenotes the distance from the landing point of the material flow to the central line,Lxrepresents the horizontal distance on thexaxis from the landing point to the end of the rotating chute,K1is the velocity of the material, β is the angle between the chute and the horizontal direction,l0,lβ,ω0,eand μ describe the length, the effective working length,rotating speed, chute tilted holding, and coefficient of the sliding friction of the chute, respectively,gis gravity acceleration,andhis the distance from the bottom end of the chute to the top end of the stock heap.
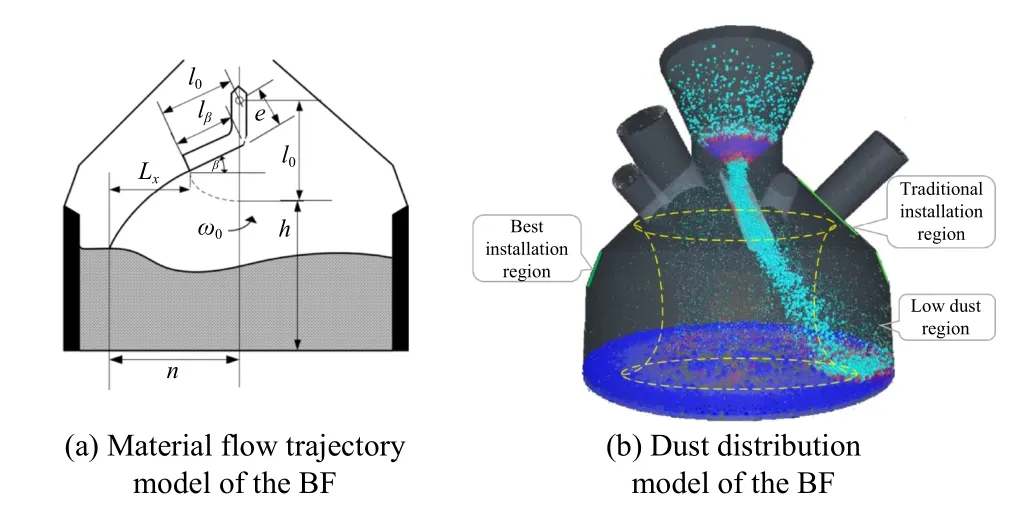
Fig.7.Material flow trajectory and low dust area on the top of the BF.
Based on this model and the relevant parameters of BF distribution, the theoretical calculation value of the distance between the drop point of the material flow on the 1.5 m standard stockline and BF wall is 0.54 m.Thus, the distance between the front-end probe of the industrial endoscope and BF wall should not exceed 0.54 m to keep a certain safety margin.
2)Low Dust Installation Region on the Top of the BF
To determine the low dust installation region, the turbulent flow mixed with gas flowk-Sε model and the dust particle motionupmodel on the BF top are established based on the engineering model theory and Newton’s theorem of motion[23].And based on the interaction between phases, the coupled distributionk-Sε-upmodel is established as (9).
There are four independent equations in the model, whereKˉ , εˉ are used to describe the motion of the gas flow field,τpdescribes the interaction between phases,upidenotes the motion of dust particles.Andui,ujare the speeds of air in different directions.μ, ρ,Kˉ and εˉ are dynamic viscosity parameters, density, turbulent kinetic energy and turbulent dissipation rate of gas flow respectively.Prepresents pressure on top of BF,fand τpare the resistance correction coefficient and relaxation time of the dust particles respectively.spi,av,upianduiare the displacement, acceleration, velocity of dust particle, velocity of the gas flow, respectively.Cε1,Cε2,Cε3,Cεε,Cεk,CT,CDare the key model constants parameters to be determined, which can be obtained by relevant engineering manuals.
According to the model, the installation position of the industrial endoscope can be determined as the center of the interface between the cylindrical surface and the conical surface of BF roof as shown in Fig.7(b).Compared with the installation position of the traditional equipment, the structure of this installation position is simple, with only one layer of furnace shell, which is easy to open holes, and does not affect the safety of BF operation.And the installation position is far from the top gas flow riser pipe.Therefore, the proposed installation is more reasonable.
3)Determination of Optimal Configuration Constraints
Based on the field data, the radius of the section circleRis 4.15 m, the coordinate of installation pointDis(0, 4.64, 2.46)and that ofAis (xA,yA,zA).According to the material flow trajectory model, the distance betweenAand BF wall is less than 0.54 m.To prevent particle flow from impacting the endoscope, the distancedbetween the front end of the endoscope and the BF should be greater than 3.68 m and less thanR,therefore, 3.68 ≤d≤4.15.As shown in Fig.6(a), due to the angle ∠DNMbetween the line formed by pointDand the edge pointNof BF wall and the horizontal line is 60°, the projectionof∠DNMontheyOzp√lane cannot be bigger than 60°,then
Based on above analysis, the model parameters and the constraints parameters are listed in Appendix B.
C. Solution of the Maximum Imaging Optimization Model
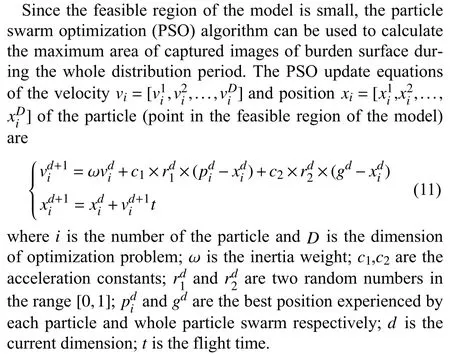
The calculation results of the PSO algorithm, the simulated annealing algorithm and the genetic algorithm are shown in Table III.It can be seen that the global optimal value calculated by the PSO algorithm is larger, the number of iterations is less, and the calculation time is shortest, indicating that the efficiency of PSO algorithm is higher, and it has a strong global search ability, which is easier to escape from the local optimum.Therefore, the PSO algorithm is more suitable for solving the proposed optimization model.
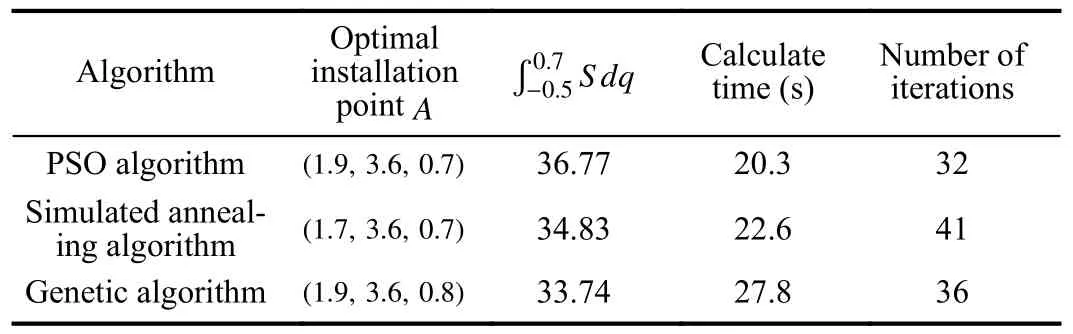
TABLE III CALCULATION RESULTS OF PSO AND OTHER OPTIMIzATION ALGORITHMS
From the table, the coordinate of pointAthat maximizes the imaging area of the burden surface is (1.9,3.6,0.7), that of pointBis (2.45,2.72,0.84).Thus, the projection angle β on thexOzplaneofαis 42.8?,and theprojectionangleγontheyOzplaneis59.4?,maxS dq=36.77.Finally, theequipment installation method for safe and close-range imaging of BF burden surface is shown in Fig.8(a).
V.RESULTS AND DISCUSSION
A. Application of the Designed Industrial Endoscope
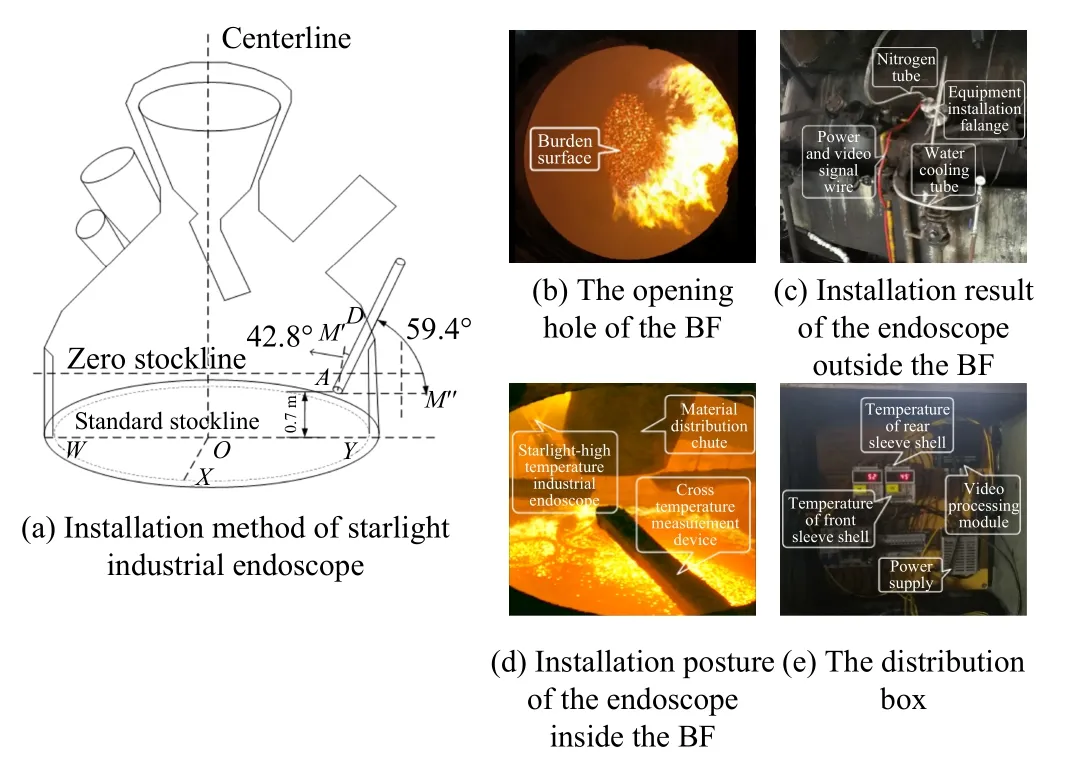
Fig.8.Installation method and results of starlight industrial endoscope.
This section introduces the actual installation structure and operation of SHIE on 2650 m3BF.Fig.8(b) shows the opening hole of the BF.The diameter of the hole is 110 mm, and the shape of the burden surface inside can be clearly seen through it.Fig.8(c) shows the rear sleeve shell of the device outside, which is installed on the fixed flange and weld at the opening hole, to guarantee the airtightness of the BF.And the back end of rear sleeve shell is connected to the water-cooling circuit, the industrial nitrogen pipe, the power and video signal lines.Fig.8(d) indicates that the industrial endoscope is installed under the cross-temperature measurement device with proper installation posture.Fig.8(e) displays the distribution box of the equipment, which contains the power supply,video signal module and temperature measurement module,where the temperature measurement module shows the realtime temperature in the front and rear sleeves of the device.
The images captured by the developed endoscope during the entire BF operation are shown in Fig.9.The device can not only capture the burden surface images during normal operation, but also can reveal new abnormal BF conditions, which could not be obtained by the existing equipment.For example,Figs.9(a)-9(c) indicate the slow sinking and sudden drop of the burden surface.From Figs.9(a) and 9(b), the burden surface only decreases a little in two minutes, while from Figs.9(b) and 9(c), the burden surface drops rapidly within five seconds, and the abnormal furnace condition of collapsing burden appears.Figs.9(d)-9(f) show the abnormal furnace condition of splashing burden, the splashing burden is the bright spot falling on the edge area.Due to the splashing burden, more dust is generated, reducing the resolution of the images.Figs.9(g)-9(i) show the images when splashing water on the BF top, where the water mist and dust are shrouded over the BF top, but the shape of the water column and the burden surface can still be observed.After splashing water,the highlight of the image becomes dark, that is, the flame of the splashed burden gradually goes out.
B. Qualitative Analysis of the Imaging Performance of the Starlight High-Temperature Industrial Endoscope
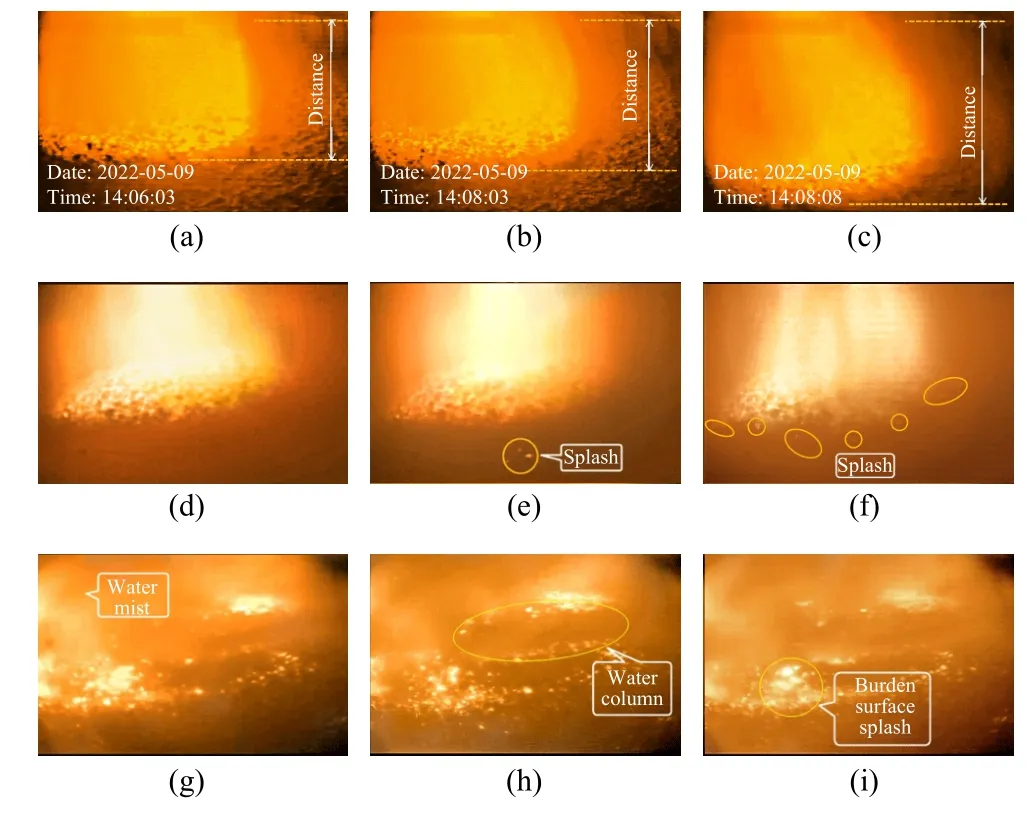
Fig.9.The obtained image by the starlight industrial endoscope.
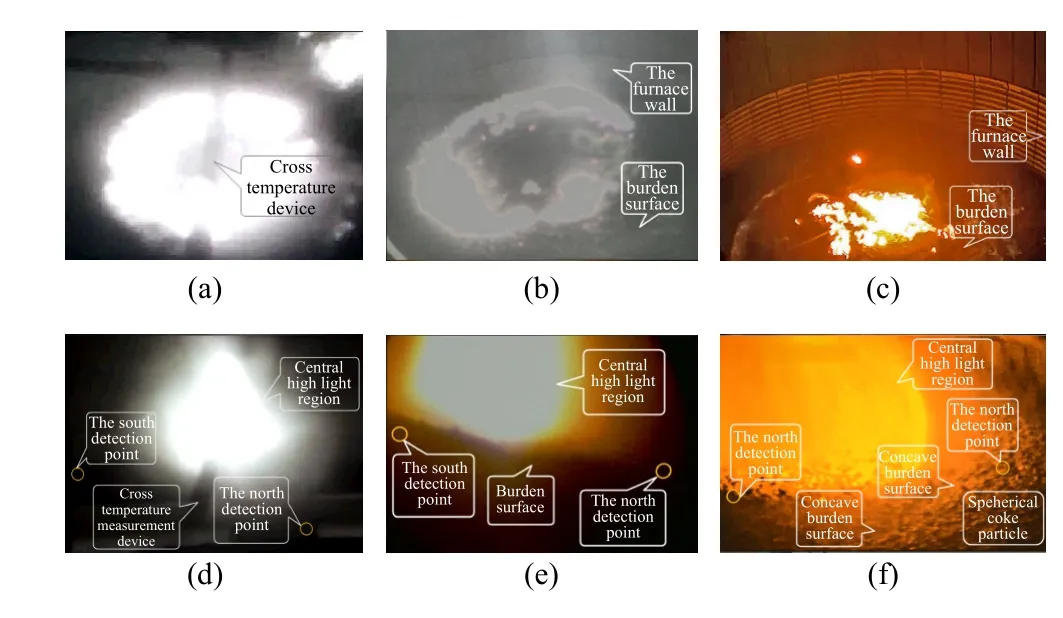
Fig.10.Burden surface images obtained by different devices.
To further verify the imaging performance of the designed device, the captured images by the device with the high-temperature industrial endoscope and the infrared camera are compared.Figs.10(a)-10(c) are pictures when starting BF by these devices, Figs.10(d) and 10(e) show the images of obtained burden surface during the idle period.To be specific,Figs.10(a) and 10(d) are images taken by the infrared camera,in which the burden surface can hardly be seen, and only the shape of central highlight area and cross-temperature measurement device can be seen blurred.Figs.10(b) and 10(e) are images from the high-temperature industrial endoscope, where the approximate shape of burden surface and furnace wall can be observed, but the image brightness is low.While the images obtained by the developed device are distinct and bright.The shape of the coke particles and the outline of the burden surface from concave to convex are clear.Based on the data measured by the south and north detection points, the inclination angle and inclination direction of the burden surface can be determined, the device can thus provide intuitive and reliable information of the burden surface.
C. Quantitative Analysis of the Imaging Performance of the Starlight High-Temperature Industrial Endoscope
The accuracy, reliability and image quality of the acquired images are evaluated to quantitatively analyze the performance of the developed equipment.The correct evaluation must be based on a large number of images.Thus, the dataset used in this study consists of 97 730 burden surface images collected from the developed BF burden surface detection system as shown in Fig.11.It includes 19 546 original burden surface images captured by different devices installed on the BF top, namely SHIE, the high-temperature industrial endoscope, the mechanical swinging radar, the laser scanner and the infrared camera.Based on the dataset, the image accuracy,the recognition rate for abnormal furnace conditions and the image quality of different equipment are quantitatively compared from the following aspects.
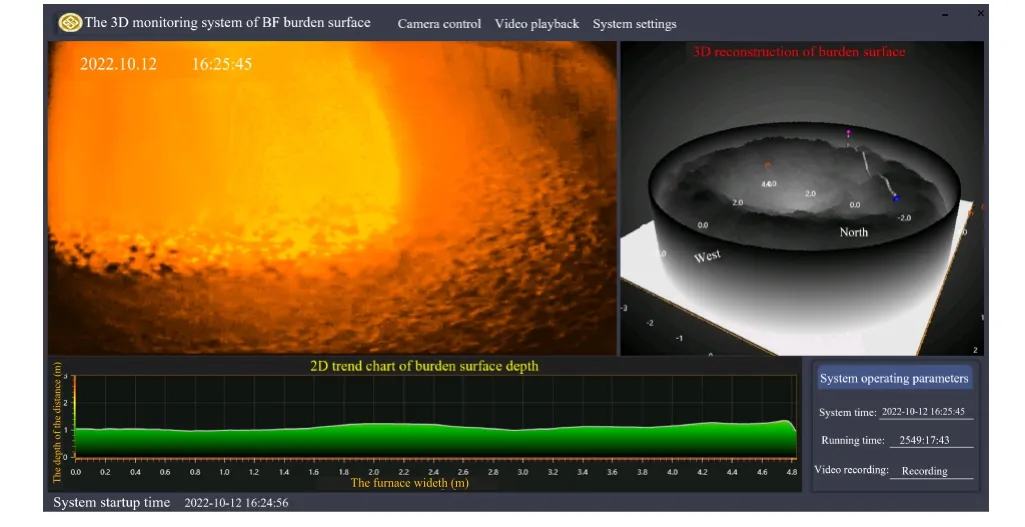
Fig.11.3D monitoring system of BF burden surface.
1)Comparison Results of the Accuracy and Reliability of the Images
Generally, in industrial production sites, the ideal empirical curve of the burden surface is usually used as the gold standard for judging the material distribution of the burden surface.Considering the current smelting situation, workers always plot an ideal experience curve based on their own experiences and the measured data of the mechanical probe.Therefore, to compare the similarity between the burden surface images collected by the above detection equipment and the gold standard, and judge the accuracy of the images, we use Canny edge extraction operator to extract the burden surface curves in the images collected by the SHIE, infrared camera, laser scanner and mechanical swing radar, and set them in the same coordinate system, as shown in Fig.12.
As shown in Fig.12(a), the burden surface heights measured by the north and south mechanical probes are 1.22 m and 1.55 m, respectively, and the ideal experience curve drawn by workers is a typical M-shaped burden surface.It can be seen that the detection points of the two mechanical probes are located on the burden surface contour curve of SHIE, and the contour curve is in good agreement with the ideal empirical curve, especially in the high light area in the BF center, the concave trend of burden surface shape is obvious.The contour curve of burden surface detected by the laser scanner is consistent with the ideal curve shape, but it does not include the detection point of southern mechanical probe, and there is a certain error.The burden surface contour curve detected by the mechanical swing radar includes the detection point of the north mechanical probe but does not include the detection point of the south mechanical probe, and the curve exhibits a significant deviation from the ideal empirical curve as it protrudes at the high light position in the center of the blast furnace.The burden surface contour curve of the infrared camera is a closed curve, which does not include the detection points of the north-south mechanical probe, which is completely different from the ideal empirical curve.Therefore,when detecting the normal burden level of BF, the burden surface image captured by SHIE is more accurate, the burden surface profile detected by the laser scanner has a certain error, and the burden surface profile obtained by the mechanical swing radar has a large error, while the infrared camera cannot obtain the correct burden surface profile.

Fig.12.The burden surface contour curves under normal and inclined burden condition.
When the inclined burden condition occurs as shown in Fig.12(b), the measured heights of the burden surface by the north and south mechanical probes are 0.45 m and 1.75 m,respectively.Both the north and south mechanical probe points locate on the contour curve of the burden surface captured by the SHIE, which closely aligns with the trend of the ideal empirical curve and exhibits a significant depression at the center.The contour curve of the burden surface detected by the laser scanner exhibits a resemblance to the ideal empirical curve in terms of overall shape but does not include the measurement points from the north and south mechanical probes, resulting in noticeable errors.The contour curve obtained from the mechanical swing radar does not include the measurement points from the north and south mechanical probes and exhibits an opposite trend compared to the ideal empirical curve.The curve obtained from the infrared camera approximates a circle-shape, deviating greatly from the ideal empirical curve.Therefore, in the presence of abnormal furnace conditions such as inclined burden, the detection accuracy of the SHIE remains high, while the laser scanner experiences significant declines in accuracy.The mechanical swing radar and the infrared camera are unable to accurately identify abnormal furnace conditions.
The above analysis compares the accuracy of the burden surface image at a specific time.The correctness evaluation must also be based on a large set of images.Therefore,according to the golden standard, the correctness of 97 730 images captured by the system was evaluated.For the 19 546 burden surface images collected by the SHIE, 17 277 are correct and 2269 are wrong.For the 19 546 burden surface images acquired by the high temperature industrial endoscope,16 648 are correct and 2898 are wrong.For the 19 546 burden surface images acquired by the mechanical swing radar,15 000 are correct and 4546 are wrong.For the 19 546 burden surface images acquired by the laser scanner, 13 996 are correct and 5550 are wrong.For the 19 546 burden surface images acquired by the infrared camera, 317 are correct and 19 299 are wrong.All these images are checked by workers and manually sorted into five classes.Class 1 to Class 5 represent absolutely correct images, probably correct images, indeterminate images, probably wrong images, and absolutely wrong images, respectively.The classification results are shown in Table IV.
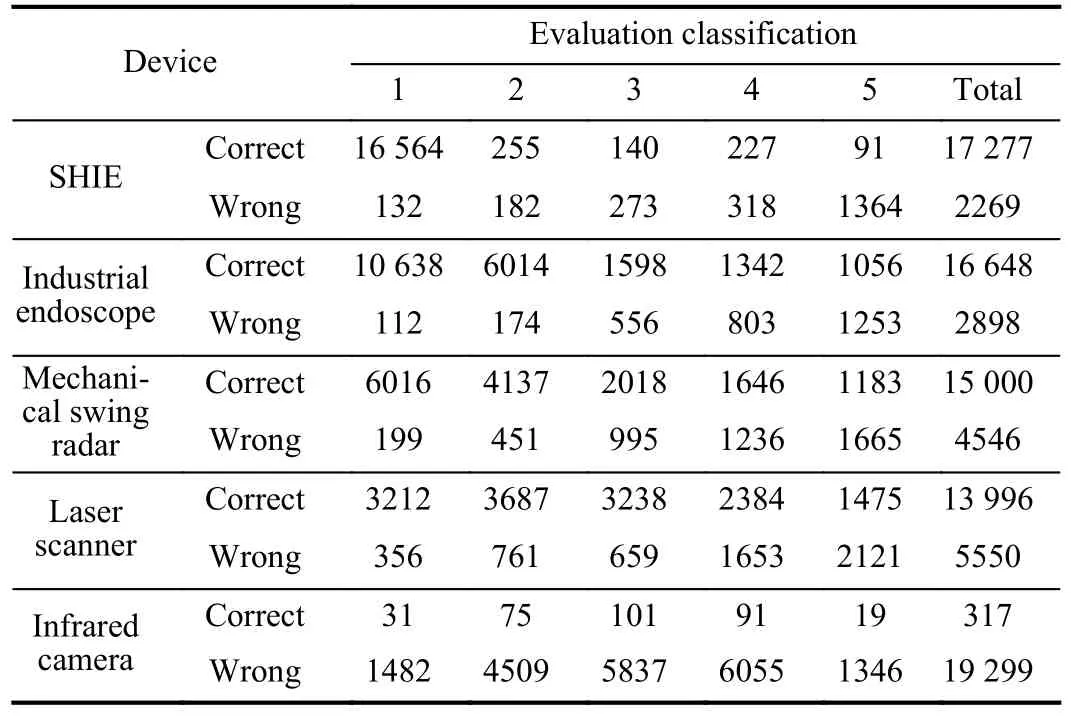
TABLE IV EVALUATION RESULTS OF 19 546 IMAGES
According to Table IV, the ROC (receiver operating characteristic) curves are drawn in Fig.13.From Fig.13, the best working point of SHIE is the first point, while that of the high-temperature industrial endoscope and mechanical swing radar is the second point, and the best working point of the laser scanner and infrared camera is the third point.That is, in practical industrial application, according to the gold standard judgment, the infrared camera, laser scanner, mechanical swing radar and high-temperature industrial endoscope capture the definite correct burden surface images corresponding to the worker’s subjective recognition of uncertain images,uncertain images, possible correct images and possible correct images, respectively, which makes the collected images have uncertainty and affects the reliability of the device.As for the SHIE, the determined image is very consistent with the absolutely correct image, which means that the reliability of the equipment is greatly improved.On the other hand, the ROC curve of SHIE is closer to the upper left corner of the coordinate system than the ROC curves of the infrared camera, laser scanner, mechanical swing radar, and high-temperature industrial endoscope, which reflects that the image of BF burden surface obtained by SHIE has higher correctness.
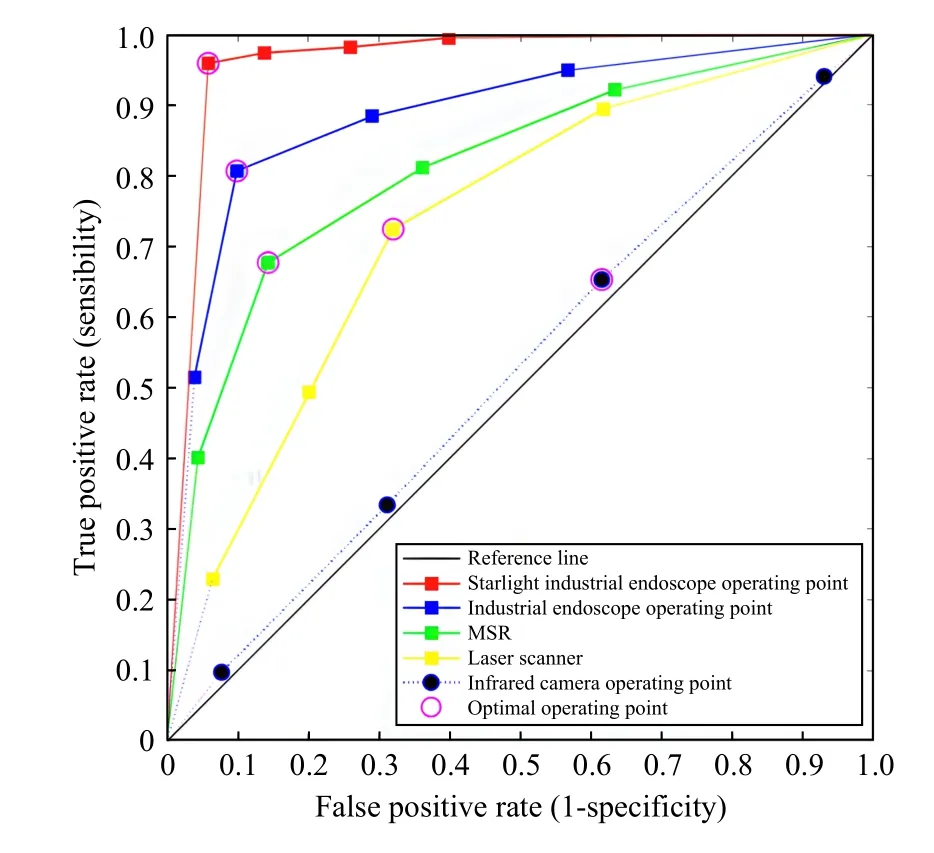
Fig.13.The ROC curves of different devices.
The AUC (area under curve), S.E.(standard error of area)and C.I.(confidence interval) at a 95% confidence level are calculated by ROC curve in Table V, to further verify the performance of SHIE.For AUC, the closer the value of AUC to 1, the higher the precision of the device.For the S.E.and C.I.indicator at the 95% level confidence, the smaller the S.E.value or the narrower the confidence interval, the higher the reliability of the device.In Table V, all indicators of SHIE are superior to the other devices, denoting that the burden surface image captured by the developed equipment has higher accuracy and reliability.Additionally, according to industry standards, images with AUC in the range of 0.95-0.99, 0.90-0.95,0.85-0.90, 0.80-0.95 and below 0.80 are defined as “completely credible images”, “credible images”, “basically credible images”, “uncertain images” and “untrustworthy images”,respectively.Therefore, the evaluations of images obtained by SHIE, the high-temperature industrial endoscope, the mechanical swing radar, the laser scanner and the infrared camera are completely credible, credible, basically credible, uncertain and untrustworthy, respectively.
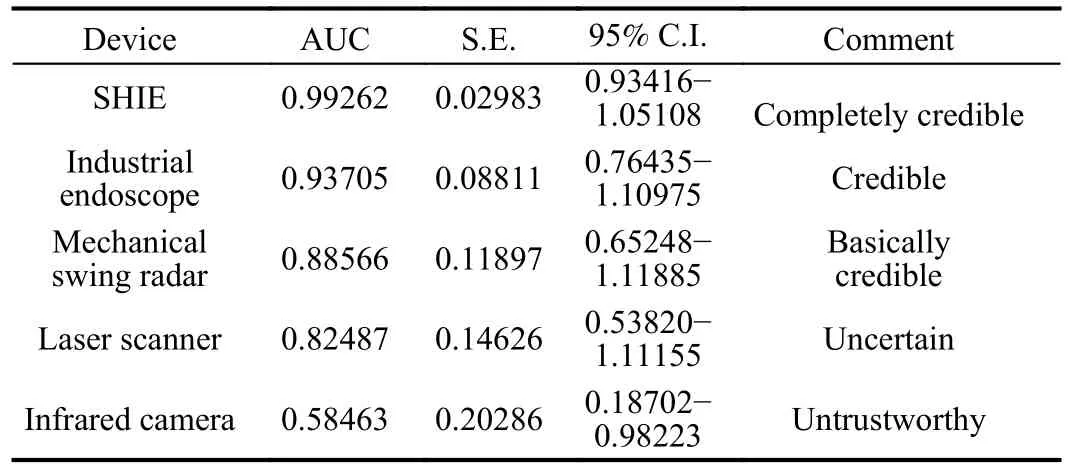
TABLE V INDICATORS OF ROC CURVES
2)Recognition Rate of Abnormal Furnace Conditions by Different Detection Equipment
The abnormal furnace conditions of BF refer to the abnormal physical and chemical phenomena that occur during the production process, such as hanging burden, collapsing burden, partial burden surface, low stockline, etc.These abnormal furnace conditions not only affect the stability, production, quality, and energy consumption of the BF but also bring a high risk of safety accidents.Therefore, it is important to correctly judge the abnormal furnace conditions, so that the onsite workers can control the BF reasonably in time and ensure the smooth operation.Based on the image dataset, the recognition rates of the current burden surface detection equipment under abnormal furnace conditions were calculated and are illustrated in Fig.14.
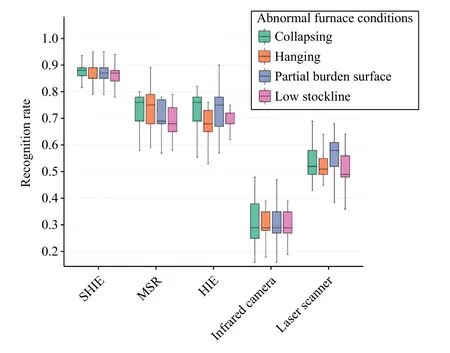
Fig.14.The box plot of recognition rates of different equipment for abnormal furnace conditions.
Fig.14 shows the box plot of the recognition rates of SHIE,mechanical swinging radar, high-temperature industrial endoscope, infrared camera, and laser scanner under abnormal furnace conditions at the BF top.The line within the box represents the median of the data, and the box contains 50% of the data, reflecting the fluctuation of the data.The upper and lower edges of the box represent the maximum and minimum values of the data set, respectively.As shown in Fig.14, the recognition rates of SHIE under four abnormal furnace conditions are generally between 0.8 and 0.95, much higher than the other devices.The box height of SHIE is relatively low,concentrated around 0.9, and the lengths of the upper and lower edges are similar, indicating its relatively stable overall recognition rate.Therefore, compared to the other existing burden surface detection equipment, SHIE exhibits a high recognition rate and good stability for abnormal furnace conditions.It can accurately identify abnormal furnace conditions most of the time and even detect abnormal phenomena that other devices may ignore, greatly contributing to the safe and stable operation and the improvement of smelting quality of BF.
3)Comparison Results of the Image Quality
To evaluate the quality of images captured by the three different devices, the image entropy, sum of image power spectral components, gray mean gradient, edge intensity, point sharpness and NIQE (the natural image quality evaluator) are calculated in Table VI [24].The standard image database is from the image quality evaluation database.Compared with the other detection equipment, the value of the image entropy and the sum of image power spectral components of SHIE are closer to the standard value, that means the images captured by developed industrial endoscope have more information than those captured by others.Also, the gray mean gradient,edge intensity and point sharpness of developed equipment aremuch larger than those of the infrared camera and high-temperature industrial endoscope, but slightly smaller than the standard values, which indicates that the image clarity of the developed device has been significantly improved compared with existing equipment.The NIQE indicator of SHIE is smaller than that of the other devices, slightly larger than the standard value, indicating that its image has better perceptual quality objectively.In summary, the burden surface images captured by SHIE have high clarity, rich information content,and good perceptual quality, which is far superior to the images obtained by the other inspection devices, but there is still room for improvement.
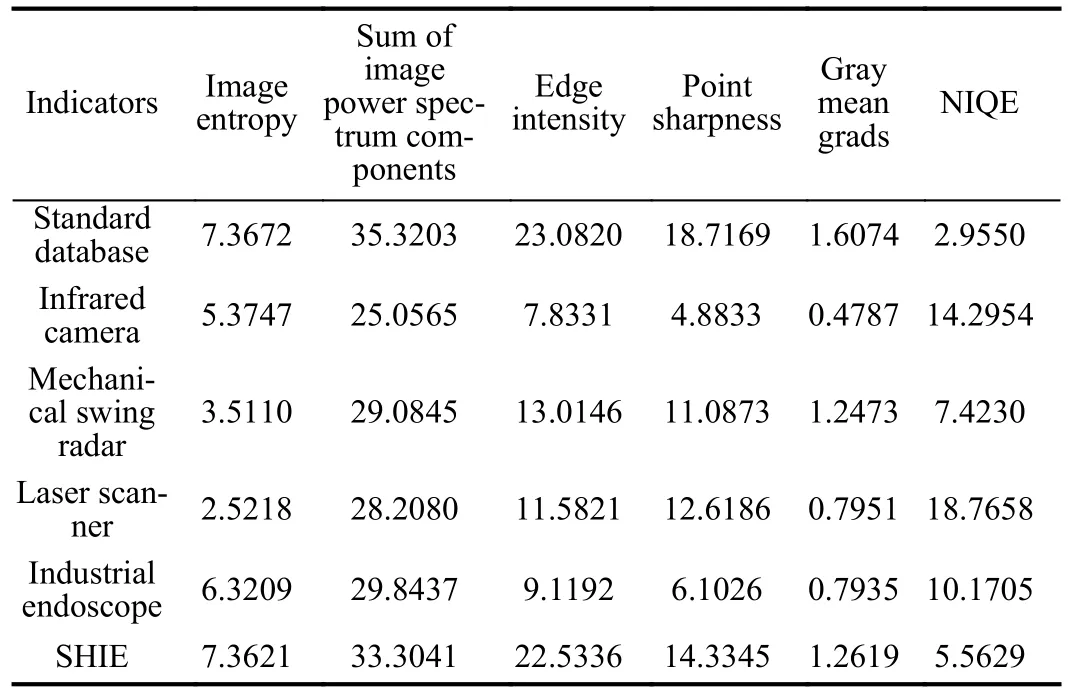
TABLE VI COMPARISONS OF THE IMAGE QUALITY ASSESSMENT INDICATORS
VI.CONCLUSIONS
In this paper, a BF burden surface detection method based on the SHIE is proposed.The designed starlight imaging system of the method can acquire high-brightness, high-resolution burden surface images under extremely dim light and run steadily in the high-temperature and high-pressure environment of BF.On this basis, this paper discovers the optimum configuration of the installation position of the industrial endoscope, which ensures the equipment to obtain the maximum burden surface image and prevents the damage of highspeed material flow and high-concentration dust.The developed industrial endoscope has been installed on the top of a 2650m3BF and runs stably.Compared with the burden surface images obtained by the other detection equipment, it is verified that the images captured by the designed equipment are more reliable, where the contours and details of the burden surface can be clearly observed.The developed optical sensing imaging device provides a novel and beneficial method for detecting the burden surface of BF.
APPENDIX A
The comparison of data indicators of different burden surface detection methods is listed in Table VII.
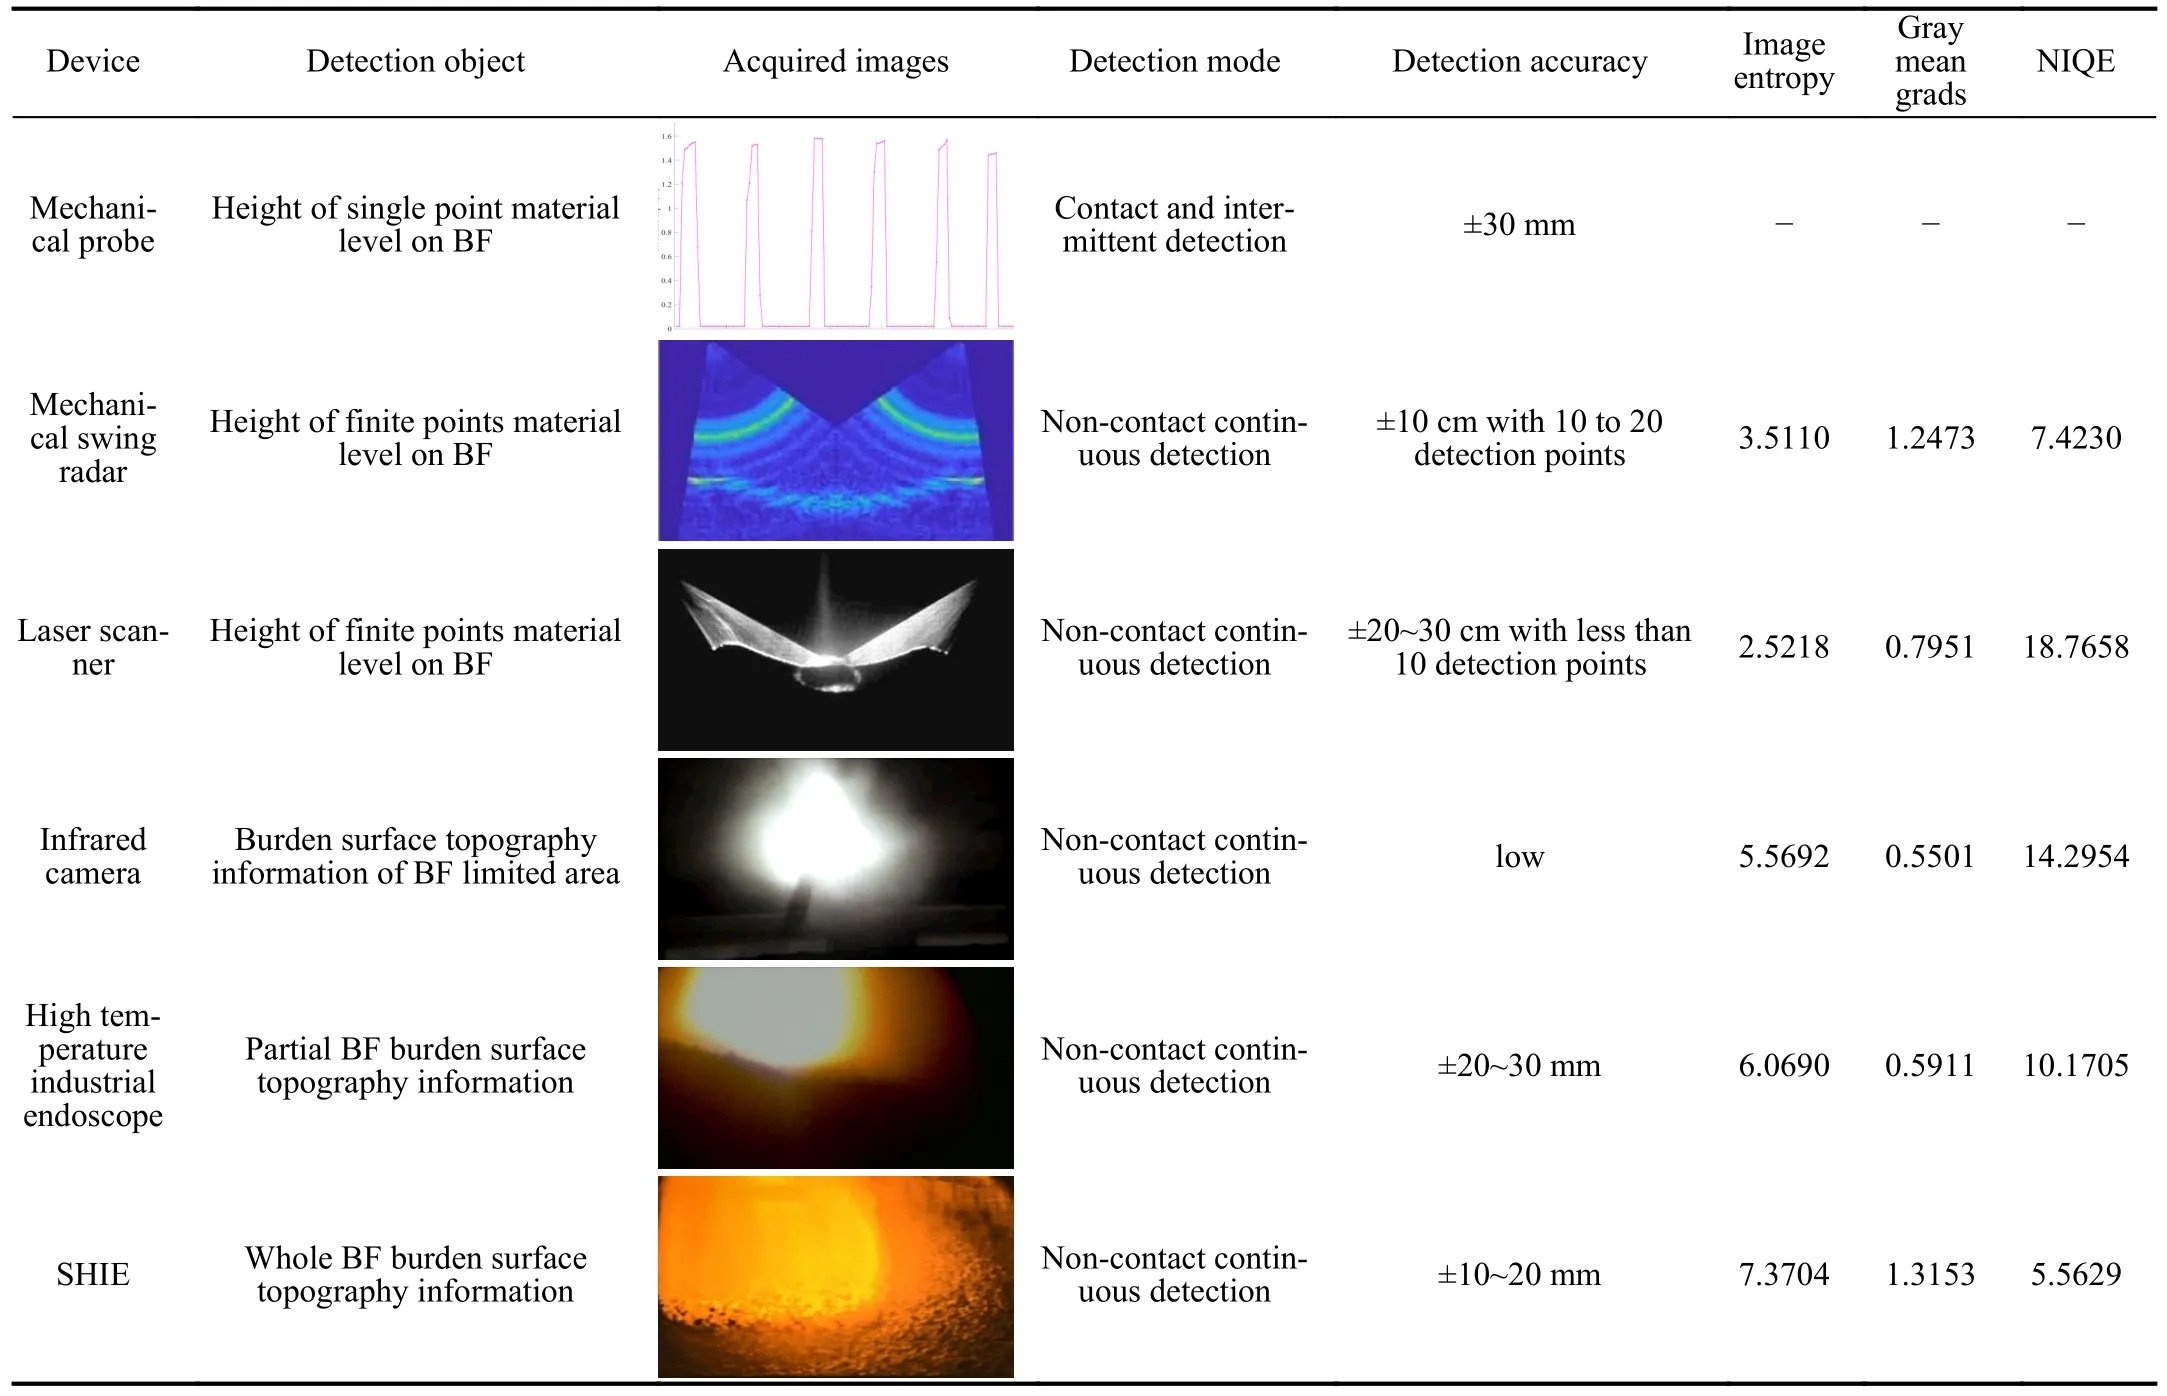
TABLE VII COMPARISON OF DATA INDICATORS OF THE BURDEN SURFACE DETECTION METHODS
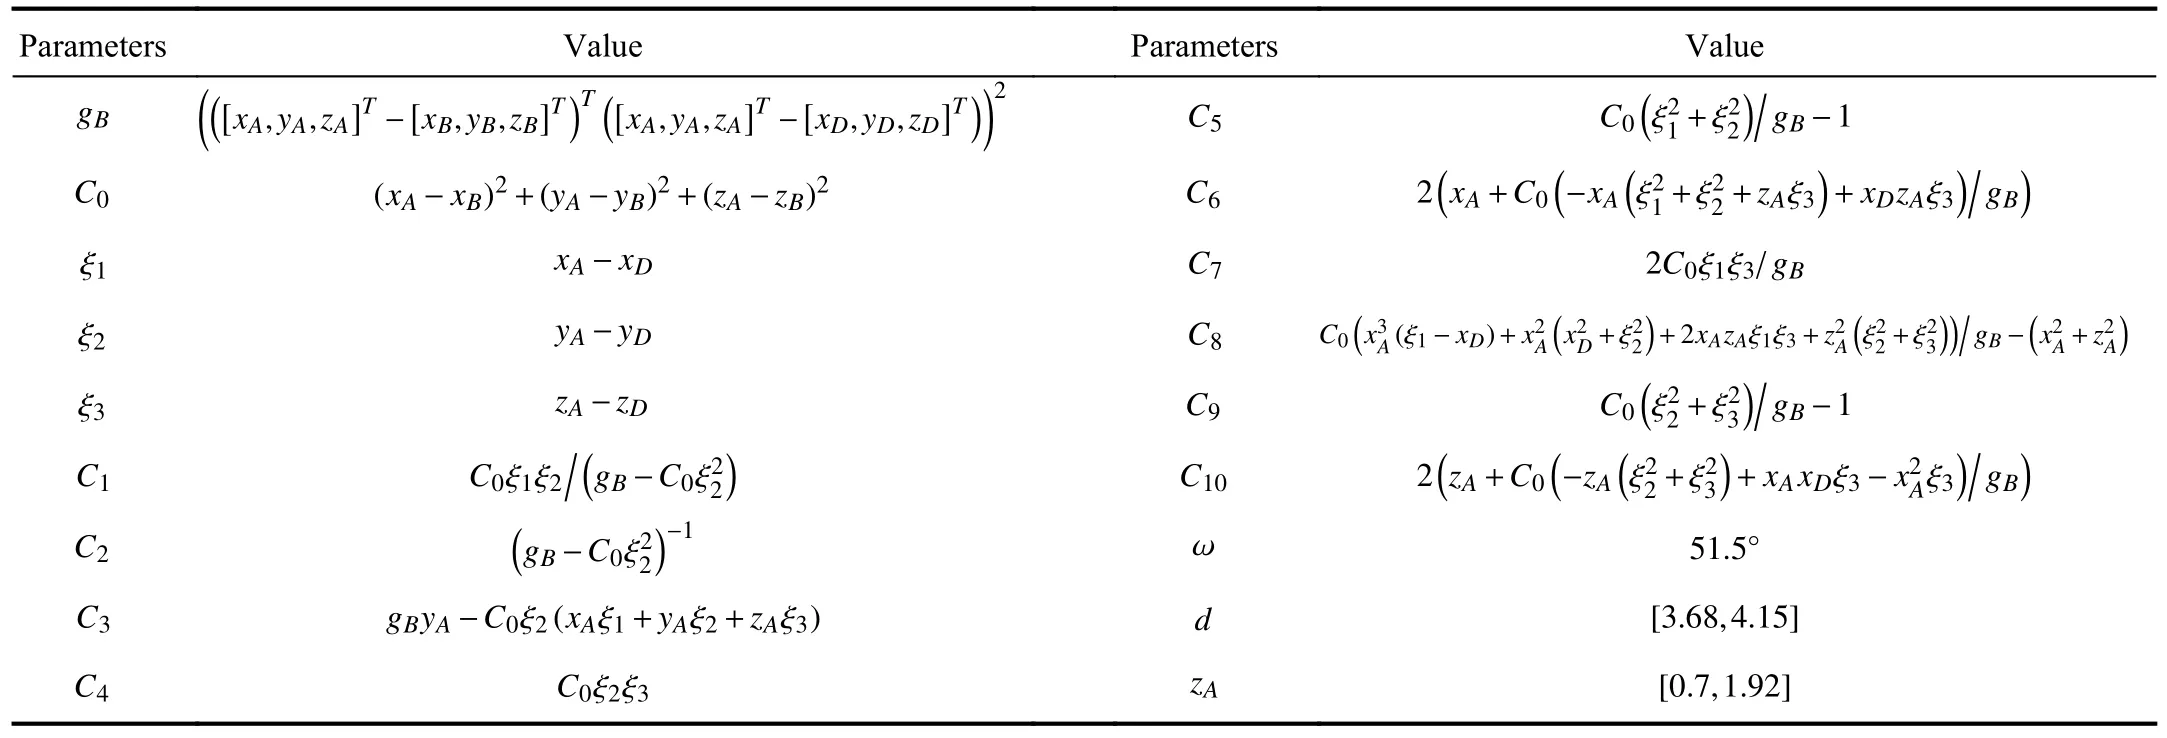
TABLE VIII OPTIMIzATION MODEL PARAMETERS
APPENDIX B
The important parameters and constants in the optimal model are arranged in Table VIII.
 IEEE/CAA Journal of Automatica Sinica2024年4期
- IEEE/CAA Journal of Automatica Sinica的其它文章
- Parameter-Free Shifted Laplacian Reconstruction for Multiple Kernel Clustering
- A Novel Trajectory Tracking Control of AGV Based on Udwadia-Kalaba Approach
- Attack-Resilient Distributed Cooperative Control of Virtually Coupled High-Speed Trains via Topology Reconfiguration
- Synchronization of Drive-Response Networks With Delays on Time Scales
- Policy Gradient Adaptive Dynamic Programming for Model-Free Multi-Objective Optimal Control
- Lyapunov Conditions for Finite-Time Input-to-State Stability of Impulsive Switched Systems