
Shaking table tests on a cantilever retaining wall with reinforced and unreinforced backfill
2022-11-30 09:51:26MingWEIQiangLUOGuishuaiFENGTengfeiWANGLiangweiJIANG
Ming WEI ,Qiang LUO,2 ,Gui-shuai FENG ,Teng-fei WANG,2? ,Liang-wei JIANG,2
1School of Civil Engineering,Southwest Jiaotong University,Chengdu 610031,China
2MOE Key Laboratory of High-Speed Railway Engineering,Chengdu 610031,China
Abstract: Physical modelling of cantilever retaining walls with and without backfill reinforcement was conducted on a 1g shaking table to evaluate the mitigation effect of reinforcement on system dynamics(g denotes the acceleration of gravity).The model wall has a height of 1.5 m with a scale ratio of 1/4 and retains dry sand throughout.The input motions are amplified to three levels of input peak base acceleration,0.11g,0.24g,and 0.39g,corresponding to minor,moderate,and major earthquakes,respectively.Investigation of the seismic response of the retaining walls focuses on acceleration and lateral displacement of the wall and backfill,dynamic earth pressures,and tensile load in the reinforcements (modeled by phosphor-bronze strips welded into a mesh).The inclusion of reinforcement has been observed to improve the integrity of the wall-soil system,mitigate vibration-related damage,and reduce the fundamental frequency of a reinforced system.Propagation of acceleration from the base to the upper portion is accompanied by time delay and nonlinear amplification.A reinforced system with a lower acceleration amplification factor than the unreinforced one indicates that reinforcement can reduce the amplification effect of input motion.Under minor and moderate earthquake loadings,reinforcement allows the inertia force and seismic earth pressure to be asynchronous and decreases the seismic earth pressure when inertia forces peak.During major earthquake loading,the wall is displaced horizontally less than the backfill,with soil pushing the wall substantially;the effect of backfill reinforcement has not been fully mobilized.The dynamic earth pressure is large at the top and diminishes toward the bottom.
Key words: Cantilever retaining wall;Backfill reinforcement;Seismic response;Shaking table test;Dynamic earth pressure;Phase shift
1 Introduction
During an earthquake,failure of retaining struc‐tures can cause significant damage to critical infra‐structure.With their simple form,ease of construction,and ability to adapt to lower bearing capacities of foundations,cantilever retaining walls are widely used to retain structures.During the 1995 Hyogoken-Nanbu earthquake,many cantilever retaining walls sustained moderate damage,with seismic perfor‐mance intermediate between conventional masonry or unreinforced concrete gravity retaining walls and geosynthetic-reinforced soil retaining walls (Tatsuoka et al.,1996).Since then,researchers have investigated the seismic performance of various retaining walls.
There are three primary approaches to seismic studies of retaining walls:the analytical method(Mon?onobe and Matsuo,1929;Seed and Whitman,1970;Veletsos and Younan,1997;Kamilo?lu and ?ado?lu,2019),physical modelling (Al Atik and Sitar,2010;Conti et al.,2012;Ertugrul et al.,2017;Gao et al.,2017;Jo et al.,2017),and numerical simulation(Green et al.,2008;Osouli and Zamiran,2017).The analytical method relies on ideal assumptions that are not always consistent with reality.Among them,the classical analytical methods include the pseudostatic Mononobe-Okabe (MO) method and the Seed-Whitman(SW)method(Mononobe and Matsuo,1929;Seed and Whitman,1970).In numerical simulations,the determination of appropriate boundary conditions and constitutive models is complicated.By contrast,physical modelling is reliable as it can visually and realistically evaluate the dynamic behaviour of retain‐ing walls under earthquake loads (Wood et al.,2002;Eftekhari and Panah,2021;Kilic et al.,2021;Li et al.,2021;Samee et al.,2022).Nevertheless,physical modeling may exhibit limitations such as failing to strictly satisfy the similarity law,potentially leading to a deviation from reality.To better estimate the per‐formance of prototype structures,a modified similarity law has been proposed (Wood et al.,2002).To date,the seismic physical model testing of the retaining wall primarily involves 1gshaking tables and dynamic geotechnical centrifuges (gdenotes the acceleration of gravity).
Initially,cantilever retaining walls were tested on shaking tables compared to the conventional pseudostatic approaches (Koseki et al.,1998b;Watanabe et al.,2003),but usually on small-scale models.Dy‐namic centrifuge modelling of a cantilevered retain‐ing wall (Al Atik and Sitar,2010) showed that due to a phase difference between dynamic earth pressure and wall inertia,the design method with forces simul‐taneously acting on the retaining wall was excessively conservative.The dynamic earth pressure has a trian‐gular distribution along with the wall height and is smaller than the MO method.Other studies (Wilson and Elgamal,2015;Jo et al.,2017)also observed that dynamic earth pressures and wall inertia forces are asynchronous.Sand and expanded polystyrene (EPS)composite soil were used as two types of backfill in shake table testing of cantilever retaining walls to compare their effect on dynamic behaviour(Gao et al.,2017).With minor input motions,the magnitude of dynamic earth pressure coincides with the MO method;however,increasing acceleration leads to a larger cal‐culated value than the MO method (Green et al.,2008).The effect of backfill reinforcement on the dynamic response of cantilever retaining walls has re‐ceived relatively little attention.
Reinforced soil structures perform well under major seismic loading and are widely used in earth‐works,such as retaining walls (Krishna and Latha,2009;Ren et al.,2020;Xu et al.,2021),embankments(Tatsuoka et al.,2007;Edin?liler and Toksoy,2017;Watanabe et al.,2020),slopes(Ding et al.,2020),and abutments(Zheng et al.,2018;Xu C et al.,2020).Re‐inforced soil retaining walls are probably the most widely used application of backfill reinforcement tech‐nology.Shake table testing of rigid-faced reinforced soil retaining walls with geogrid reinforcement shows that the displacement of the wall facing can be dra‐matically reduced (Krishna and Latha,2009).The seismic performance of vertical-faced wrap-around re‐inforced soil retaining walls with heat-bonded non‐woven geotextile was tested on a 1gshaking table(Huang,2019).The results suggested that the maxi‐mum tensile forces due to shaking follow a trapezoi‐dal pattern.The possible reinforcement impact on the seismic response of reinforced soil retaining walls has also been confirmed by other studies (El-Emam and Bathurst,2007;Wang et al.,2015;Safaee et al.,2021).The inclusion of woven geotextile reinforcements in the embankment model attenuates transmitted acceler‐ation travelling through reinforced embankment mod‐els and improves seismic performance (Edin?liler and Toksoy,2017).Although backfill reinforcement can effectively reduce the seismic response of earth struc‐tures,it remains unclear what the seismic behaviour of cantilever retaining walls backfilled with reinforced soil will be.
This study reports two independent groups of 1gshaking table tests conducted on a cantilever retaining wall retaining either reinforced or unreinforced soils.A stepped-amplitude harmonic base acceleration re‐cord was used as input.The effectiveness of backfill reinforcement behind the cantilever retaining wall was examined against fundamental frequency,time histo‐ries of acceleration,acceleration amplification,hori‐zontal displacement of the wall facing and backfill,dynamic earth pressure,and reinforcement load.
2 Experimental procedure
2.1 Shaking table facility and soil container
Physical model testing was carried out at South‐west Jiaotong University,China using a servo hydrau‐lically controlled seismic simulation shaking table.The table vibrates unidirectionally with a frequency range of 0.4 to 15.0 Hz and a maximum displacement of 100 mm.Its maximum thrust and payload are 400 and 250 kN,respectively.The shaking table’s load‐ing platform measures 4 m×2 m,and in full load con‐ditions,its peak acceleration amplitude is 1.2g.
Modelling was carried out in a rigid steel soil container bolted to the shaking table’s loading plat‐form.The rigid soil container has internal dimensions of 2.1 m high,3.5 m long,and 1.5 m wide.Steel sec‐tions with hollow rectangular sections are welded into the skeleton of the rigid box.For observation of the test phenomenon,the closed end of the container was made from a steel plate in the shaking direction,while the remaining two sides were made from transparent acrylic glass.Furthermore,a 40-mm-thick sheet of ex‐panded polystyrene foam was used inside the closed end of the model box to reduce the reflection of waves on the boundaries.Fig.1 provides a general view of the shaking table system with its critical mechanical components.
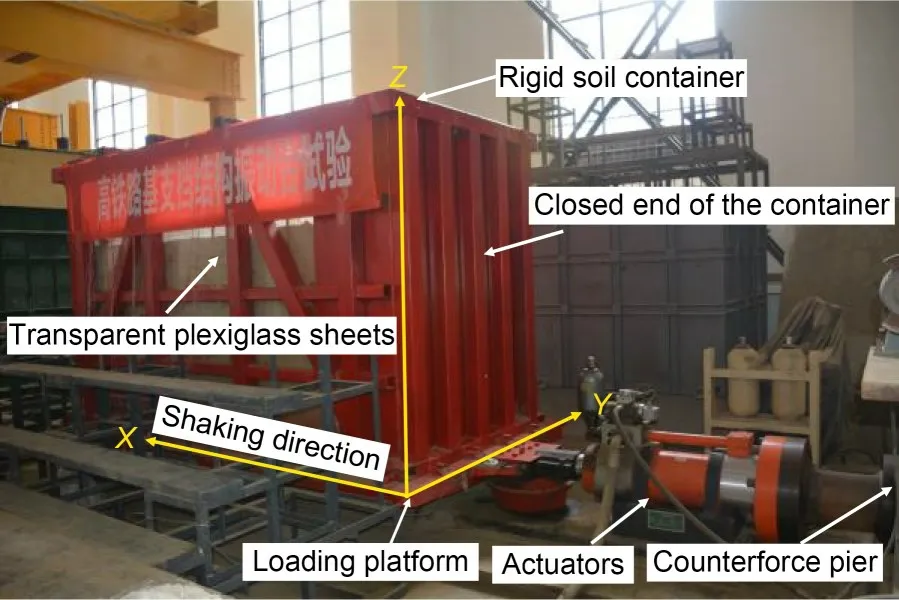
Fig.1 Rigid soil container mounted on the shaking table
2.2 Scaling laws
As is well known,a reduced-scale physical model needs to adhere to specific similitude laws to replicate the behaviour of its prototype.The scaling laws pro‐posed by Iai (1989) with development (Wood,2004)were applied in this study.A close relationship exists between soil shear modulus and effective stress.In the 1gshaking table test,the effective stress of back‐fill,however,is lower than the prototype structure.Given the same soil material and unity density em‐ployed for the model and prototype,the shear modu‐lus will be different.According to Hardin and Drnev‐ich (1972),a positive relationship exists between the soil shear modulusGand the power function of the effective stressσ′(G∝(σ′)λ).For the soil type,the ex‐ponentλis a dimensionless governing parameter,pre‐scribed,based on practical experience,as 0.5 for sand(Kokusho,1980;Yu and Richart Jr,1984).
It is now common practice to use scaling laws when testing geotechnical structures such as slopes and retaining walls on a 1gshaking table (Yazdan‐doust,2017;Xu P et al.,2020;Yünkül and Gürbüz,2022).Based on the size of the model container and the capacity of the shaking table equipment,the geo‐metric scale was chosen to beN=4 and the similarity ratio of acceleration and density to be 1.0.By consid‐ering the correction of the soil shear modulus,the sim‐ilarity relationship is determined for the remaining physical quantities,as shown in Table 1.
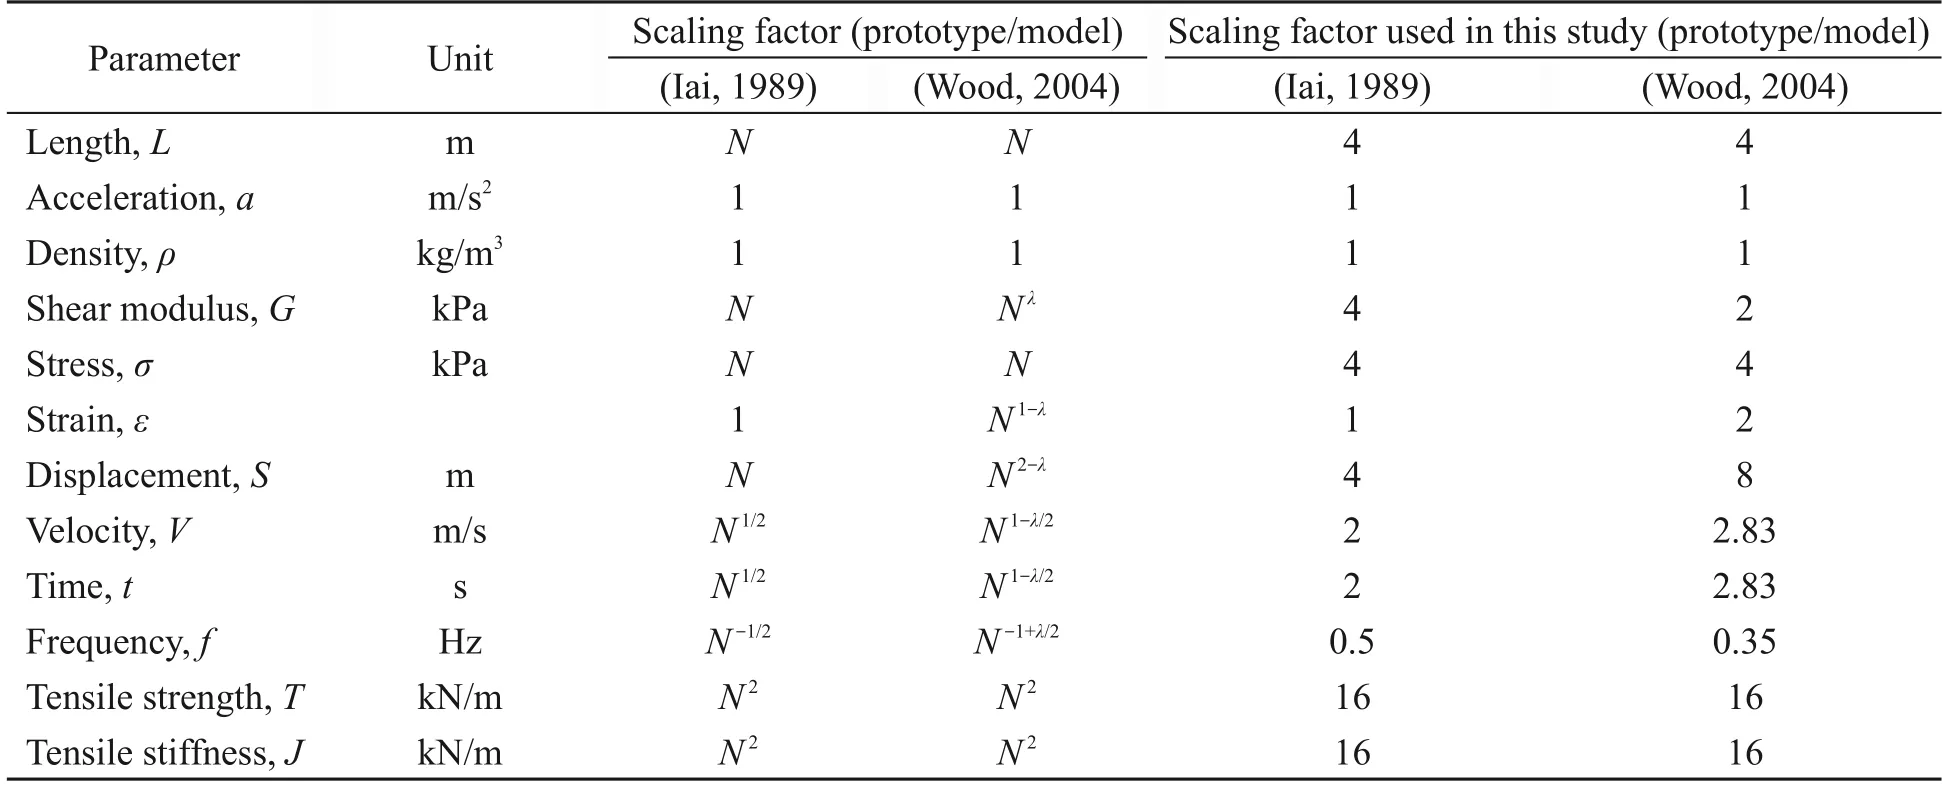
Table 1 Scaling laws used for the 1g shaking table test in this study
2.3 Model geometry
A cantilever retaining wall with reinforced and un‐reinforced cohesionless backfill was subjected to two sets of shaking table tests,referred to in this study as the reinforced and unreinforced models.Fig.2 illus‐trates the instrumentation arrangement and schematicgeometry of the two sets of models.Both models have identical geometric dimensions,with a height of 1.50 m and a width of 3.26 m along the shaking direc‐tion.The backfill is of the same height as the retain‐ing wall.An iron platen was used on the shaking table to support the model retaining wall,and the founda‐tion was considered a stiff,rigid foundation,as in an‐other study (Nakajima et al.,2021).The toe restraint boundary profoundly affects the seismic behaviour of a retaining wall,whether it is hinged or sliding(El-Emam and Bathurst,2005;Yünkül and Gürbüz,2022).In the present study,the toe of the retaining structure is restricted from horizontal translation but allowed to rotate(in other words,there is a hinged toe boundary) for modelling the embedment depth in the two models.The reinforced backfill model uses eight layers of reinforcement from bottom to top at a spac‐ing of 0.15 m.The ratio of reinforcement length to wall height (L/H) was 1.23,which was out of the ex‐perience value range of reinforcement length of 0.8–1.0.Furthermore,between the wrapper and the stem of the retaining wall is a bedding layer of 0.1-m-thick coarse sand.Since the retaining wall is not symmetri‐cal in the transverse direction of the road or rail lines,there are mainly two states in the wall–soil interac‐tion: soil thrusting the wall and wall squeezing the soil.The soil thrusting the wall represents the most unfavourable scenario,which determines the direction of vibration applied.
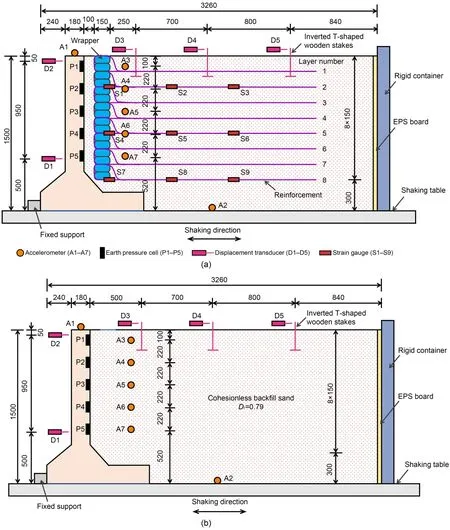
Fig.2 Profile view of model configuration:(a)reinforced model;(b)unreinforced model(unit:mm).Dr is the relative density
2.4 Materials
Locally available air-dried river sand,primarily composed of quartz with a specific gravity of 2.63,was used as the backfill material.In terms of dry unit weights,the maximum and minimum are 18.7 and 13.3 kN/m3,respectively.By the Unified Soil Classifi‐cation System,the backfill material was classified as poorly graded sand with 2.87% fines,coefficient of curvatureCc=0.76,and coefficient of uniformityCu=7.81.Each model test was conducted with a bulk unit weight of 17.3 kN/m3(Dr=79%) and moisture contentw=1%.Direct shear tests were conducted using the same vertical stress levels and bulk unit weight indi‐cated in the model walls.The peak friction angle of the backfill was determined to be approximately 47.7°.
The prototype of the model is to be used for fill sections of high-speed rails in a high seismic hazard zone.The model retaining wall was scaled at a ratio of 1:4 to the prototype wall.The wall was made of precast C40 grade concrete.The model wall configu‐rations were determined by both the loading capacity of the shaking table and the similitude in Table 1.To simulate the 6-m height of the prototype,the model retaining wall was designed to have a height of 1.5 m.Other dimensions of the model retaining wall were de‐termined accordingly,producing a wall bottom width of 1.0 m,a cantilever stem width of 0.18 m,a wall heel slab thickness of 0.18 m,and a length of 1.45 m along the line alignment.The rebar reinforcement of the model retaining wall was scaled down correspond‐ingly.The earth pressure cells were mounted in five concave cylindrical holes on the back of the model re‐taining wall.In addition,three hollow polyvinyl chlo‐ride (PVC) pipes were embedded when the model wall was fabricated,thereby making the fluid lines of earth pressure cell leading out of the wall chest.The relative flexibility was determined according to Velet‐sos and Younan (1997).The relative flexibility of the model wall-soil system is approximately 4.73 (proto‐type is 6.31),indicating that the model retaining wall was rigid (Ertugrul and Trandafir,2013;Liu et al.,2021).The model and prototype are close enough in flexibility to meet similarity requirements,suggesting a good model design.
An essential step in the reinforced soil model test is selecting the reinforcement material.Based upon the similarity relationships in Table 1,it is often difficult for the prototype geogrid to satisfy the me‐chanical similarity.Researchers usually use phosphorbronze strips to replace geogrid in 1gshaking table tests (Watanabe et al.,2003;Tatsuoka et al.,2009;Yazdandoust,2017;Xu P et al.,2020).The reinforce‐ment layers were simulated by welding phosphorbronze strips with an aperture size of 0.3 m(longitudi‐nal)×0.15 m (transverse) and 0.2 mm thick.The ten‐sile strength and stiffness of the single-layer phosphorbronze mesh were 11.2 and 1467 kN/m,respectively.Because the prototype reinforcement spacing is 30 cm,the spacing of reinforcements should be 7.5 cm if the geometric scaling is strictly applied,making the model filling process difficult.As a compromise,the vertical spacing of the reinforcement in the model was set at 15 cm.According to the scaling laws,the tensile strength and stiffness of the single-layer reinforcement correspond to 89.6 and 11736 kN/m for the proto‐type.The prototype reinforcement becomes a very stiff geogrid material (Hatami and Bathurst,2000;Safaee et al.,2021).Foil strain gauges were attached to measure the tensile strain developed within the re‐inforcement on the second,fifth,and eighth layers.Fig.3 illustrates the arrangement of reinforcement and strain gauges.
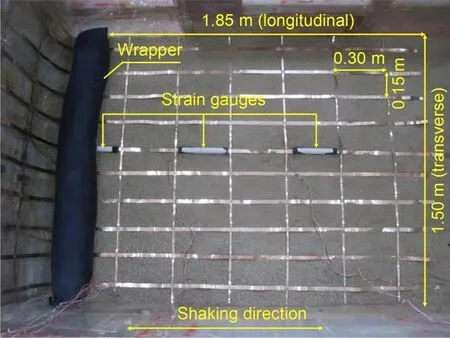
Fig.3 Top view of the arrangement of model reinforcement and strain gauges
2.5 Instrumentation and model construction
The model test included four types of instru‐ments: earth pressure cell,accelerometer,strain gauge,and displacement transducer,as depicted in Fig.2.There were seven uniaxial accelerometers with a max‐imum range of 2g,an accuracy of 0.01g,and an output sensitivity of 1000 mV/g.The accelerometer (A2) on the container base was used to record the shaking table’s input motion.The soil acceleration responses at various elevations were monitored by embedding five accelerometers in the backfill (A3 to A7).Moreover,one accelerometer (A1) was installed on top of the cantilever wall to measure its acceleration response.All accelerometers detect motion parallel to the direc‐tion of shaking.Double-membrane earth pressure cells(67 mm in diameter),capable of measuring earth pres‐sure up to 100 kPa with a resolution of 0.08 kPa,were installed in five predetermined cylindrical hollows at varying heights behind the retaining wall.We used five displacement transducers to measure the hori‐zontal displacement response of the backfill and re‐taining wall.The retaining wall panel was measured at two points,near the toe and the top of the wall.Three additional displacement measurements were made in the backfill,at a distance of 0.5,1.2,and 2.0 m from the back of the retaining wall.A wooden stake,buried inverted and T-shaped,was used to mea‐sure the horizontal displacements of the backfill sur‐face.Due to the small displacement at the wall toe,an eddy current displacement sensor with a full range of 5 mm and an accuracy of 0.05 mm was utilized.By contrast,linear variable differential transducers with a measuring range of 10 cm and an accuracy of 0.5 mm were used for other measuring locations with larger displacement.In the reinforced model,nine strain measurement points were located on the surface of the phosphor-bronze strip.Half-bridge circuits were used to connect the strain gauges with a sensitivity factor of 2.15±0.02 and a resistance of 120 Ω,explic‐itly positioned on the second,fifth,and eighth layers of the central reinforcement strips.Note that water‐proof treatment is required for all instrumentation.
All the sensors were connected to two highfrequency sensor data acquisition systems,each with 32 channels to collect synchronized simultaneous data.A sampling rate of 100 Hz was used in the test,and initial readings were set to zero before each excitation.Before filling the container with sand,transparent cel‐lophane was pasted inside the acrylic glass to minimize boundary friction and ensure that the model exhibited in-plane strain.The prefabricated cantilever retaining wall was lifted into the model container and placed in a predetermined position.The gap between the retain‐ing wall and the Plexiglas sidewall was filled with EPS sheets to prevent backfill sand from escaping.The wall was fitted with earth pressure cells on the back.The height of model was 1.5 m,evenly divided into 10 layers.A volume-controlled technique was used to achieve the same relative densityDr=79% in all layers.Sand mass was calculated by relating rela‐tive density to the volume.After that,a rigid steel plate was used to compact the backfill manually.
It is vital to lay the reinforcement as part of the reinforced model.Initially,the reinforcement mesh was laid horizontally over the backfill,and the sandbag was positioned neatly at the foldback section of the reinforcement.Next,the reinforcement was folded back and wrapped around the sandbag,and the back of the wrapper was filled and compacted to the target elevation for the layered fill.Lastly,a 0.1-m-thick space between the wrapper and stem of the wall was filled with sand of the same density.The whole con‐struction process involved filling the reinforced body and the coarse sand bedding layer by layer,while ac‐celerometers were buried at predetermined locations throughout the construction phase.The displacement sensors were installed once the model was filled.Fig.4 illustrates the backfill procedure for the rein‐forced model.
2.6 Input ground motions
The dominant frequency of earthquake motions is between 0.1 and 10.0 Hz (Varnier and Hatami,2011),and a typical earthquake record lasts between 10 and 30 s.In this study,a 9-s harmonic wave with a predominant frequency of 5 Hz was chosen as the input ground motion for the physical modelling.Ac‐cording to the scaling laws in Table 1,the prototype is subject to a harmonic wave with a duration of 25.47 s and a predominant frequency of 1.77 Hz.It is then reasonable to choose the nominal frequency and dura‐tion of the sinusoidal wave.The typical time histories and Fourier spectra of the sine wave used in the test are shown in Fig.5.There is a ramped cycle at the be‐ginning of every acceleration signal,40 constantamplitude cycles in the middle,and one ramped cycle at the end.This condition is coincident with the gradual increase,steadying,and gradual decay of natural earth‐quake records(Bathurst and Hatami,1998;Xu P et al.,2020).The input motions are amplified to three levels of input peak base acceleration (PBA) of 0.11g,0.24g,and 0.39g,corresponding to probabilities of exceedance in 50 years of 63%,10%,and 2% for the prototype structure in a high seismic hazard zone,re‐spectively.In this research,these three inputs are re‐ferred to as minor,moderate,and major earthquakes(Lu et al.,2018).Researchers have used sinusoidal waves as inputs to the shaking table test to investigate the dynamic response of retaining walls (Krishna and Latha,2007;Safaee et al.,2021;Xu et al.,2021;Yünkül and Gürbüz,2022).From Fig.5,it is also evi‐dent that the sinusoidal signal is not perfectly har‐monic,and contains the high-order harmonics of the integral times of the predominant frequency.This phe‐nomenon is due to the nonlinear problem in the servo system of the electro-hydraulic shaking table.These high-order harmonics are part of the effect of the me‐chanical actions on the models (Brennan et al.,2005;Conti et al.,2012;Yao et al.,2014).Therefore,these high-order harmonics cannot be filtered out.A fre‐quency sweep is used to detect changes in dynamic properties of the model after each stage of sinusoidal loading with white noise of 0.05gacceleration and a duration of 30 s.
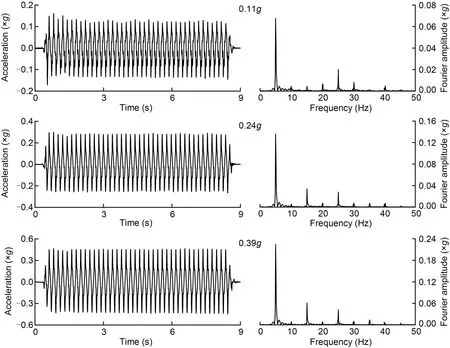
Fig.5 Acceleration time histories and Fourier spectra of the input harmonic waves
3 Analysis and discussion
Before analyzing test results,it is crucial to first clarify the sign conventions for acceleration,displace‐ment,earth pressure,and reinforcement load.When the value of input acceleration is assumed negative,the wall-soil system is subject to the seismic inertia force toward the free surface,moving away from the backfill relative to the shaking table.The displace‐ment value is assumed positive to show the active state of the soil thrusting the wall,and vice versa.It is de‐scribed below how each test quantity relates to the input acceleration when it is negative.The retaining wall and the backfill interact if the earth pressure is positive,and the backfill is unloading when the earth pressure is negative.Positive reinforcement load indi‐cates that the reinforcement is in extension.
3.1 Fundamental frequency
Among the critical parameters in retaining wall dynamics is the fundamental frequency (Hatami and Bathurst,2000).Analyzing the transfer function of the retaining wall model,which is defined as the ratio between the frequency content of the response to input motion,we determined the fundamental fre‐quency.Upon input of the white noise signal to the shaking table,the acceleration time history of each ac‐celeration measurement point is obtained.The trans‐fer function TF(f,j) at a given frequencyfand mea‐surement pointjis defined by
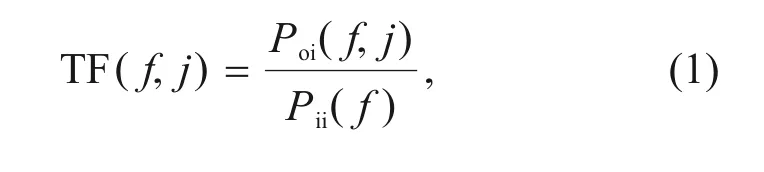
wherePoi(f,j)is the cross-power spectral of measure‐ment pointjand shaking table input signal,Pii(f) is the self-power spectral of the input signal (Brennan and Madabhushi,2009;Krishna and Bhattacharjee,2017).Fig.6 depicts the transfer function results at different monitoring points for the reinforced and un‐reinforced models once the construction is complete.As can be seen,the first fundamental frequencies of each measuring point are nearly equal.The fundamen‐tal frequencies of the unreinforced and reinforced models are comparable(22.71 and 22.69 Hz).Because of this,the effect of backfill reinforcement on cantile‐vered retaining walls before earthquakes is minimal.Based on the scaling law for the frequency in Table 1,the fundamental frequencies of the unreinforced and reinforced prototype structures are 7.95 and 7.94 Hz,respectively,which are in the range of medium-high frequency earthquakes.The fundamental frequency is mainly affected by the input ground motion intensity and the ratio of width to height for backfill.At the same time,the effect of reinforcement length and stiff‐ness is less significant(Hatami and Bathurst,2000).
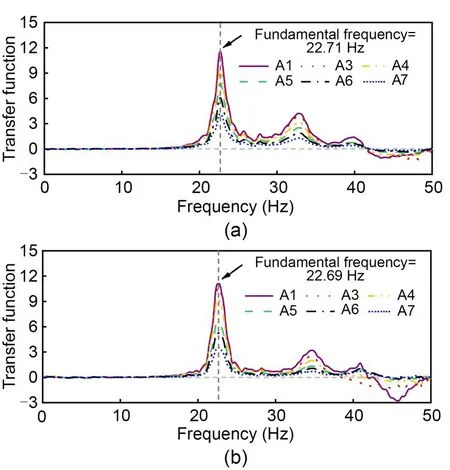
Fig.6 Transfer function of six locations to base accelerations in unreinforced and reinforced models: (a) unreinforced model;(b)reinforced model
Fig.7 illustrates the fundamental frequencies of two models following earthquakes of varying intensi‐ties.It is evident that with the increase in loading am‐plitude,the fundamental frequency exhibits a mono‐tonic decline,and the model structure gradually expe‐riences degeneration,which is as expected.The funda‐mental frequencies of the unreinforced and reinforced models are similar after 0.11gloading,while they dif‐fer after 0.24gand 0.39gloadings.A lower value for the unreinforced model than that for its counterpart suggests that the reinforcement mitigates the stiff‐ness degradation and potential structural damage.
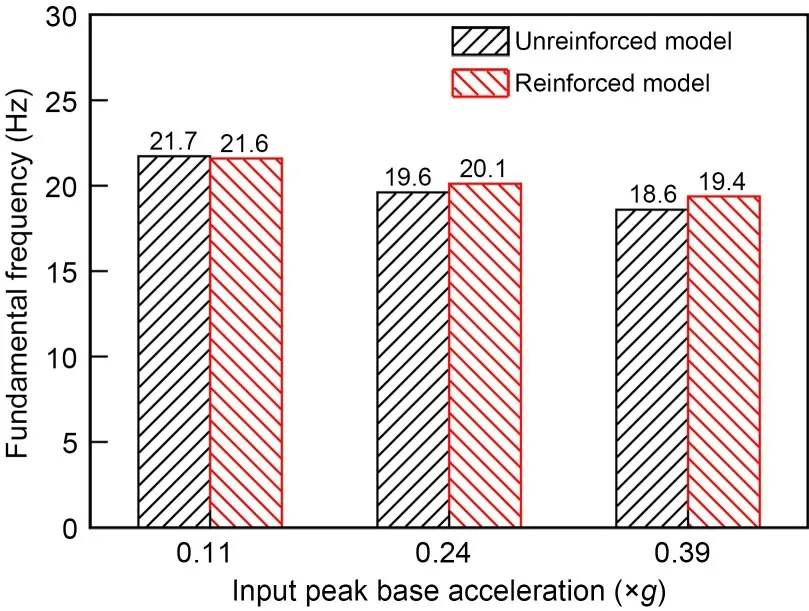
Fig.7 Fundamental frequencies of unreinforced and reinforced models versus different input peak base accelerations
3.2 Acceleration
Acceleration response is another essential indi‐cator of the seismic performance of geotechnical struc‐tures.Fig.8 shows the acceleration time histories of the unreinforced model and its Fourier spectrum under 0.39gloading.The duration of the time history is limited to 1 s in order to avoid ambiguity.One can see that there is a delay between the acceleration response and the input signal;the negative peak of measurement pointjis delayed by Δt(j) when the acceleration peaks in the negative direction.Besides,the acceleration peak increases with the elevation of the measurement point,and the curve gradually be‐comes more irregular,suggesting an increase in the high-frequency component.Fourier analysis corrobo‐rates this by showing that amplification occurs not only at the 5-Hz domain frequency,but also at the higher-order harmonics.
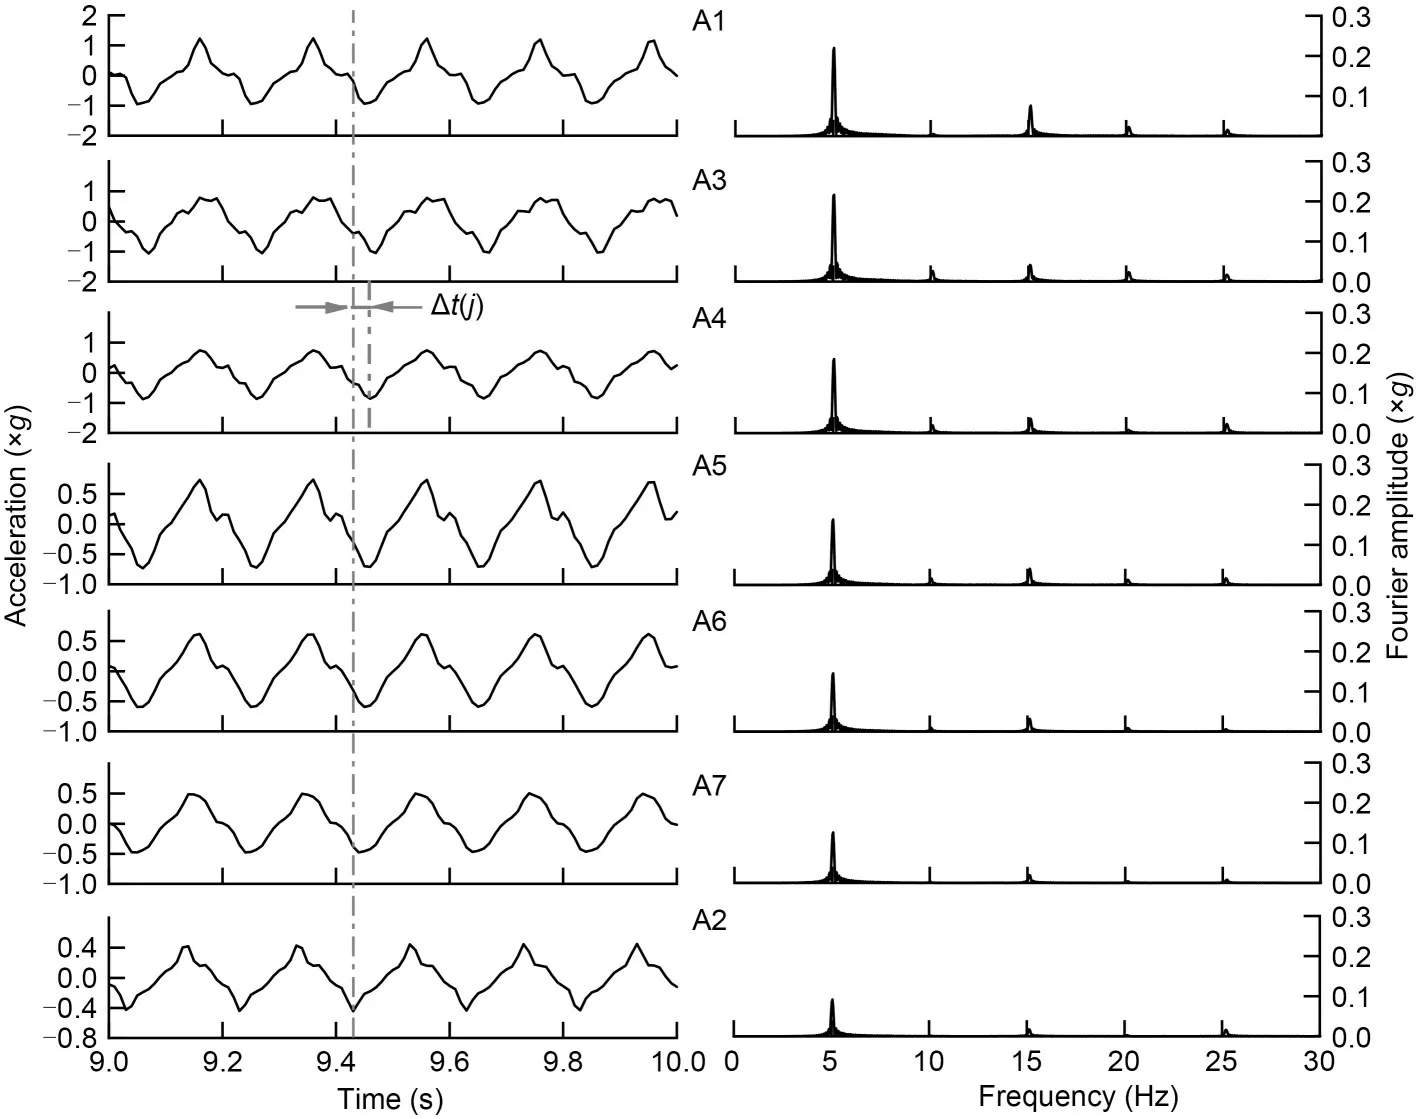
Fig.8 Acceleration time histories and Fourier spectrum of the unreinforced model under 0.39g loading
The phase shift between the input ground motion and acceleration measurement pointjcan be computed as
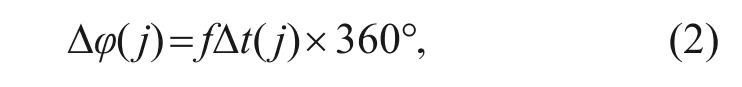
wherefdenotes the predominant frequency of the input signal,and Δt(j)denotes the propagation time of the wave from the shaking table to the measurement pointj.The phase delay of the acceleration response at measurement points relative to the table is calculated and presented in Table 2.The phase shift increases as the height of the measurement point position increases,which is due to the time taken for the vibration wave to propagate from the table to each measurement point.The phase delay at the crest of the wall is slightly greater than that over the backfill surface for a smaller amplitude of input ground motion,while the opposite pattern occurs for major earthquakes.The phase delay of acceleration propagation in the model structure is not significant,whether reinforcement is provided or not.
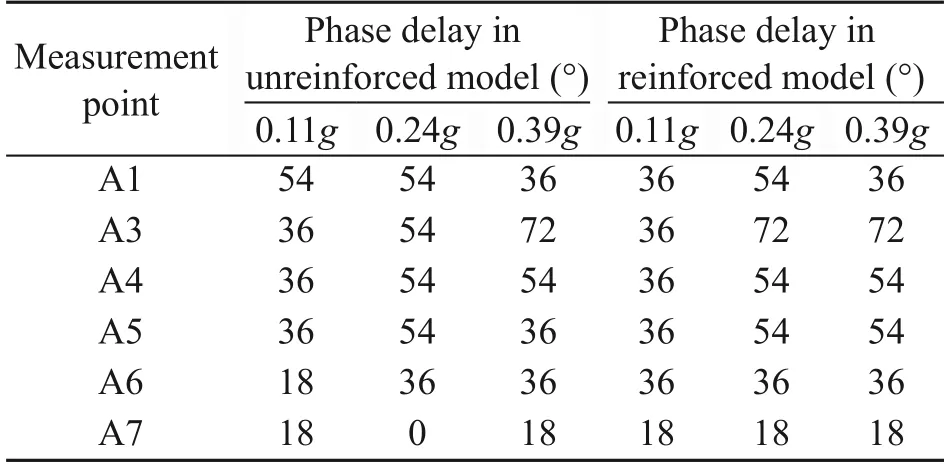
Table 2 Phase delay between the response acceleration and input acceleration in time histories
The amplification factor of root-mean-square ac‐celeration (RMSA) evaluates the amplification and deamplification effect at different elevations of the input ground motions.The RMSA can take into account the effects of amplitude and spectrum to reduce highfrequency signal noise,calculated by Kramer(1996).
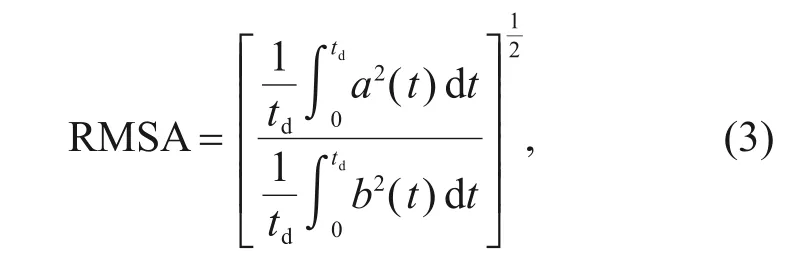
wheretdenotes the time,a(t)is the time history of ac‐celeration at different elevations,b(t) is the accelera‐tion time history of the input ground motion,andtdis the duration of the acceleration record.
The distribution of acceleration amplification fac‐tors along the normalized height for the unreinforced and reinforced models is shown in Fig.9.The normal‐ized height is defined as the ratio of elevation of mea‐surement points to the wall height.In both unrein‐forced and reinforced models,the acceleration ampli‐fication factor increases nonlinearly with the height of the wall;the acceleration at the crest of the wall is slightly greater than that on the backfill surface.How‐ever,in the traditional pseudo-static approaches or de‐sign codes,the acceleration is generally assumed to be uniform with increasing wall height.Increasing ac‐celeration amplitude leads to an increase in accelera‐tion amplification factor,possibly due to the strong boundary constraints of the retaining wall model.There is no evidence of particularly severe damage to the model,which is well maintained within the tested amplitude range.An unreinforced model has a smaller acceleration amplification factor as a reinforced model,indicating that the soil with reinforcement can effec‐tively mitigate the amplification effect of ground shak‐ing.At 0.11g,the acceleration amplification factors of both models are similar,indicating that the load am‐plitude has not yet reached the threshold acceleration required to mobilize the reinforcement effect (Ding et al.,2020).Under 0.24gand 0.39gloadings,the acceleration amplification factor of the reinforced model is significantly smaller than that of the unrein‐forced model by a reduction of 7.5%–11.7% and 3.7%–10.2%,respectively.
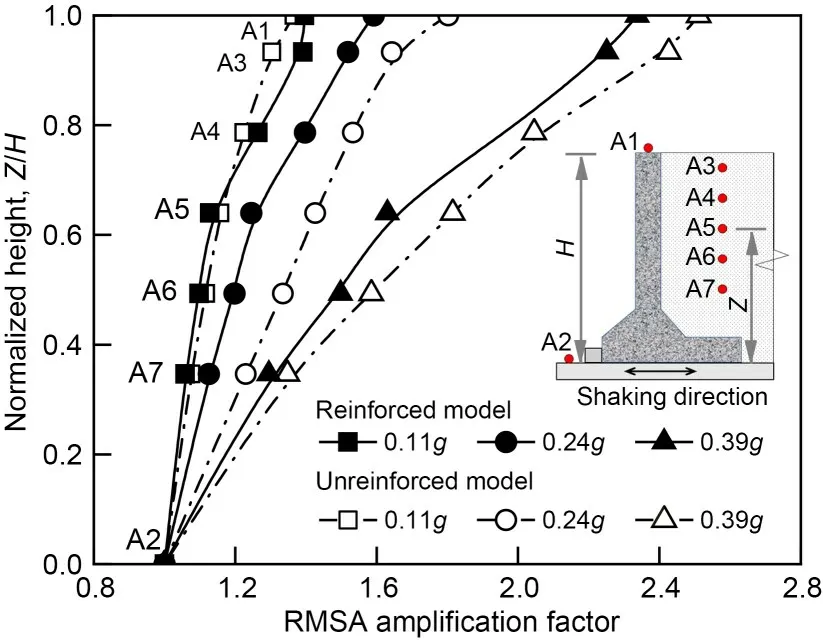
Fig.9 Distribution of the acceleration amplification factor against the normalized height
3.3 Displacement
Fig.10 shows the time histories of the accelera‐tion at the base and top of the wall,the horizontal displacement,and the backfill.Displacement time histories follow a pattern consistent with the input mo‐tion,which is a harmonic wave.Since there is a phase difference between the input acceleration and the ac‐celeration at the crest of the wall,we evaluated the dy‐namic response of each sensor at the moment when the wall acceleration obtains a negative peak,as op‐posed to when the input motion attains a negative peak.The wall is subject to the maximum seismic in‐ertia force at this time.Therefore,the displacement measurement points are almost simultaneously reach‐ing the positive peak.The soil thrusts the wall to the limit,putting its stability into the most unfavourable state.As residual displacement is small after the end of an earthquake,the peak displacement during the wall–soil interaction is the primary consideration.
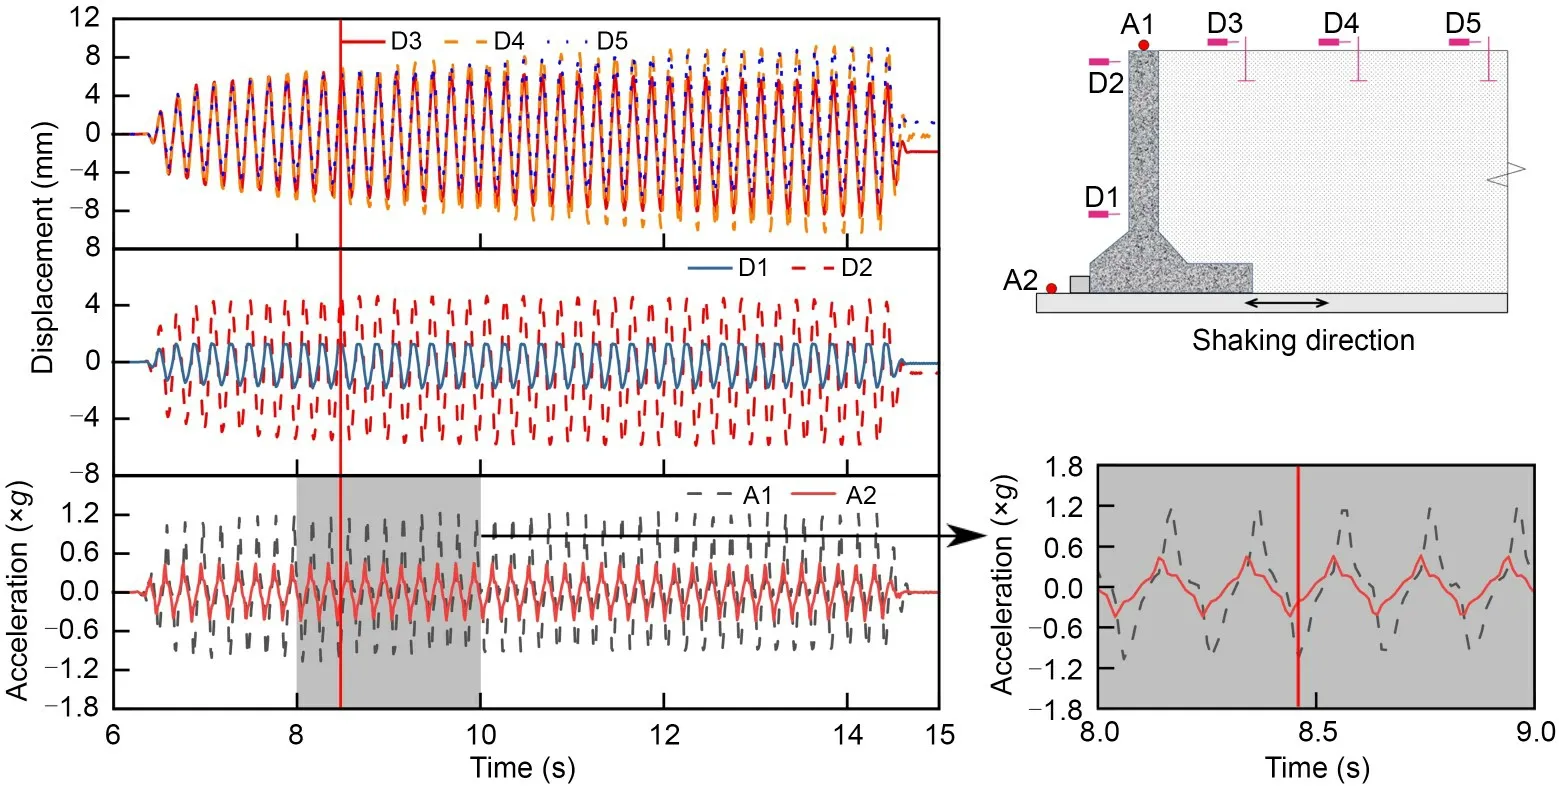
Fig.10 Time histories of displacement and acceleration of the unreinforced model under 0.39g loading
Fig.11 shows the peak horizontal displacement of the wall for the unreinforced and reinforced mod‐els.The displacement measurement points of the lower and upper portions of the wall are indicated by D1 and D2,respectively.Since the wall is rigid as a whole,the D1 and D2 displacement data have been connected and extended to intersect the coordinate axes.The dis‐placement extension lines of all loading conditions con‐verge at the origin;then the wall displacement mode is identified as rotating around the toe of the wall,which creates a good hinged restraint effect.The wall displacements increased with increasing load ampli‐tude for both physical models.The reinforcement can reduce rotational displacement of the cantilever retain‐ing wall in general.There is no apparent effect of back‐fill reinforcement on wall displacement under 0.11gloading.Under 0.24gloading,the wall rotation angles of the unreinforced and reinforced models are 0.96‰and 0.55‰,respectively,producing a 43% reduction.Under 0.39gloading,the wall rotation angles were 3.39‰ and 2.49‰,respectively (27% reduction).Due to the improved soil strength and the reduced dynamic earth pressure,the soil reinforcement decreases the displacement of the retaining wall.
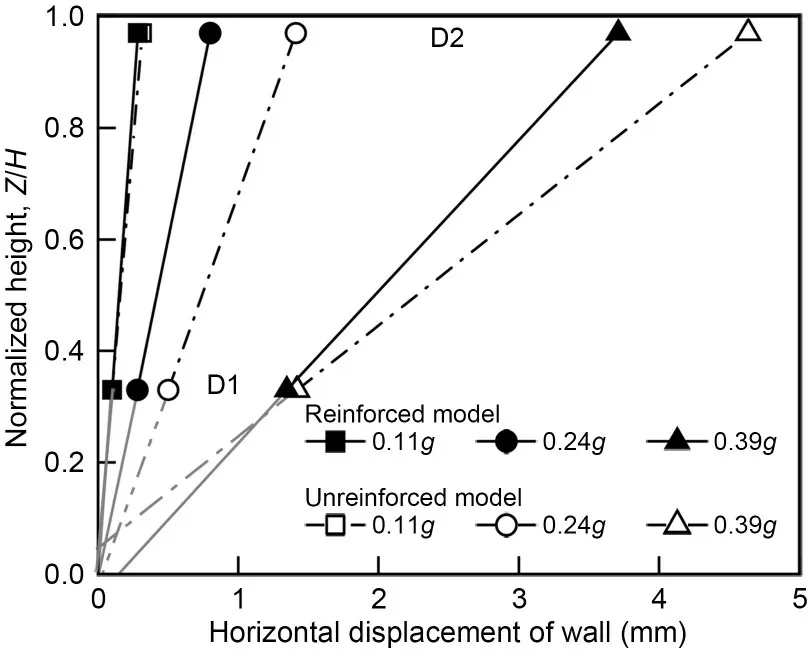
Fig.11 Peak horizontal displacement of the wall during vibration
Additionally,three displacement measurement points were located on the surface of the backfill.The monitoring data show that backfill reinforcement also reduces the peak vibration displacement on the surface.The reinforcement effect is not apparent under the action of 0.11gloading.Under moderate and major earthquakes,the average displacement of the backfill surface was reduced by 22% and 20%,respectively.During a major earthquake,the rigid cantilever plate restrains the displacement of the backfill,and the relative movement between the reinforcement and soil is small,mitigating the reinforcing effect of the back‐fill.It is recommended to reserve deformation condi‐tions to maximize the effect of backfill reinforcement.
3.4 Earth pressure
A duration of 1 s is selected at each level during loading to investigate the wall–soil interaction law.Fig.12 depicts the time histories of the accelerationaof A1 at the top of the wall,the dynamic earth pres‐surespof P1–P5 at the back of the wall,and the resul‐tant forceFof the dynamic earth pressure.The effect of reinforcement on the wall–soil interaction is ob‐served.When the acceleration A1 reaches a negative peak value in the unreinforced model,the wall experi‐ences a peak inertia force toward the free surface;the resultant force of dynamic earth pressure is then at its maximum,and earth pressure and inertia force are synchronized.Thus,the inertia force and seismic earth pressure are always synchronized,regardless of the load amplitude.As for the reinforced model,the syn‐chronization of wall–soil interaction varies with the load amplitude.In 0.11gand 0.24gconditions,the re‐sultant force is not at the positive peak but approxi‐mates zero when the wall acceleration is at negative peaks.This phenomenon implies no synchronized in‐crease occurs for earth pressures measured at each lo‐cation.The inertial force and seismic earth pressure synchronized again at 0.39g.In this case the seismic design of the retaining wall is based on the simultane‐ous maximum of the inertia force and the seismic earth pressure;an overly conservative design is thus obtained,which fails to reflect the actual wall–soil interaction under minor and moderate earthquakes.The phenomenon of wall–soil interaction asynchrony has been reported in the literature (Al Atik and Sitar,2010;Jo et al.,2017).For low intensity earthquakes,the inertia force contributes significantly to the stability of the retaining wall;in contrast,the dynamic earth pressure acting on the wall back is significant at large earthquake intensity.
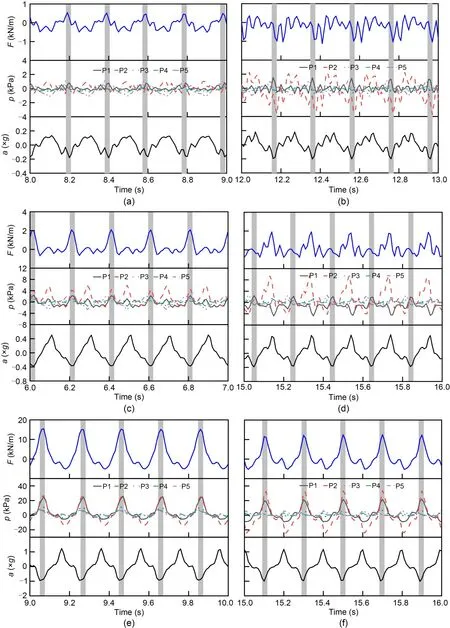
Fig.12 Time histories of wall acceleration a,dynamic earth pressures p,and the resultant force F: (a) 0.11g-unreinforced model;(b) 0.11g-reinforced model;(c) 0.24g-unreinforced model;(d) 0.24g-reinforced model;(e) 0.39g-unreinforced model;(f)0.39g-reinforced model
The distribution of dynamic earth pressure along the wall height under the unfavourable active state is shown in Fig.13.The dynamic earth pressure distri‐butions of the pseudo-static MO and SW methods are also given under 0.39gloading.The dynamic earth pressure is large at the top but decreases towards the bottom,consistent with the SW method.The measured earth pressure fluctuates around zero during minor and moderate earthquakes,and some measurement points even produce negative values,indicating the existence of unloading.Almost all dynamic soil pres‐sure measurement points are reduced after backfill re‐inforcement;a few exceptions may be due to acciden‐tal error,but the dynamic earth pressure is generally reduced.The effect of backfill reinforcement on the distribution pattern of dynamic earth pressure is not apparent.
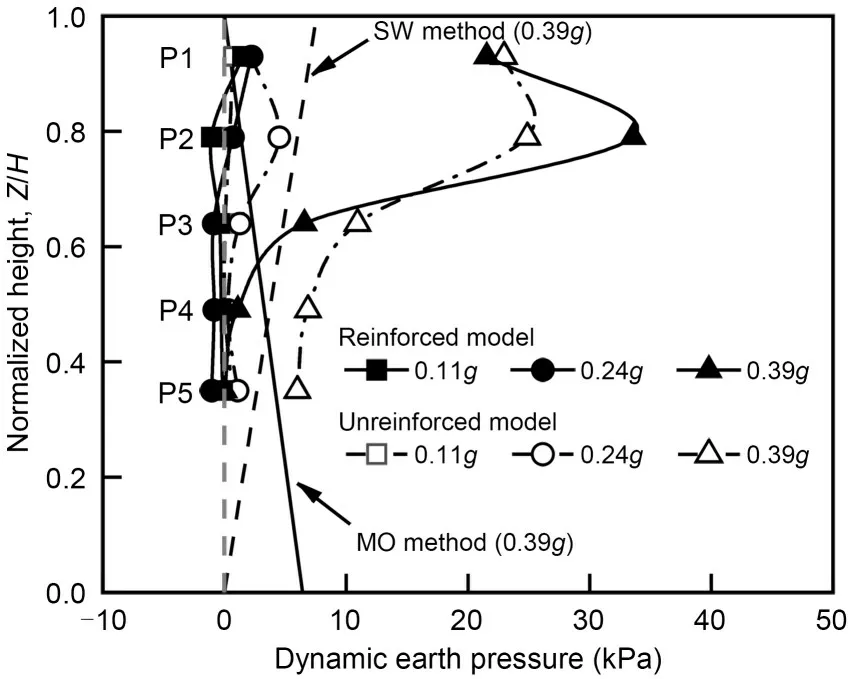
Fig.13 Distribution of dynamic earth pressure along with the height of the wall at active state
Fig.14 shows the measured resultant forces of dynamic earth pressure of unreinforced and reinforced models.At the same time,the calculated values of the classical pseudo-static MO and SW methods are plot‐ted.It can be seen that the backfill reinforcement re‐duces the resultant force at different load amplitudes.During minor and moderate earthquakes,the resultant force of the reinforced model is approximately zero because of the phase shift in wall–soil interactions.Al‐though the wall–soil interaction is synchronized in a major earthquake,the reinforcement enhances the backfill integrity and reduces the resultant force by 18.3%.As the peak acceleration of the base increases,the resultant forces of both models increase nonlin‐early.In both the minor and moderate earthquake cas‐es,the measured resultant forces are smaller than the calculations by the MO and SW pseudo-static meth‐ods.However,in a major earthquake,the measured resultant forces are higher,consistent with previous study (Green et al.,2008).This phenomenon may be due to the attenuation of soil shear strength under high-intensity shaking loads(Koseki et al.,1998a).
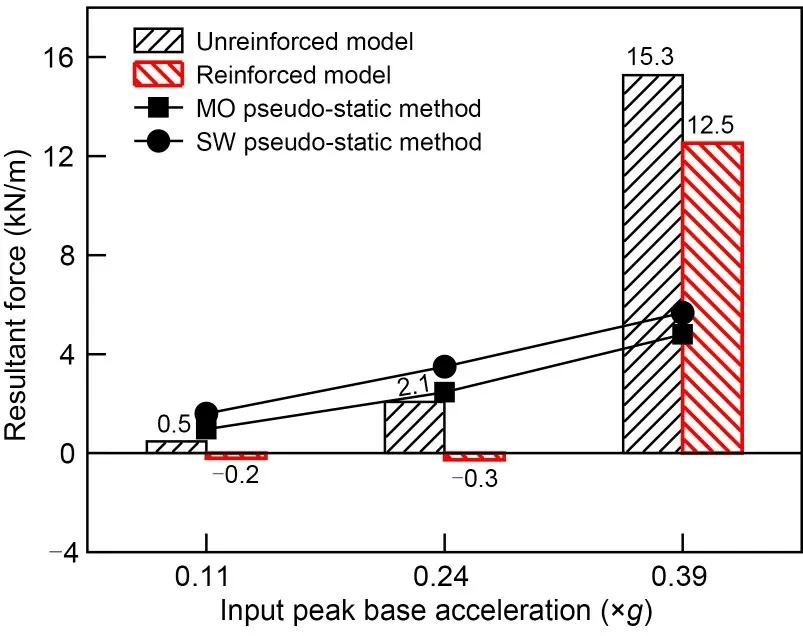
Fig.14 Comparison of the experimental resultant forces of dynamic earth pressure with the calculations by the pseudo-static methods
3.5 Reinforcement load
The measured peak tensile force distribution in three reinforcement layers for the reinforced model is shown in Fig.15,where the force is assumed to be zero at the free end of each reinforcement layer.The dynamic tensile load of the reinforcements is distrib‐uted non-uniformly and,with increasing reinforcement height,the maximum value is gradually displaced from the back of the wall.The dynamic tensile load of each measurement point increases at a larger load amplitude.Once the maximum values along the length of the reinforcement at different layers are connected,we can sketch the approximate location and shape of the potential failure surface of the backfill behind the wall.A piecewise polyline over the heel point of the wall is approximated,with the upper half of the poly‐line being vertical and the lower half being curved.In the horizontal direction,the upper half vertical sur‐face is approximately 0.58 times the wall height from the imaginary wall back passing through the heel point of the wall.

Fig.15 Distribution of peak dynamic load in the reinforcement layer
Fig.16a plots the reinforcement load distribution along the height of three measurement points in the direction of the reinforcement length.Also,the aver‐age tensile forces of nine measurement points during each loading were calculated to represent the dynamic response of the whole model,as shown in Fig.16b.At 0.11g,the dynamic reinforcement load was small with an uniform distribution along the height;at 0.24g,the dynamic load increased to some extent as the rein‐forcement effect improved,and the distribution pat‐tern was not significantly different with respect to the height;at 0.39g,the reinforcement load increased more significantly due to the prominent reinforcement effect,and the distribution pattern can be character‐ized as “l(fā)arge at both ends but small in the middle portion.” Fig.16b shows that loads on reinforce‐ments are nonlinearly related to base acceleration.

Fig.16 Variation of reinforcement load with the height(a)and the load amplitude(b)
4 Conclusions
An investigation of the seismic dynamics of can‐tilever retaining walls backfilled with reinforced and unreinforced soils was undertaken using 1/4 scale shaking table tests.The following are several observa‐tions from the experimental results:
1.Both models show a decrease in fundamental frequency with increasing input acceleration,and there is a degradation in stiffness and potential damage to the wall-soil system.The reinforced model reduces its fundamental frequency more than in the unreinforced model,indicating that reinforcing the backfill can enhance the integrity of the wall-soil system and re‐duce seismic damage.
2.Based on RMSA,the amplification factor in‐creases nonlinearly with increasing height,reaching its maximum at the top of the wall.However,design codes or pseudo-static approaches assume that the ac‐celeration amplification factor stays constant through‐out the height of the wall.A smaller acceleration amplification factor for the reinforced model than for the unreinforced one indicates that backfill reinforce‐ment can mitigate the amplification effect of the input motion.
3.The seismic displacement of cantilever retain‐ing walls increases nonlinearly at larger load ampli‐tudes.Reinforcement has a restraining effect on wall/soil displacement that depends on the input accelera‐tion.The capacity of backfill reinforcement to restrain displacement is constrained by the phenomenon of“backfill chasing the wall”at 0.39gloading.
4.During a period when the wall is subject to the greatest inertia force away from the backfill,the wall is considered most unstable.The inclusion of re‐inforcement yields a phase difference between the ac‐tions of the wall inertia force and the dynamic earth pressure under 0.11gand 0.24gloading.The wall in‐ertia forces and dynamic earth pressures of both models were synchronized during 0.39gloading,but the resul‐tant force in the reinforced model was still 18.3%less than that in the unreinforced one.
5.During seismic excitation,the reinforcement longitude exhibited a nonlinear dynamic tensile force and the reinforcement load distribution along the wall height did not follow a constant pattern.In an approxi‐mate failure surface,the upper half of a piecewise polyline is vertical and the lower half is curved over the heel.The measured dynamic tensile force increased nonlinearly at a larger input acceleration amplitude.
Differential movement between soil and rein‐forcement greatly affects the reinforced backfill effect on the structure’s seismic performance.Future research should consider more technical measures to enhance the differential movement and to explore its role in improving seismic performance of retaining structures in major earthquakes.
Acknowledgments
This work is supported by the National Natural Science Foundation of China (Nos.41901073 and 52078435) and the Sichuan Science and Technology Program of China (No.2021YJ0001).
Author contributions
Qiang LUO designed the research.Ming WEI and Guishuai FENG processed the corresponding data.Ming WEI wrote the first draft of the manuscript.Liang-wei JIANG helped to organize the manuscript.Teng-fei WANG revised and edited the final version.
Conflict of interest
Ming WEI,Qiang LUO,Gui-shuai FENG,Teng-fei WANG,and Liang-wei JIANG declare that they have no con‐flict of interest.
 Journal of Zhejiang University-Science A(Applied Physics & Engineering)2022年11期
- Journal of Zhejiang University-Science A(Applied Physics & Engineering)的其它文章
- Visualizing the dynamic progression of backward erosion piping in a Hele-Shaw cell
- Evaluation of heavy roller compaction on a large-thickness layer of subgrade with full-scale field experiments
- Frozen sand–concrete interface direct shear behavior under constant normal load and constant normal height boundary
- Model test of the mechanism underpinning water-and-mud inrush disasters during tunnel excavation in sandstone and slate interbedded Presinian strata
- Soil effect on the bearing capacity of a double-lining structure under internal water pressure
- Influence of groundwater level changes on the seismic response of geosynthetic-reinforced soil retaining walls