
Increasing the·OH radical concentration synergistically with plasma electrolysis and ultrasound in aqueous DMSO solution
2022-04-12 03:45:10ChaoLi李超DeLongXu徐德龍WenQuanXie謝文泉XianHuiZhang張先徽andSiZeYang楊思澤
Chinese Physics B 2022年4期
關(guān)鍵詞:李超
Chao Li(李超) De-Long Xu(徐德龍) Wen-Quan Xie(謝文泉)Xian-Hui Zhang(張先徽) and Si-Ze Yang(楊思澤)
1State Key Laboratory of Acoustics,Institute of Acoustics,Chinese Academy of Sciences,Beijing 100190,China
2University of Chinese Academy of Sciences,Beijing 100049,China
3Fujian Provincial Key Laboratory of Plasma and Magnetic Resonance,Fujian Engineering Research Center for EDA,Fujian Provincial Key Laboratory of Electromagnetic Wave Science and Detection Technology,Xiamen Key Laboratory of Multiphysics Electronic Information,Institute of Electromagnetics and Acoustics,Xiamen University,Xiamen 361005,China
Keywords: plasma electrolysis,ultrasound,reactive species,OH radical
1. Introduction
Plasma electrolysis is a process in which a discharge resulting from high voltage is applied between the anode and cathode in an electrolyte solution. Strong plasma-liquid interactions lead to the production of active species.[1]These active species can be transported into the solution[2]and initiate chemical reactions that are unlikely to occur under mild conditions.[3]Plasma electrolysis has been widely used in many fields including polymerization to produce polymeric materials,[4]modification of the surface of a material,[5]organic wastewater treatment,[6]organic synthesis,[7]and biomass liquefaction.[8]Ultrasonic cavitation is a dynamical process in which microbubbles vibrate, grow, and collapse under the action of sound waves. A large number of active species can also be produced in this process,[9]which is widely used for polymerization to produce polymeric materials,[10]organic wastewater treatment,[11]and organic synthesis.[12]Although these two individual technologies, plasma electrolysis and ultrasonic cavitation, have been widely investigated separately for similar applications based on free-radical production,their ability to act synergistically to enhance the physiochemical effects of the combined process has received relatively little attention.
Generally speaking, plasma electrolysis relies on high voltage to break down the gas near the electrode to produce active species. Ultrasonic cavitation produces a large number of active species at the gas-liquid interface. The common denominator between plasma electrolysis and ultrasonic cavitation is that species are generated in solution without requiring external disturbance. When the components of the solution are the same, the species produced by the two methods are essentially the same. For example, the species produced by the plasma electrolysis of aqueous solutions mainly include·OH,·O,·HO2,O2,·Hα,and H2O2.[13]The main species produced by ultrasonic cavitation are·OH,·O,·HO2, O2,·Hα,and H2O2.[14]Among them,·OH radicals are highly oxidizing(2.80 eV),affect the formation of other secondary oxygencontaining species, and participate in many related chemical and biochemical reactions.[15,16]
Various physical and chemical methods,such as emission spectroscopy, laser induced fluorescence (LIF), electron spin resonance(ESR)spin trap,and high-performance liquid chromatography(HPLC)have been developed for the detection of hydroxyl radicals in the aqueous phase.[17]These previous experimental studies indicated that the determination of the hydroxyl radical concentration is largely dependent on the types of spin traps because of the different rate constants of the reaction of the hydroxyl radical with trapping agents.[18]Among these methods,emission spectroscopy is a valuable analytical method for quantifying the plasma-generated OH in solution and is expected to yield more precise results. However, this technique is not always straightforward quantitatively,because chemical modifications may not have the requisite selectivity toward various reactive oxygen and nitrogen species(RONS).In addition, these modifications usually require complicated optimization of the conditions for analysis apart from careful comparison and consideration of the kinetic rates.
In this study, dimethyl sulfoxide (DMSO) was chosen and used as the probe compound for the quantification of hydroxyl radicals by using spectroscopy. DMSO was selected on the basis of its high solubility, low volatility, strong polarity, and large rate constant of reaction with hydroxyl radicals (k=4.5~7.1×10⁹mol·L-1·s-1). More details about the measurement principle can be found elsewhere,[19,20]and the quantitative analysis of hydroxyl radicals can be performed by determining the concentration of formaldehyde and formic acid according to the following reactions:
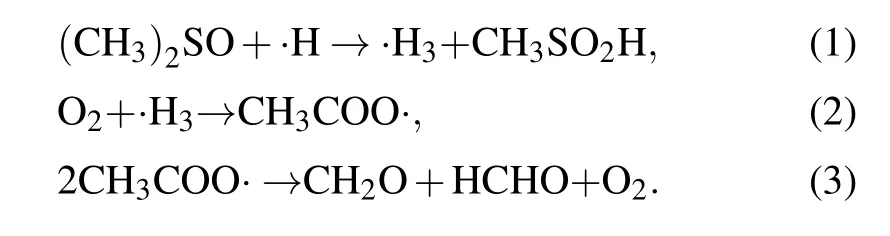
Based on the obtained standard curve of formaldehyde solutions, the·OH concentrations resulting from plasma electrolysis, ultrasonic cavitation, and a combination of these treatments were determined. The mass transfer of the ROS based on the reaction coefficients was further analyzed,and the pathways of·OH production were investigated to deduce the mechanism of synergy between plasma electrolysis and ultrasonic cavitation. A new discharge method was proposed by introducing the mechanism underlying the synergy between the two techniques,which can be used for further applications.
2. Experiment
2.1. Experimental setup for plasma electrolysis and ultrasound
A diagram of the equipment for the plasma electrolysis and ultrasonic treatment of the DMSO solution is shown in Fig. 1. The high-voltage electrode and the ground electrode were inserted through the two outer openings of a three-necked flask such that they extended to the bottom of the solution.The distance between the two electrodes was 10 mm, and the inclination angle was 30°,[21,22]which is conducive to the production of active species. The ultrasonic probe was inserted into the middle opening of the three-necked flask such that it extended to 5 mm below the liquid surface. The ultrasonic power supply was adjusted to form bubbles produced by ultrasonic cavitation between the anode and cathode to generate gas and active species for electrolysis. The voltage, duty cycle, and frequency of the plasma power supply were set at 350 V, 10%, and 500 Hz, respectively. The frequency and power of the ultrasonic power supply were set to 19.71 kHz and 350 W,respectively. Oxygen was passed into the solution at the rate of 1 L/min to serve as the catalyst without participating in the reaction. The DMSO solution was treated separately with plasma electrolysis,ultrasound and both of these two treatments combined. The three-necked flask was cooled in ice water to ensure that the temperature of the solution did not exceed 50°C. The concentrations of formaldehyde and formic acid of the solutions subjected to treatment by each of the three techniques were measured separately.
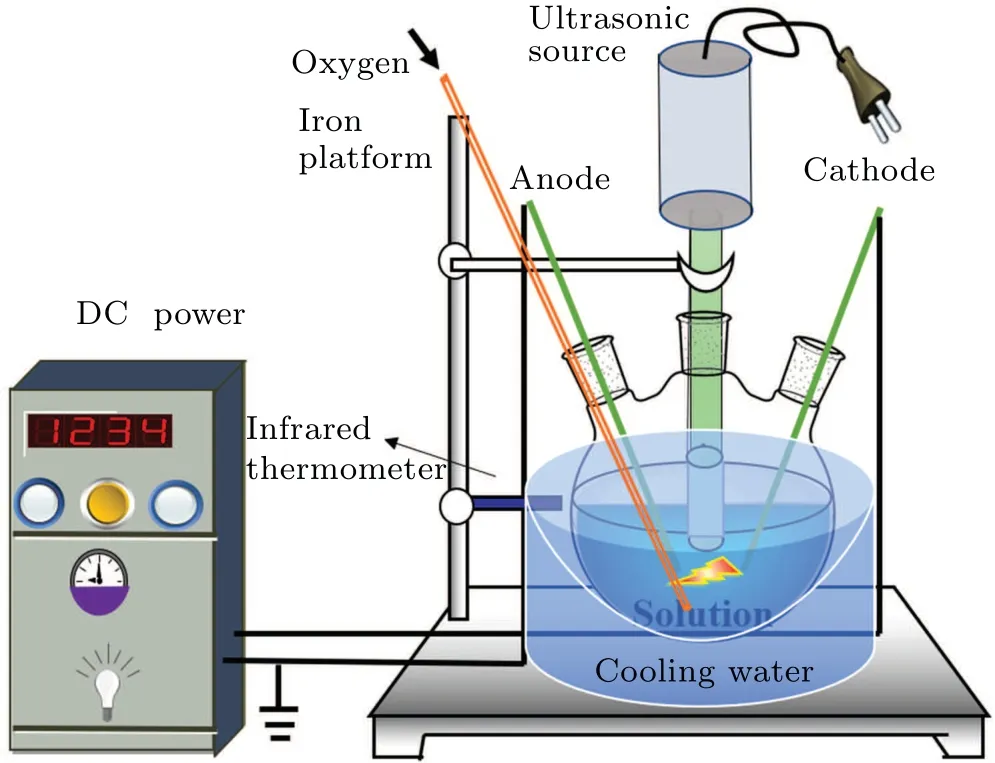
Fig.1. Diagram of the experimental setup for plasma electrolysis with ultrasound.
2.2. Preparation of DMSO solution and measurement of formaldehyde(HCHO)
2.2.1. Formulation of DMSO solution
The concentration of the DMSO solution affects the ability to accurately measure·OH radicals. If the DMSO concentration is too low, there is insufficient DMSO to participate in the reaction with·OH radicals. If the concentration of DMSO is too high, the concentration of HCHO, CH3OH,and CHOOH would obviously increase,which would prevent the·OH radical concentration from being accurately calculated. From[·OH]=2[HCHO]+4[HCOOH],[19]it can be seen that the concentration of OH radicals has nothing to do with methanol. Studies[19]have shown that a 50 mmol/L DMSO solution is the upper limit of the linear increase in HCHO and CHOOH.Therefore, a 50 mmol/L DMSO solution was used,and NaCl was added to adjust the conductivity to 14.5 mS/cm.We placed 80 mL of the configured DMSO solution in each of three three-necked flasks.
2.2.2. Calibration and measurement of formaldehyde
We used 0.1 mol/L formaldehyde standard samples to configure solutions with concentrations of 1 μmol/L,2μmol/L,5μmol/L,10μmol/L,20μmol/L,and 50μmol/L.A spectrophotometer was used to calibrate the standard samples after treatment with a formaldehyde detection kit(Shanghai Enzyme-linked Biotechnology Co., Ltd., resolution: 50 nmol/L to 0.5 mmol/L). Details of the measurement were presented in the literature.[23]
2.2.3. Calibration and measurement of formic acid
The determination of the formic acid(HCOOH)concentration in the solution was similar to that for the formaldehyde quantification. Firstly, we calibrated with standard solutions to obtain a specific standard curve,and then quantified its concentration in the treated solution. The measurement method was reported in detail in the literature.[24,25]
2.3. Measuring the concentration of hydrogen peroxide,ozone,and oxygen
In the experiment,plasma and ultrasound were combined to treat deionized water, and then the hydrogen peroxide,ozone, and oxygen concentrations in the solution were measured. The amounts of these long-lived species were used to verify the mass transfer and conversion path of the·OH radicals and to analyze the relationship between the hydrogen peroxide and·OH radicals.
We divided the treated aqueous solution into three parts,each containing 50 mL, and used them to measure the hydrogen peroxide concentration,ozone concentration,and oxygen concentration. The respective methods for measuring the hydrogen peroxide, ozone, and oxygen concentrations were taken from the literature.[26-28]
3. Results and discussion
3.1. Concentration of OH radicals in solution
The absorbance curves of 1μmol/L,2μmol/L,5μmol/L,10 μmol/L, 20 μmol/L, and 50 μmol/L formaldehyde standard solutions at 630 nm are shown in Fig. 2(a). The linear relationship between the intensity(630 nm)and formaldehyde concentration is shown in Fig.2(b). The fitting degreeR2was 0.99262,and the linear equation after fitting was
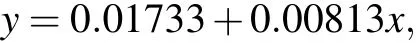
whereyis the absorbance optical density (OD) andxis the concentration of formaldehyde (μmol/L). This linear equation can be used to calibrate the concentration of formaldehyde produced by plasma electrolysis, ultrasonic cavitation,and combined treatments. Samples of the concentration of formaldehyde obtained from different treatments,higher than 50μmol/L,were diluted before measurement.
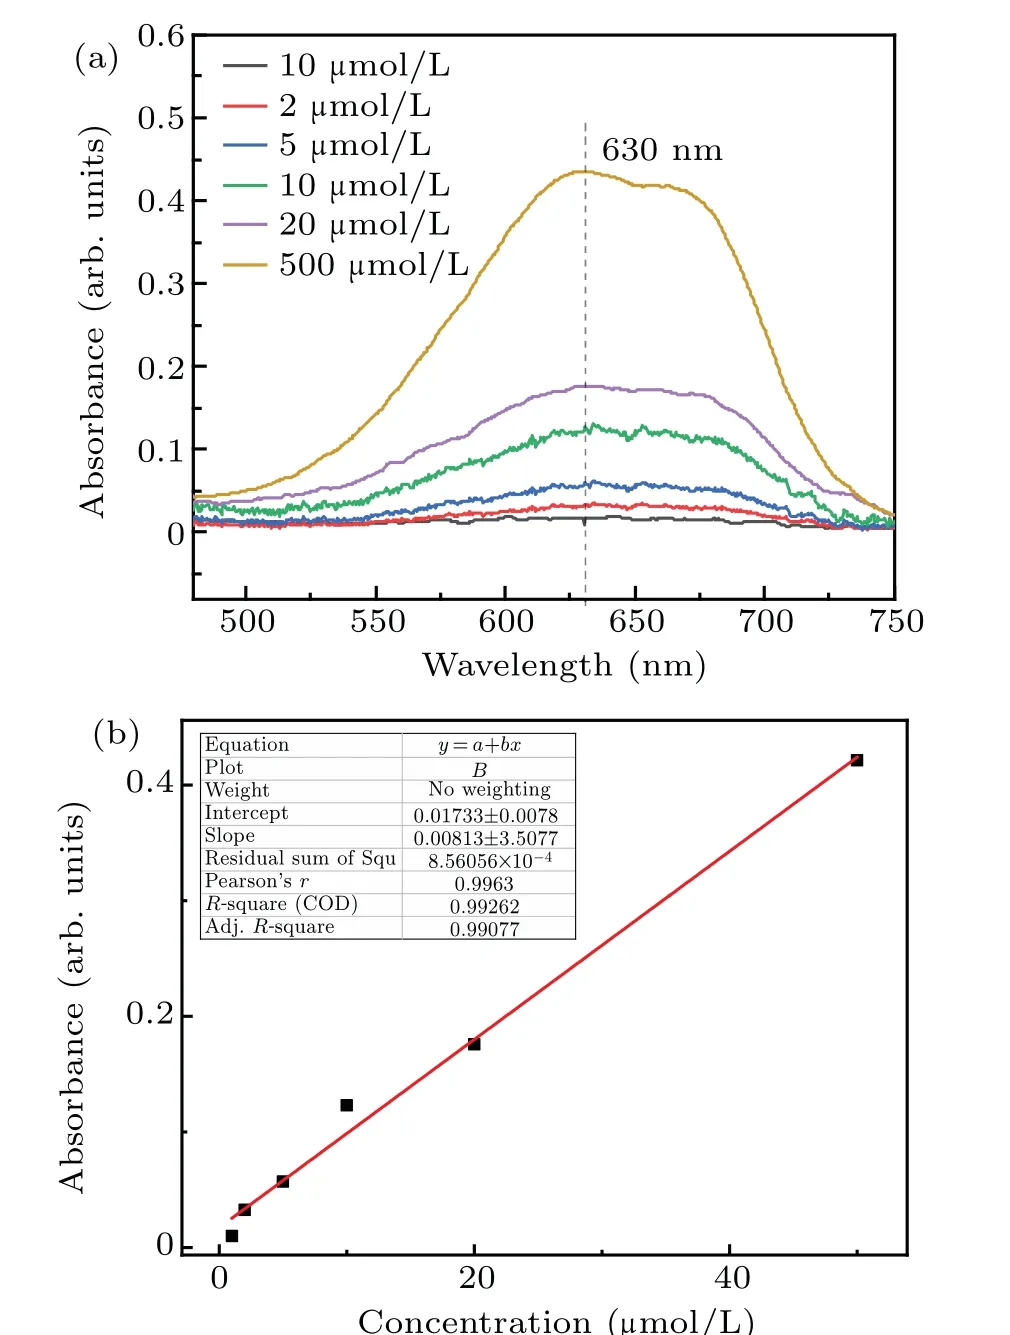
Fig.2. Absorbance curves of formaldehyde standard solutions and the linear relationship between the intensity of transmitted light and the formaldehyde concentration. (a) Standard formaldehyde solution absorbance curve. (b)Linear relationship between the intensity of transmitted light and formaldehyde concentration.
Standard concentrations of formaldehyde (1 μmol/L,2 μmol/L, 5 μmol/L, 10 μmol/L, 20 μmol/L, 50 μmol/L,80μmol/L,and 100μmol/L)were added to detection reagents 1 and 2,as shown in Fig.3,which shows that the color of the standard solution changed from light to dark as the concentration increased. This served as an indicator of the solution process. It should be pointed out that at formaldehyde concentrations of 80μmol/L and 100μmol/L,the fitting coefficientsR2of the linear equation were 0.94163 and 0.90246,respectively.These values reflect a significant increase in the nonlinearity of the relationship.
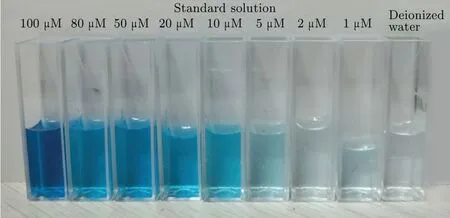
Fig.3. Photographic image of standard formaldehyde solution to which indicator was added.
The three 50.0 mmol/L DMSO solutions were treated by plasma electrolysis, ultrasound, and both of these two treatments were combined, after which detection reagents 1 and 2 were added to each solution. Photographic images of the solutions after different treatment times are shown in Fig. 4.By comparing these samples with the samples prepared by using standard concentrations, we found that the formaldehyde concentration increased with time. After 4 min, the color of the solution changed to dark gray, the absorbance value at 630 nm decreased, and the formaldehyde concentration decreased rapidly, probably because the two treatments caused the temperature of the solution to rise rapidly. At temperatures above 50°C, hydrogen peroxide, formaldehyde, methanol,and formic acid evaporate quickly.This affects the experimental results. Therefore,the treatment time was set at 4 min. The color of the solution was darker than that of the 50μmol/L solution after exposure to the two treatments for 4 min,as shown in Fig. 4. The gray solution had to be diluted with an equal amount of distilled water before it could be measured with a spectrophotometer.
Figure 5 shows the absorption curve of formaldehyde,as recorded by the spectrophotometer after plasma electrolysis,ultrasound,and both of these treatments. The absorbance value at 630 nm was substituted into the linear equation(y=0.01733+0.00813x) resulting from calibration to calculate the corresponding formaldehyde concentration, as shown in Fig.6.
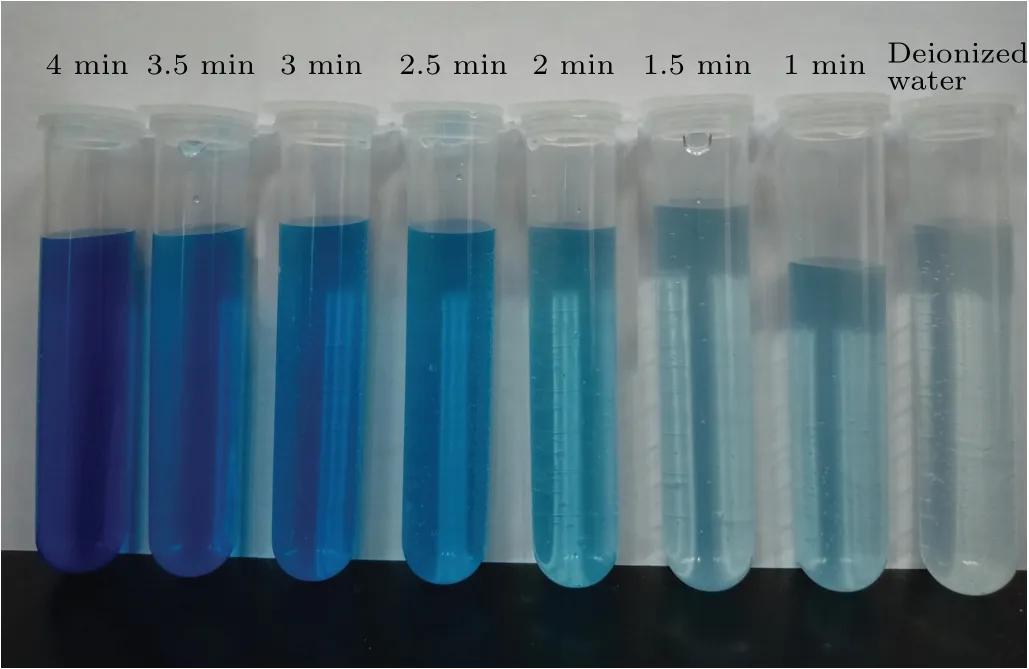
Fig.4. Photographic image of the results of the synergistic treatment of DMSO solution.
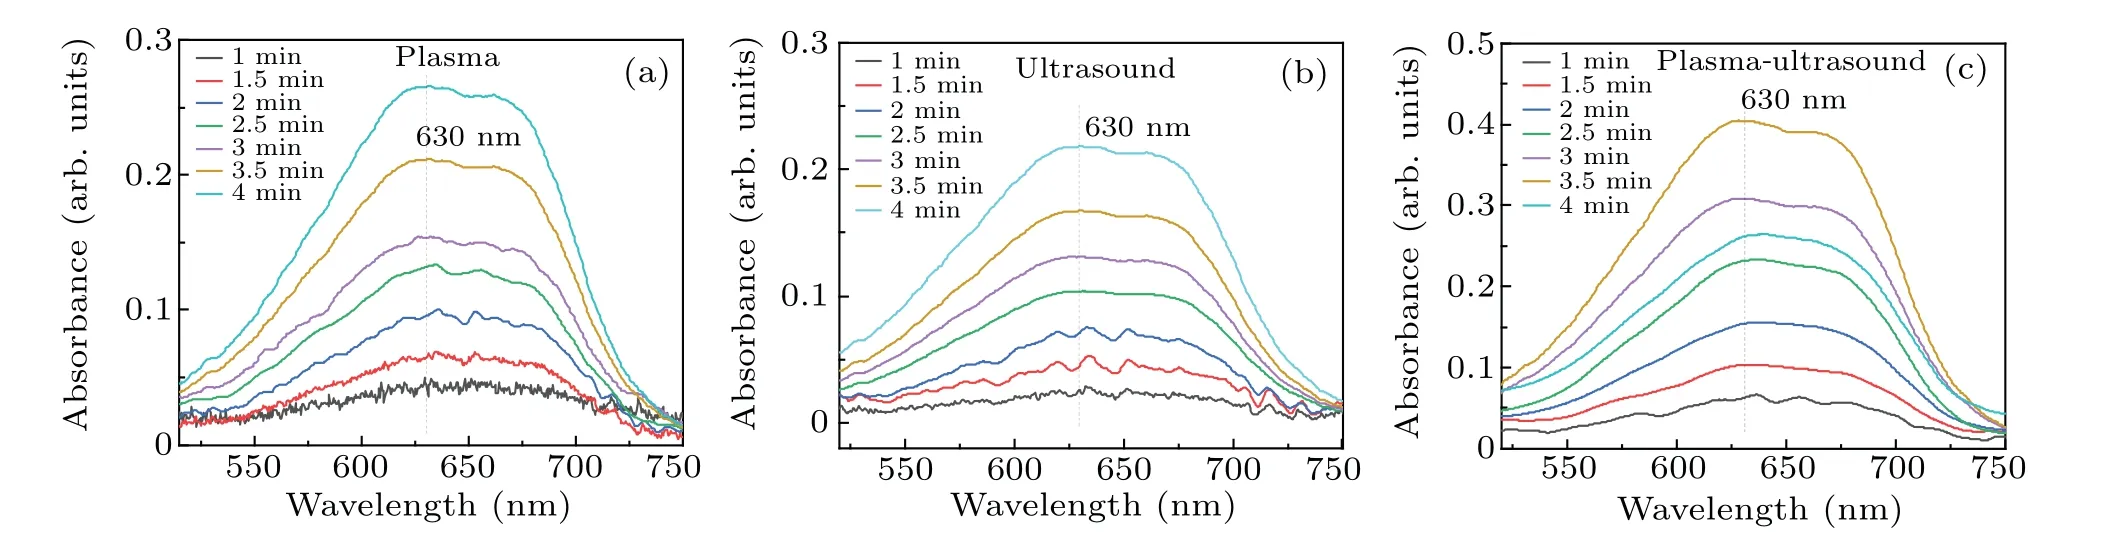
Fig.5. Absorbance of DMSO solution treated by the three different methods: (a)plasma electrolysis,(b)ultrasound,(c)both of these together.
As shown in Fig.6,the formaldehyde concentration was the highest for the DMSO solution treated by using the two methods,whereas ultrasound produced the smallest amount of formaldehyde. When plasma electrolysis and ultrasound were used separately to treat the DMSO solution, the formaldehyde concentration increased nearly linearly with time. Figure 6 also shows that the rate of increase in formaldehyde with plasma electrolysis differed from that with ultrasound.In 2 min, the formaldehyde concentration of the combined system was approximately equal to the sum of that produced by plasma electrolysis and ultrasonic treatment separately.From 2.5 to 4 minutes, the formaldehyde concentration of the two together was higher than the sum. For example, the formaldehyde concentration of the two together at 4 minutes was 64.16 μmol/L, and that of plasma electrolysis and ultrasound was, respectively, 30.11 μmol/L and 24.11 μmol/L,thus 64.16 μmol/L>30.11 μmol/L+24.11 μmol/L. Finally,as shown in Fig.6,the formaldehyde concentration in the later reaction stage of the synergy between the two combined techniques was significantly higher than the sum of the amounts of formaldehyde produced by using the techniques individually.
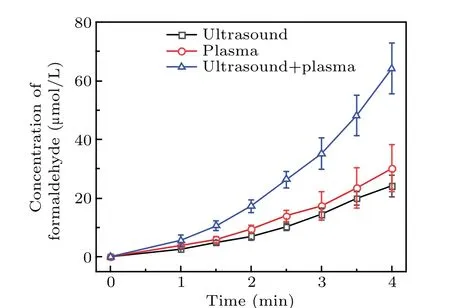
Fig. 6. Formaldehyde concentration of DMSO solution treated by plasma electrolysis,ultrasound,and both of the two techniques together.
The concentration of formic acid in the solution was analyzed by using a microplate reader,as shown in Fig.7. These results show that the formic acid concentration was significantly lower than that of formaldehyde. Initially, the formic acid concentration increased slowly and then increased more rapidly after 2 minutes.Figure 7 also shows that the increasing trend of formic acid was similar to that of formaldehyde.More specifically, the formic acid concentration increased linearly during the first 2 minutes,and the formic acid concentration as a result of the synergetic action of the combined methods was higher than the sum of the individual methods after 2-4 minutes. The concentration of the formic acid formed by using the methods synergistically for 4 minutes was 6.08 μmol/L,whereas that after plasma electrolysis and ultrasound was 2.42 and 2.02μmol/L,respectively. This trend was the same as for the formaldehyde.
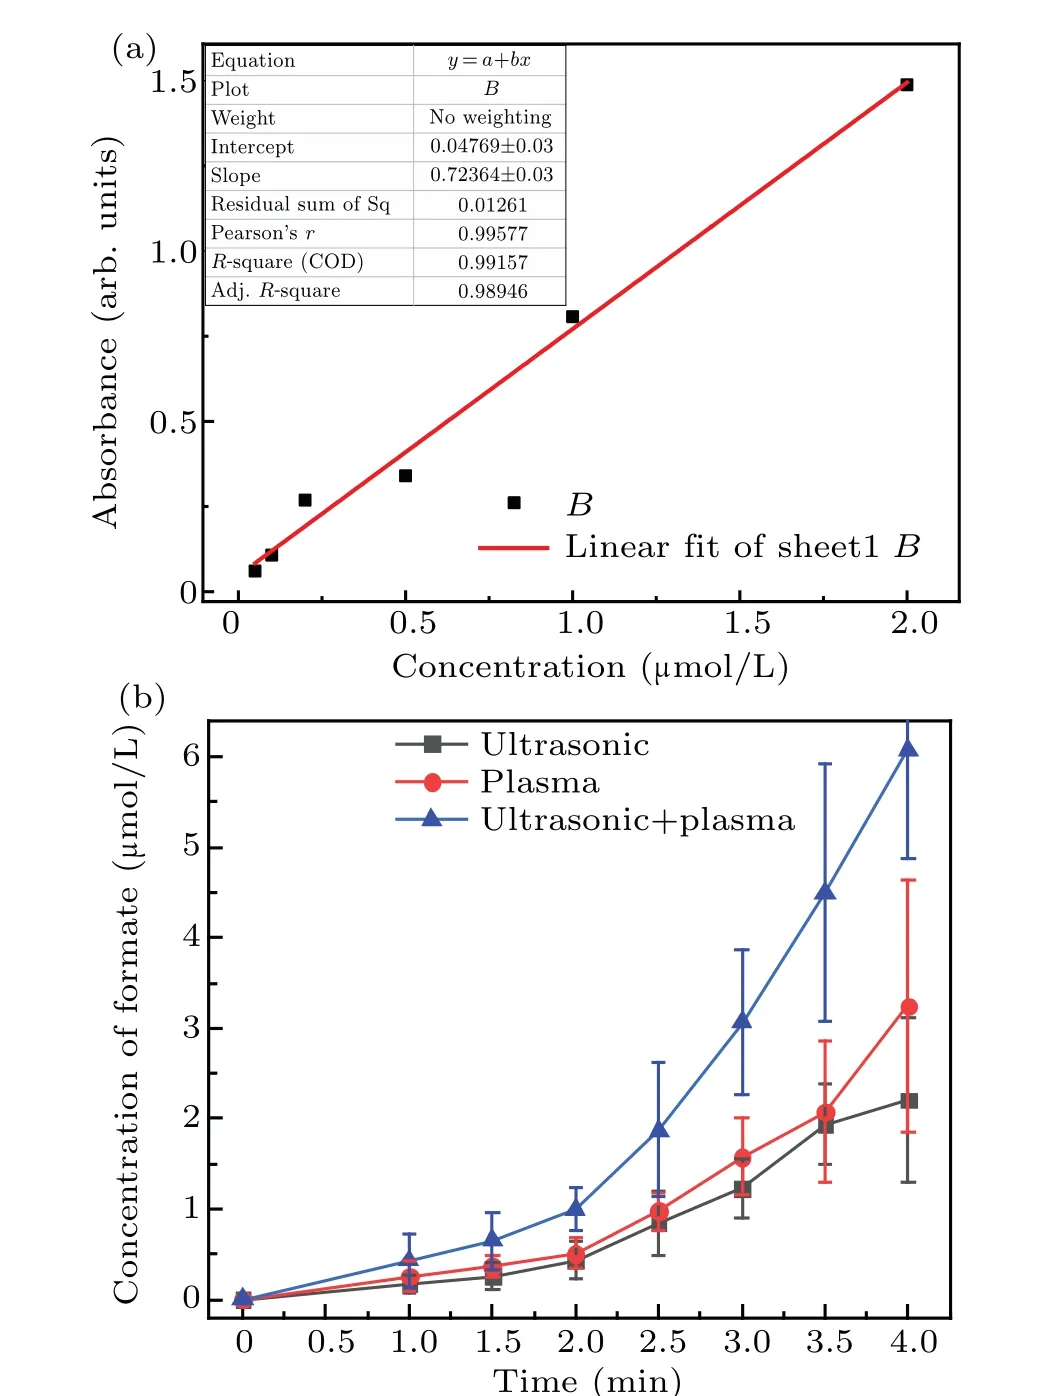
Fig.7. Linear fit of absorbance and concentration of formic acid standard solution(a)and change in the formic acid concentration over time for the three different techniques(b).
Based on the relationship between·OH radicals and formaldehyde and formic acid([·OH]=2[HCHO]+4[HCOOH]),the concentration of·OH radicals formed during the different treatments was calculated and the results are shown in Fig.8.
Figure 8 shows that the increase in the concentration of·OH radicals is the same as that of formaldehyde or formic acid,that is,the·OH radicals generated in 2 minutes increased linearly with time. The concentration of·OH radicals generated synergistically by the two methods was approximately equal to the sum of the·OH radicals produced by the two separately. After 2 minutes, the·OH radical concentration was greater than the sum of the concentrations resulting from that using the two techniques separately. For example, the·OH radical concentration at 2.5 minutes was 60.14 μmol/L,which is greater than the sum of that obtained by plasma electrolysis (31.76 μmol/L) and ultrasound (23.74 μmol/L) separately. This shows that the concentration of the·OH radicals increased linearly in the initial stage during which the two techniques were used together. After 2 minutes, the concentration of·OH radicals in the solution increased nonlinearly.This may have been caused by changes in the composition of the DMSO solution after the two treatments. Therefore,it was necessary to analyze the main components of the solution.
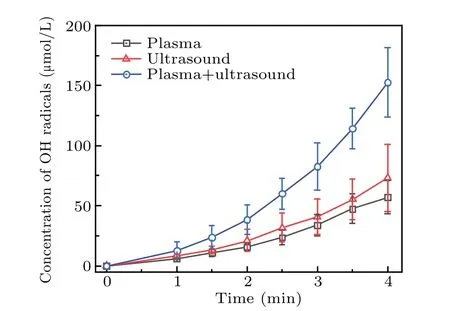
Fig.8. Change in the·OH radical concentration during treatment by the three different techniques.
The·OH radicals react with DMSO to generate methanol,formic acid, and formaldehyde. The·OH radicals in solution were converted to hydrogen peroxide,which changes the conductivity and pH of the solution, as shown in Figs. 9(a) and 9(b),respectively. Figure 9(a)shows that,after the DMSO solution was treated by the two methods synergistically,the pH value was the lowest. In addition,the concentration of hydrogen peroxide and formic acid in the solution was the highest,which is consistent with the results shown in Fig.8. The conductivity as a function of time is shown in Fig. 9(b), which shows that the conductivity initially increased linearly,and after 2.5 minutes,the increase became nonlinear. This is similar to the increase in the·OH concentration in Fig. 8, and indicates that an increase in conductivity is conducive to plasma electrolysis and the generation of·OH radicals, which corresponds to that reported by Chenet al.[29]The reverse also holds true, that is, an increase in the active species increases the conductivity of the solution.
Increases in conductivity led to changes in the discharge current. During the use of plasma electrolysis with ultrasound to treat a DMSO solution, the voltage and current were measured,as shown in Fig.10,which shows that,at constant voltage,the current changed significantly after 0.015 s(measurements started at 138 s). The results show that the intensity of the current did not change, but the density increased significantly, which indicates the transition of the discharge mode from the filament mode[30]to the spark discharge mode. The discharge current gradually stabilized after 0.04 s. The increased intensity between the two poles indicated that more gas participated in the discharge. The bubbles formed as a result of the occurrence of ultrasonic cavitation between the two poles and probably break down, thereby increasing the current. This seems to be the reason for the high concentration of·OH free radicals produced because of the synergy between the two techniques.
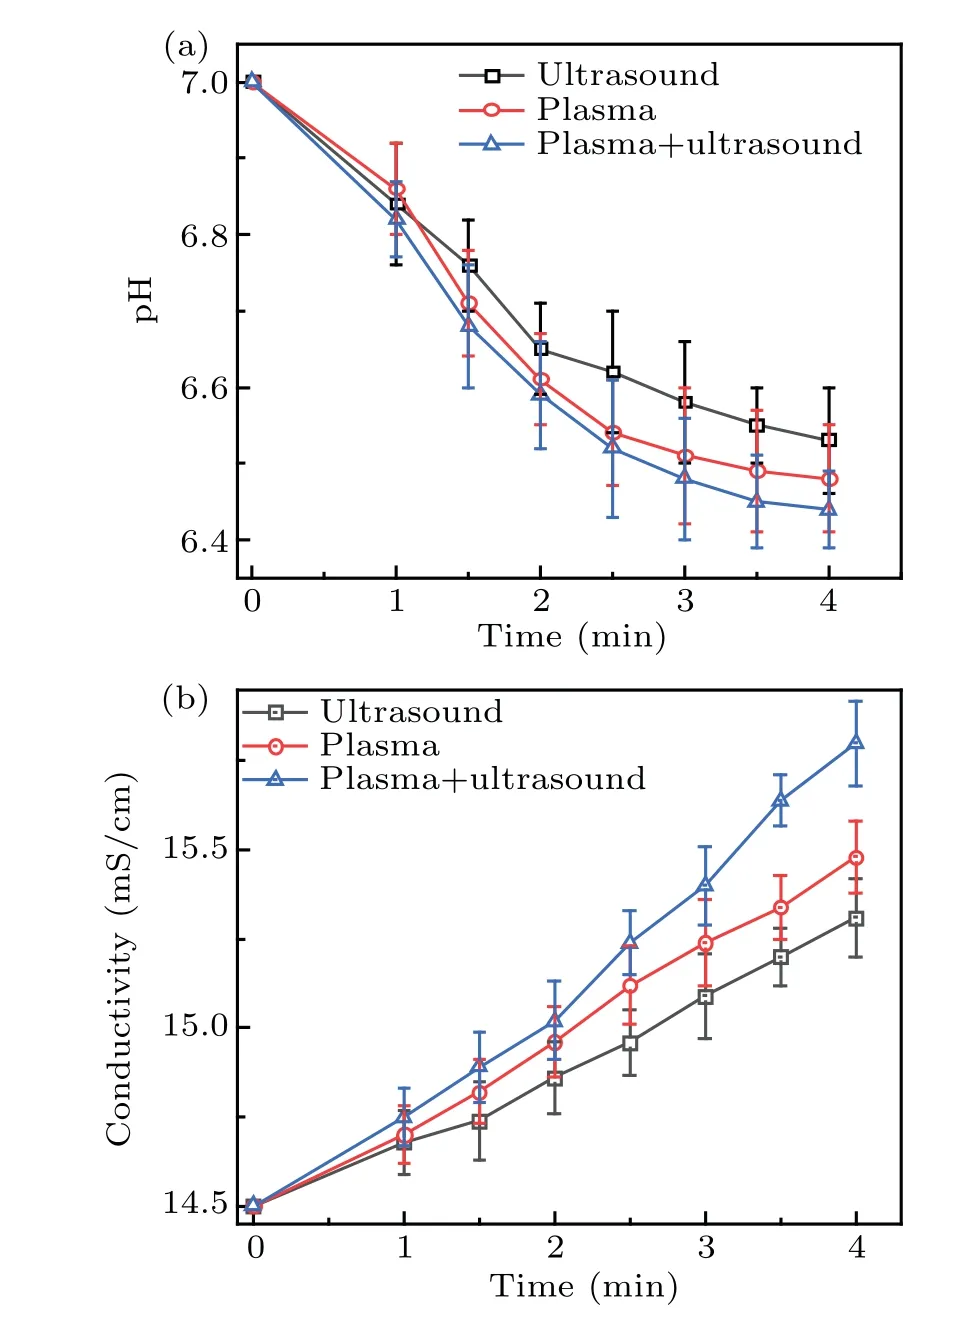
Fig. 9. Change in the pH and conductivity with time: (a) pH value,(b)conductivity.
When the discharge mode conversion occurs,the solution properties were observed with considerable changes, particularly concerning the temperature(increased by 25°C)and conductivity (increased to 15.4 mS/cm), compared to the initial ones. However,the solution pH only decreased slightly(from 7.0 to 6.52), indicating that the pH only has a limited role on affecting the mode conversion. To further verify the effect of temperature,the following investigation was conducted.
The solution was firstly heated to 45°C to confirm the above conclusions, and the DMSO solution was treated with plasma electrolysis and ultrasound. The results showed that the filament discharge was converted to spark discharge within 52 seconds,with the solution temperature of 58°C,the OH radical content of 48.6 μmol/L, and the conductivity of 14.84 mS/cm. It can be seen that the discharge mode is determined by both the solution temperature and conductivity.
The changes in the solution properties were caused by the mass transfer and diffusion of active species of plasma into the solution.The diffusion process of active species intensified the motion of water molecules, which increased the temperature of the solution. At the same time, the mass transfer of active species into the solution was also the generation of long-lived species in the solution. These long-lived species increased the conductivity of the solution greatly. Thus, the solution temperature and conductivity determined the discharge mode.
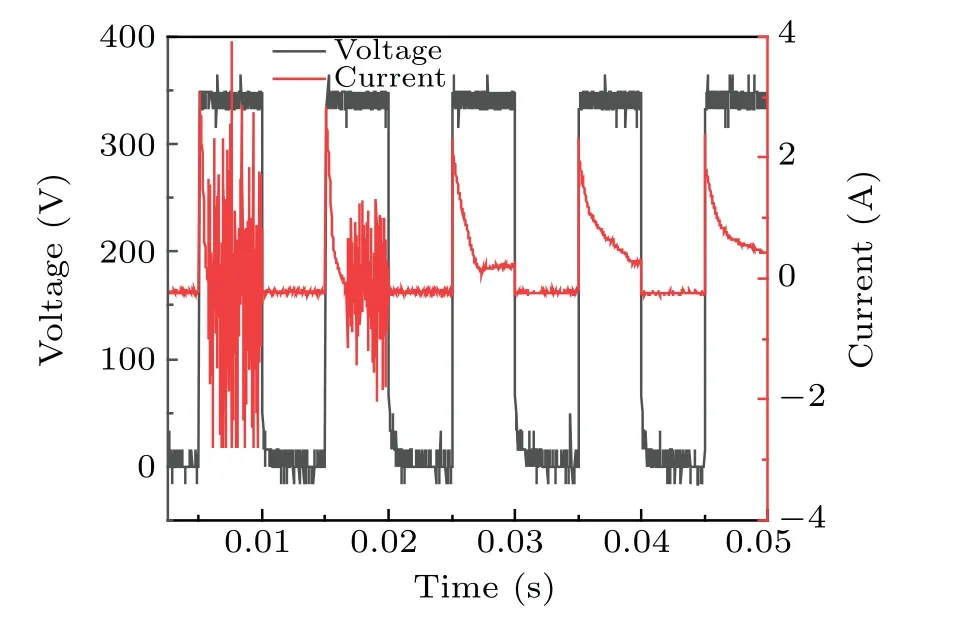
Fig.10. Voltage and current measurements during the combined treatment.
The emission spectra under different discharge modes are shown in Fig. 11. It can be seen that the species produced with the two discharge modes are almost the same, but the intensity of the spectrum is different. The spectrum contains emission lines of N2,OH,H,and W.The emission spectrum of nitrogen is caused by the dissolution of nitrogen in the water.The line of tungsten is emitted by the ionization of tungsten in the electrode. The OH radicals originate from the interaction of electrons and water molecules, and the H radicals originate from the interaction of H+and electrons near the anode (H++eaq→H). The stronger emission intensity of spark discharge indicates the higher production of active species.
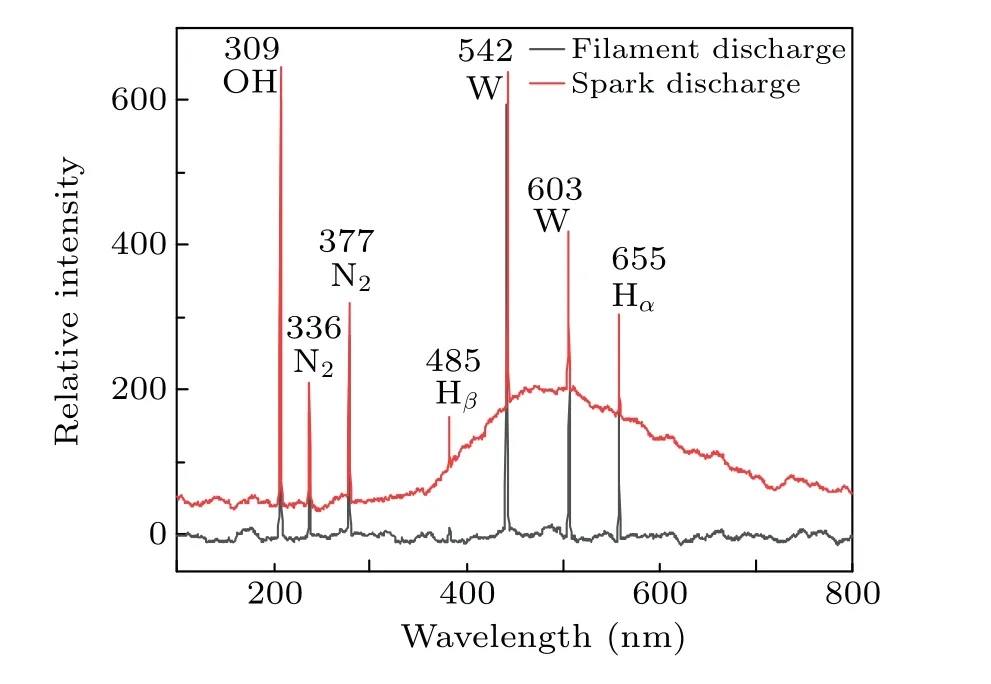
Fig.11. Emission spectra of filament and spark discharge.
In addition,it can be found that a wave packet appears at 460-900 nm from the spectrogram of the spark discharge.The spark discharge increases the background temperature,which will cause heat radiation. It can be seen that the breakdown discharge(spark discharge)can generate a large number of active species and heat, and rapidly increase the temperature of the solution and the content of active species. It is consistent with the experimental results.
3.2. Source of·OH radicals
Figure 12 also indicates that H2O2and·OH radicals are interconvertible(H2O2UV--→2OH).Since hydrogen peroxide is a long-lived particle,it can diffuse into the solution.Therefore,the·OH radical content was estimated by measuring the H2O2content. Since the discharge occurs at the cathode, the electrons and OH radicals generated by the discharge are also near the cathode(the cathode has the largest potential drop).[46,47]As the content of hydrogen peroxide near the cathode increases,it appears to be attributable to H2O2?H++HO-2and·HO2?·O2+H+in the advanced oxidation system. The experiment also showed that the pH value of the solution after 4 min of exposure to both of the two techniques simultaneously was 6.58 owing to the synergistic effect,that is,the solution had become weakly acidic. This is consistent with the experimental results.
Figure 12 also shows that the·OH radicals in the solution were mainly derived from H2O2aqand O3aq. Measuring the amount of the two species is very important for estimating the concentration of·OH radicals. Here,it was also considered to be useful to analyze the synergetic mechanism of plasma electrolysis with ultrasound. In the experiment,the concentrations of hydrogen peroxide, ozone, and oxygen in deionized water resulting from the synergy between the two techniques were measured,as shown in Table 1.

Fig.12. Chemical pathways for the short-lived species in aqueous solution.
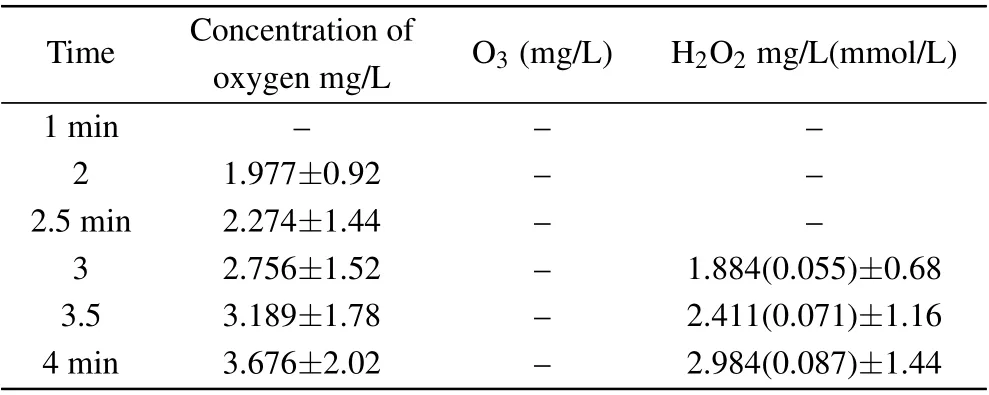
Table 1. Concentration of hydrogen peroxide, ozone, and oxygen resulting from the synergy between the two techniques(plasma electrolysis and ultrasound).
The results in Table 1 indicate that the oxygen content of the solution was mainly in the form of H2O2aq. Ozone was not detected in the experiment in which the concentrations of·OH radicals(0.152 mmol/L)and H2O2aq(0.087 mmol/L)were compared.Thus,there were less than twice as many·OH radicals as hydrogen peroxide molecules, which may be due to the low concentration of DMSO. This also shows that the·OH radicals were mainly derived from hydrogen peroxide, a finding that supports the results in the literature,[47]which,in turn,provides evidence for the rationality of our experimental results.
Without using an external gas supply and at a lower voltage, bubble(produced by ultrasonic cavitation)discharge between the two poles was realized. The synergy between the two techniques significantly increased the current density,which was conducive to the production of active species. Discovering the parameters of the discharge resulting from the synergism of the combined technique during the initial stage will be the focus of future research.
4. Conclusion
Plasma electrolysis, ultrasound, and plasma electrolysis combined with ultrasound were used to treat a dimethyl sulfoxide (DMSO) solution. By measuring the products (the formaldehyde and formic acid concentrations)of the reaction of·OH radicals with DMSO, the concentration of·OH radicals in the solution produced by using these three methods was obtained indirectly. The concentration of·OH radicals in the three solutions treated for 4 min by plasma electrolysis,ultrasound,and the combination of the two were 57.04μmol/L,73.12μmol/L,and 152.66μmol/L,respectively. The concentration of·OH radicals produced by the synergy between the two techniques exceeded the sum of the·OH radicals produced in separate plasma electrolysis and ultrasound treatments. After treatment by the three techniques, the pH and conductivity of the solution decreased. The conductivity increased from 14.5 before treatment to 15.8 mS/cm,an increasing trend similar to that of the·OH radicals. Experimental evidence showed that the current density increased as the conductivity increased. This increase in current density indicates that the discharge modes changed from filament discharge mode to spark discharge mode. The bubbles between the two electrodes(generated by ultrasonic cavitation)were broken down and discharged, generating additional species. To verify the rationality of the measurement results, we analyzed the mass transfer path of oxygen-containing free radicals based on the reaction coefficients and found that the·OH free radicals in the aqueous solution were mainly derived from hydrogen peroxide. The experimental results showed that the concentration of hydrogen peroxide was 0.087 mmol/L, approximately 1/2 of the·OH radical concentration, which demonstrates the rationality of the experiment. The new method can greatly increase ROS production and has potential for practical application in materials engineering and pollutant processing.
Acknowledgements
Project supported by the National Natural Science Foundation of China (Grant Nos. 51877184 and 11474305) and the National Science and Technology Major Project of China(Grant No. 2011ZX05032-003-003). Rhoda E. and Edmund F.Perozzi,PhDs,greatly assisted with the content and English editing.
猜你喜歡
臺港文學(xué)選刊(2022年3期)2022-06-13 00:50:24
房地產(chǎn)導(dǎo)刊(2021年6期)2021-07-22 09:12:06
Chinese Physics B(2021年3期)2021-03-19 03:21:18
吉林大學(xué)學(xué)報(理學(xué)版)(2020年4期)2020-07-17 14:29:14
吉林大學(xué)學(xué)報(理學(xué)版)(2019年6期)2019-11-28 11:38:36
東北師大學(xué)報(自然科學(xué)版)(2018年2期)2018-06-27 07:51:34
海南熱帶海洋學(xué)院學(xué)報(2016年5期)2016-12-06 05:08:37
山東社會科學(xué)(2015年5期)2015-06-05 14:34:58
哈爾濱師范大學(xué)自然科學(xué)學(xué)報(2015年2期)2015-04-19 02:06:27
哈爾濱理工大學(xué)學(xué)報(2014年4期)2015-01-04 13:51:44

- Chinese Physics B的其它文章
- Helium bubble formation and evolution in NiMo-Y2O3 alloy under He ion irradiation
- Dynamics and intermittent stochastic stabilization of a rumor spreading model with guidance mechanism in heterogeneous network
- Spectroscopy and scattering matrices with nitrogen atom:Rydberg states and optical oscillator strengths
- Low-overhead fault-tolerant error correction scheme based on quantum stabilizer codes
- Transmembrane transport of multicomponent liposome-nanoparticles into giant vesicles
- Molecular dynamics simulations of A-DNA in bivalent metal ions salt solution