
Genome-wide prediction in a hybrid maize population adapted to Northwest China
2020-10-21 10:02:14GuolingLiYunDongYushengZhoXiokngTinToisrshumJiqunXueShojingChenJohenReifShutuXuWenxinLiu
The Crop Journal 2020年5期
Guoling Li,Yun Dong,Yusheng Zho,Xiokng Tin,Tois Würshum,Jiqun Xue,Shojing Chen,Johen C.Reif,*,Shutu Xu,*,Wenxin Liu,*
aNational Maize Improvement Center of China,Key Laboratory of Crop Heterosis and Utilization(MOE),China Agricultural University,Beijing 100193,China
bKey Laboratory of Biology and Genetic Improvement of Maize in Arid Area of Northwest Region(Ministry of Agriculture),College of Agronomy,Northwest A&F University,Yangling 712100,Shaanxi,China
cDepartment of Breeding Research,Leibniz Institute of Plant Genetics and Crop Plant Research(IPK),06466 Stadt Seeland,Germany
dInstitute of Plant Breeding,Seed Science and Population Genetics,University of Hohenheim,70599 Stuttgart,Germany
ABSTRACT
1.Introduction
Increasing maize(Zea mays L.)yield is one of the most important global challenges to provide a growing human population with the necessary food,feed,and fuel[1].A promising approach to boost maize yield is to exploit genomics-assisted breeding which is facilitated by recent innovations in sequencing and genotyping technologies[2–5].In maize,two genomics-assisted breeding approaches are used,whose superiority depends on the complexity of the target traits.Traits that are controlled by a few genes,each of which makes a major contribution to the phenotypic variation,are efficiently improved by the application of markerassisted selection.Here,diagnostic markers are used to predict the performance of non-phenotyped but genotyped individuals[6–8].In contrast,complex traits are better targeted by genome-wide prediction[2,9].In genome-wide prediction,it is assumed that a large number of loci,each with a small effect on the trait,contribute to phenotypic variation[10–12].One challenge of genome-wide prediction is to estimate the effects of a large number of genome-wide markers precisely by choosing a proper biometrical model.
Since the emergence of genome-based prediction,several genomic prediction methods have been developed,including parametric and nonparametric regression[5].In parametric regression,the genomic best linear unbiased prediction(GBLUP)[2,13],ridge regression(RR)BLUP[2,14,15],least absolute shrinkage and selector operator(LASSO)[16,17]and elastic net(EN)[18]are based on the frequentist approach.In contrast,reproducing kernels Hilbert spaces(RKHS)regression[19,20],Bayesian ridge regression,Bayesian LASSO,Bayes A,Bayes B,and Bayes C[21,22]are based on the Bayesian approach.Moreover,nonparametric approaches have been suggested for genome-wide prediction based on machine learning techniques such as random forest[23–25],support vector machine[26,27],and neural networks[28].
Some traits are controlled by a few loci with large effect and a large number of loci that have only a small effect on the phenotypic variation[29].It has been shown that in this case certain biometric models could close the gap between markerassisted and genome-wide selection[30].Such approaches are either based on fixed marker effects for the large-effect loci[29]or use locus-specific shrinkage parameters in the standard RRBLUP model[13,30].
Hybrids are the dominant variety type in maize,and the prediction of their performance is of paramount importance[31–33].Hybrid performance depends not only on additive but also on non-additive effects such as dominance or all types of epistatic interactions involving additive and dominance effects[11,34–36].Prediction models with non-additive effects are widely used in hybrid breeding studies[36,37].Contrasting results have been reported,indicating benefits[35,38–43]but also disadvantages[11,37,44–47]when modelling non-additive effects in genome-wide hybrid prediction.For example,for a maize F2:3population there was no significant improvement by integrating non-additive effects in the GBLUP model for the trait plant height,but a remarkable increase for grain yield[43].Thus,the most successful genome-wide prediction models have to be determined for each trait and population.
Our study is based on genotypic and phenotypic data of 490 experimental maize single-cross hybrids derived from crosses between 30 and 89 inbred lines of the Shaan A and Shaan B heterotic group,respectively.The objectives of this study were to(1)evaluate the potential of genome-wide prediction for identifying superior single-cross combinations,(2)assess the effects of dominance and epistasis on the prediction ability,and(3)compare the potential and limits of trait-specific SNPs included as fixed and random effect in the prediction model.
2.Materials and methods
2.1.Plant materials and field trials
In this study 119 diverse inbred lines were chosen,of which 30 inbred lines belonged to the Shaan A group and the remaining 89 lines belonged to the Shaan B group[48].Then 486 single-cross hybrids were constructed between the two groups of lines.In addition,four commercial hybrids including‘Zhengdan 958’were selected as checks,so that totally 490 hybrids were evaluated in field trials at two locations:Yangling(34°16′N,108°40′E)and Yulin(38°30′N,109°77′E),Shaanxi,China,in 2017.At each location,all hybrid combinations were planted in four-row plots using an incomplete block design with two replications(Fig.S1),with a row length of 5.0 m and a space of 0.6 m between adjacent rows.The planting density was 90,000 plants ha-1.Field management followed the best local practice.
The following traits were assessed:grain yield(GY,Mg ha-1),grain moisture(GM,%),plant height(PH,cm),ear height(EH,cm),ear leaf length(ELL,cm),ear leaf width(ELW,cm),ear leaf area(ELA,cm2),rind penetrometer resistance of the third internode above ground(RPR_TIAG,N mm-2),rind penetrometer resistance of the first internode under the ear(RPR_IUE,N mm-2),and tassel branch number(TBN).Grain yield was adjusted to a 14%moisture content.GM was the grain moisture content at harvest.Plant height was measured from ground to the tip of the main inflorescence,and ear height was measured from the ground to the node of the primary ear.Ear leaf length was measured as the distance from the base to the tip of the leaf on the primary ear at or near flowering time.Ear leaf width was measured as the width of the widest section of the same leaf.Ear leaf area was calculated as 75%of the product of ear leaf length times ear leaf width.Rind penetrometer resistance was measured by the portable stalk strength pressure test instrument YYD-1.
2.2.Phenotypic data analyses
We estimated variance components and adjusted entry means following established procedures[35].After outlier tests[49],we estimated the genetic variance components,as well as the variance of genotype×environment interactions by fitting the following one-step linear mixed model:

2.3.Genotyping
Among the 119 diverse inbred lines,113 inbred lines including 25 form Shaan A and 88 from Shaan B,were genotyped using the tGBS(tunable genotyping by sequencing)protocols following Data2Bio[52],as previously described in detail[48].Briefly,299,598,955 raw reads were screened,trimmed and aligned to GenomeB73_RefGenV4;48,415 SNPs with minimum calling rate>50%were called for the whole panel of maize inbred lines.Finally,47,458 SNPs that were polymorphic for 113 inbred lines,were imputed using the Beagle 4.1 software[53],and used for the subsequent analysis.Minor allele frequency(MAF),heterozygosity(Het),allelic diversity(Div),and polymorphic information content(PIC)[54]were calculated using R[55].Finally,442 hybrids were available with both genotypic and phenotypic data including crosses between 25 Shaan A and 88 Shaan B lines.The genomic profiles of the 442 single-cross hybrids were deduced using the genotype of the parental lines based on the mating design(Fig.S1).Detailed information on the 442 hybrid combinations is provided in additional Table S1.
2.4.Analyses of population structure
The genetic distances(GD)among the 113 parental lines were estimated as 1 minus the identity-by-state similarity using 47,458 SNPs in TASSEL version 5.2.53[56].This GD matrix was illustrated using the R function heatmap.2 in the R package gplots[55].The neighbor-joining(NJ)method was used to construct phylogenetic trees based on the GD matrix[57].Principal component analysis(PCA)for parental lines and hybrids was performed using the prcomp function in R.
2.5.Genome-wide prediction
2.5.1.Additive model
As that the performance of the prediction ability varies between different approaches and breeding population,we compared eight different statistical prediction models considering additive effects for all ten traits.The parametric models used were RR,EN,LASSO,Bayes B,Bayes C and RKHS approach,and the non-parametric models comprised random forest(RF)and support vector machine(SVM).The model of RR,EN,and LASSO were implemented using the R package‘glmnet’with lambda parameters optimized via ten-fold cross validation.The glmnet function fit a generalized linear model by way of penalized maximum likelihood,in which alpha is the elasticnet mixing parameter,alpha=1 is the LASSO penalty,alpha=0 the Ridge penalty and 0<alpha<1 the EN[16].In Bayes B and Bayes C models using finite-mixture priors,marker effects are assigned independently identically distribution priors that are mixtures of a point of mass at 0 and the rest is either a scaled t-density(Bayes B)or normal(Bayes C)[22].RKHS are using Gaussian processes with arbitrarily user-defined co-variance structures,that allow implementing various genomic relationships in regressions.Bayes B,Bayes C,and RKHS were implemented using the R package‘BGLR’[22].The Gibbs sampling process of the Bayes approaches was repeated 10,000 times,by discarding the first 2000 results that were used as burn-in.For RF prediction,we applied the R package‘randomForest’[23].Grid search with Ntree=200,500,1000 and mtry=500,1000,5000 via ten times five-fold cross validation was tested for optimizing hyperparameters in the randomForest function.Finally,we used the metric of‘Rsquared’to determine the parameter as Ntree=500,mtry=5000 and nodesize=40.Following various recommendations[27,58],we implemented the SVM regression using the ksvm function in the R package‘kernlab’with epsilon-regression(eps-svr)as the type and radial basis kernel‘Gaussian’(rbfdot)as the kernel function.
2.5.2.Additive and non-additive model
2.5.3.Additive and dominance models including trait-specific SNPs
None of the above models specifically emphasized the importance of trait-specific markers.However,for some phenotypes,trait specific markers may contribute to the accuracy of prediction[8,29,30].Therefore,the A+D RKHS model was further extended to give special weight to traitspecific markers.The markers were selected by genome wide association analysis in the training population and considered in genome-wide prediction using two approaches:The trait-specific markers were considered as fixed effects[29];alternatively,the specific markers were modelled as random effects through a kernel[30].The association mapping was performed using a linear mixed model correcting for population stratification and genetic relationships as implemented in the R package‘rrBLUP’[15].The first 10 principal components from PCA were used to capture major population stratification by setting the arguments n.PC=10 in the GWAS function.The kinship matrix was calculated using the A.mat function in‘rrBLUP’.The trait-specific SNP sets(tsSNPs)were selected according to the score–log10(P)of SNPs or the phenotypic variation explained(PVE)by SNPs in marker-trait association analysis based on training data:tsSNPsI,the SNP set with score>4.02(-log10(0.1/1053)),was considered as fixed effect,in which 1053 is the number of independent markers based on PCA analysis[59]applying Bonferroni correction for multiple testing;tsSNPsII,the SNP set with PVE>10%,was considered as fixed effect;tsSNPsIII,the SNP set of score>3 was modelled as random effect;tsSNPsIV,the top 10 most significant SNP,was modelled as random effect.In addition,we also tested the influence of top SNP gradient change on the accuracy of prediction when the top SNP were modelled as fixed effect or random effect.
We applied five-fold cross validation to evaluate the ability of genome-wide prediction in this breeding program.In each cross validation,80% of the hybrids(353)were randomly sampled as training set and the remaining 20%of hybrids(89)were used as test set.The cross validation was repeated 500 times and the prediction ability was estimated as the Pearson correlation coefficient between the observed and the predicted phenotypic values.
2.5.4.Selection differential to select superior hybrids
We used all 442 hybrids as a training set and predicted the hybrid performance of all possible 6328 single-cross combinations between the 113 parent inbred lines based on the A+D RKHS model with 60,000 Gibbs samplings discarding the first 6000 results,which were used as burn-in.Based on the predicted phenotypic values,we calculated the selection differential as the difference between the mean of the selected hybrids and the performance of Zhengdan 958,which is an important commercial hybrid variety in China.All traits were positively selected except grain moisture.When the same number of superior combinations was selected,we compared the gain achieved by selection based on 442 hybrids with that based on 6328 singlecross combinations.
3.Results
3.1.Extensive phenotypic variation observed in field trials
The population of hybrids yielded on average 9.95 Mg ha-1with a range from 6.89 to 12.50 Mg ha-1(Table 1;Fig.S2).The other nine traits also showed a wide phenotypic variation.Positive correlations of grain yield with the others traits were highly significant(P<0.001),except for tassel branch number(Fig.1).Moreover,traits determining the plant architecture were tightly correlated(Fig.S3).
3.2.Genetically distinct subpopulations
The panel of inbred lines was genotyped using the simplified tGBS sequencing technology[48].The resulting 47,458 SNPs showed a moderate average MAF of 0.16,an allelic Div of 0.23,a PIC of 0.19,and a Het of 0.08(Fig.S4).We assessed the population structure and constructed a NJ phylogenetic tree based on the genetic distance matrix among all pairs of inbred lines and performed a principal component analysis(Fig.2).The analyses revealed that with a few exceptions,parental lines clustered according to the heterotic groups Shaan A and Shaan B.This separation was further supported by the distribution of genetic distances,which revealed higher values between heterotic groups(0.235)compared with the total population(0.228)(Fig.S5).The genetic distance between the two parents of a hybrid was found to show significant correlations with the hybrid performance for all agronomic traits except grain moisture and ear leaf width(Fig.S6).
The genetic relationships among the 442 hybrids evaluated by principal component analysis revealed the presence of several subpopulations(Fig.S7).The hybrids involving male parents of A008,A009,A019,and A021 were clearly distinguished from the other hybrids.In addition,hybrids including B110 and B137 as parents clustered separately from the hybrids involving B018,B031,and B054.Summarizing,we observed apparent subpopulations both in the parental lines and in the established single-cross hybrids.
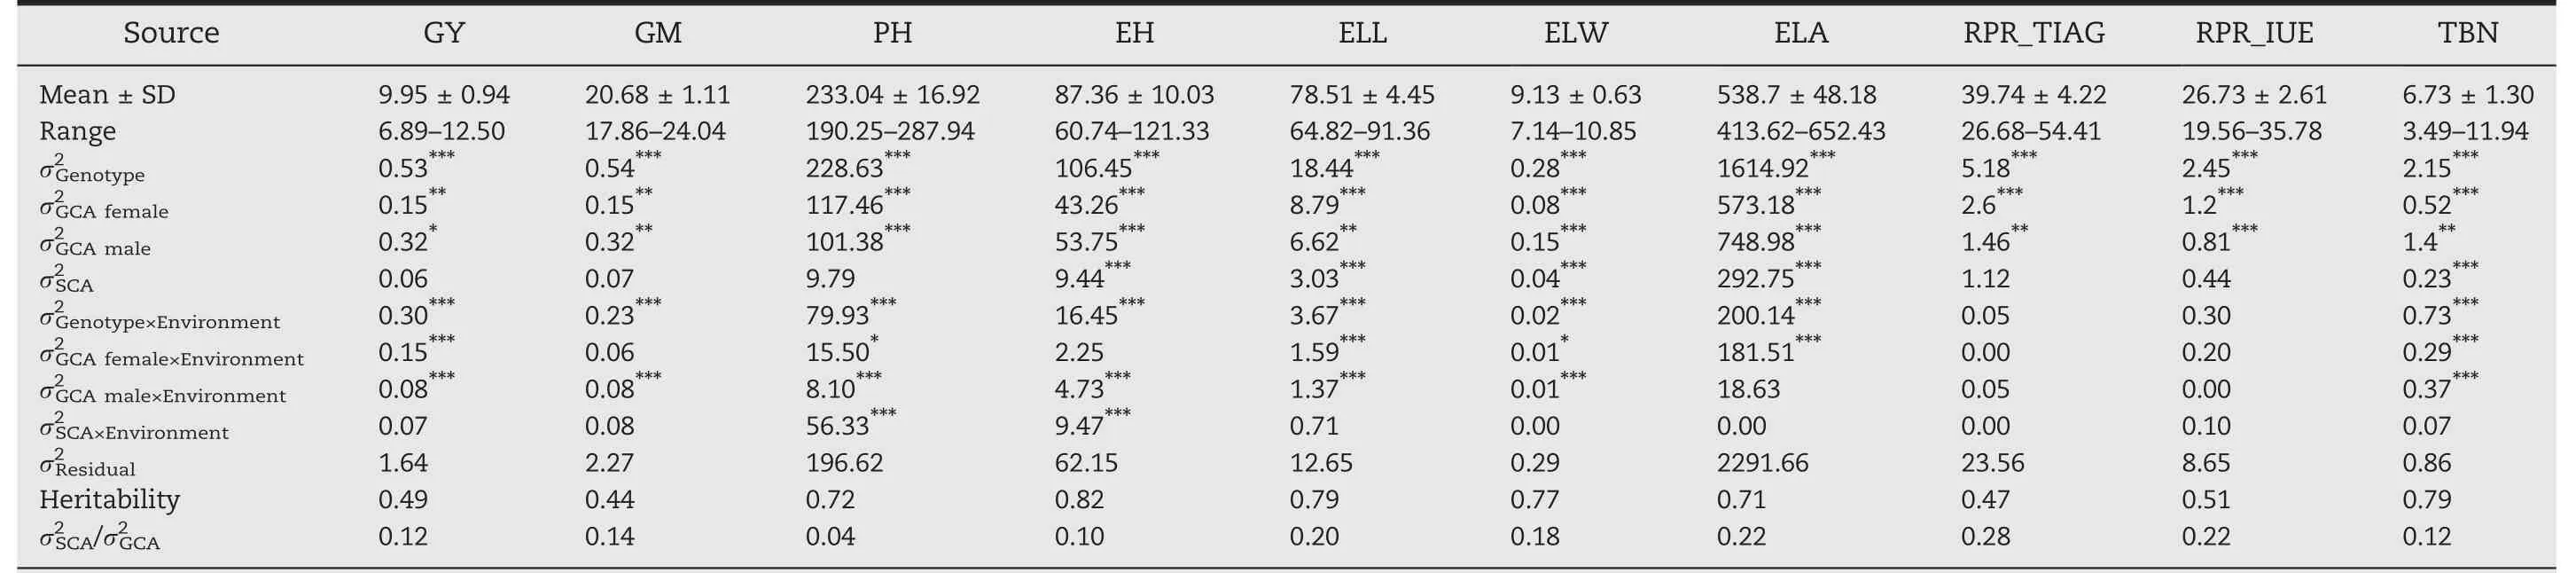
Table 1–Phenotype variation and broad-sense heritability of ten agronom ic traits in 490 hybrids across two environments.
3.3.Performance of genome-wide prediction models based on additive effects
The accuracies of eight different genome-wide prediction models relying on additive effects were compared by using five-fold cross validation(Table 2;Fig.S8).The average prediction ability ranged between 0.386 and 0.794 across traits and models.For each trait,we observed similar prediction abilities for the six parametric methods and slightly lower prediction abilities for the two non-parametric models,RF and SVM.One exception was observed for the trait rind penetrometer resistance,for which EN and LASSO showed a substantially lower(~0.037)prediction ability than other parametric methods(Fig.S8).It is worth noting that the two non-parametric methods predict the trait rind penetrometer resistance of the third internode above ground(RPR_TIAG)even better than the parametric methods,especially RF.In general,RR and RKHS performed best of the eight prediction methods.Consequently,the extension of the model to incorporate non-additive effects was based on the RKHS model.
3.4.Adding dominance and epistatic effects to the model with additive effects did not improve the prediction ability
For genome-wide prediction in a hybrid population,it is of interest to consider besides additive also non-additive effects such as dominance and epistatic interactions involving additive and dominance effects.Interestingly,the prediction abilities of A+D RKHS and A+D+E RKHS for grain yield,grain moisture,plant height,ear height,and rind penetrometer resistance(IUE)were slightly lower compared to A RKHS(Table 2;Fig.3).For TIAG,A+D and A+D+E RKHS yielded higher prediction abilities than A RKHS with an increase of 1.5% and 1.6%,respectively.For the traits ear leaf length,ear leaf width,ear leaf area,and tassel branch number,the three genetic models showed only marginal differences in the prediction abilities of around 0.009.
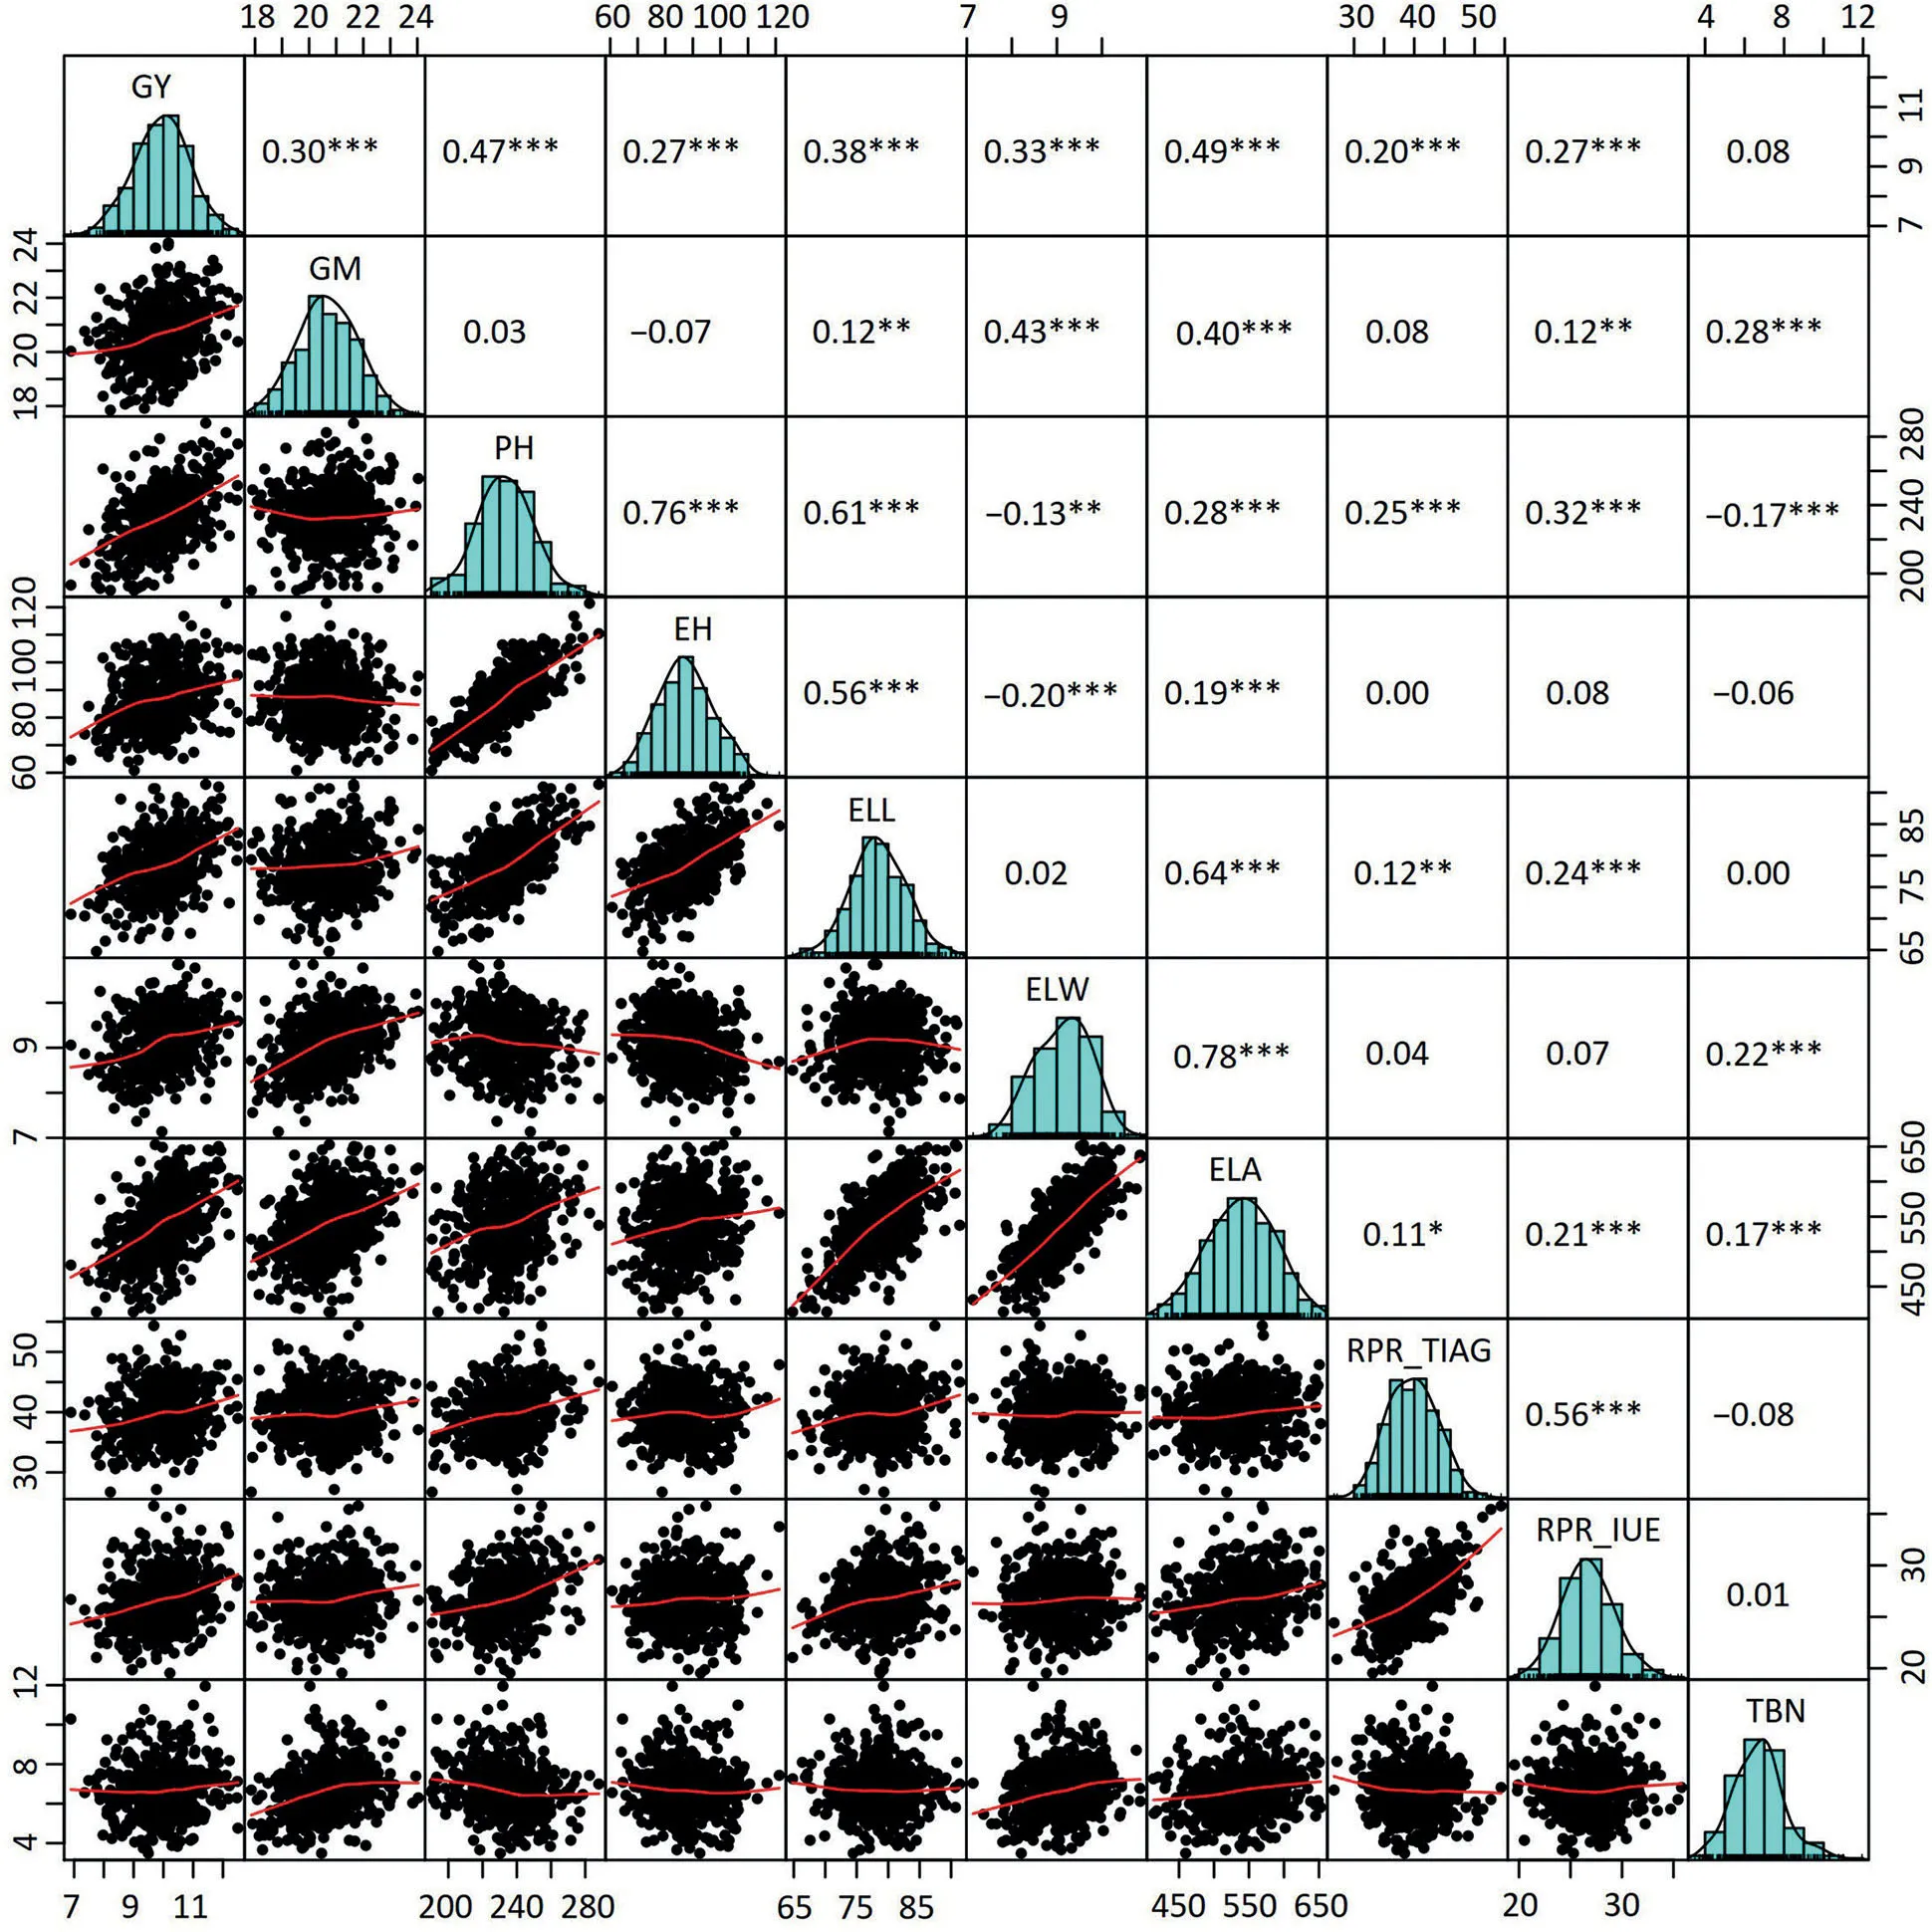
Fig.1–Pairwise correlations among the10 traits based onthe bestlinear unbiased estimations(BLUEs)of 490 single-cross combinations.The numbers with one or more star(s represent the Pearsoncorrelation coefficientsat differentsignificances.*,**,and***,significant at the 0.05,0.01,and 0.001 probability levels,respectively.
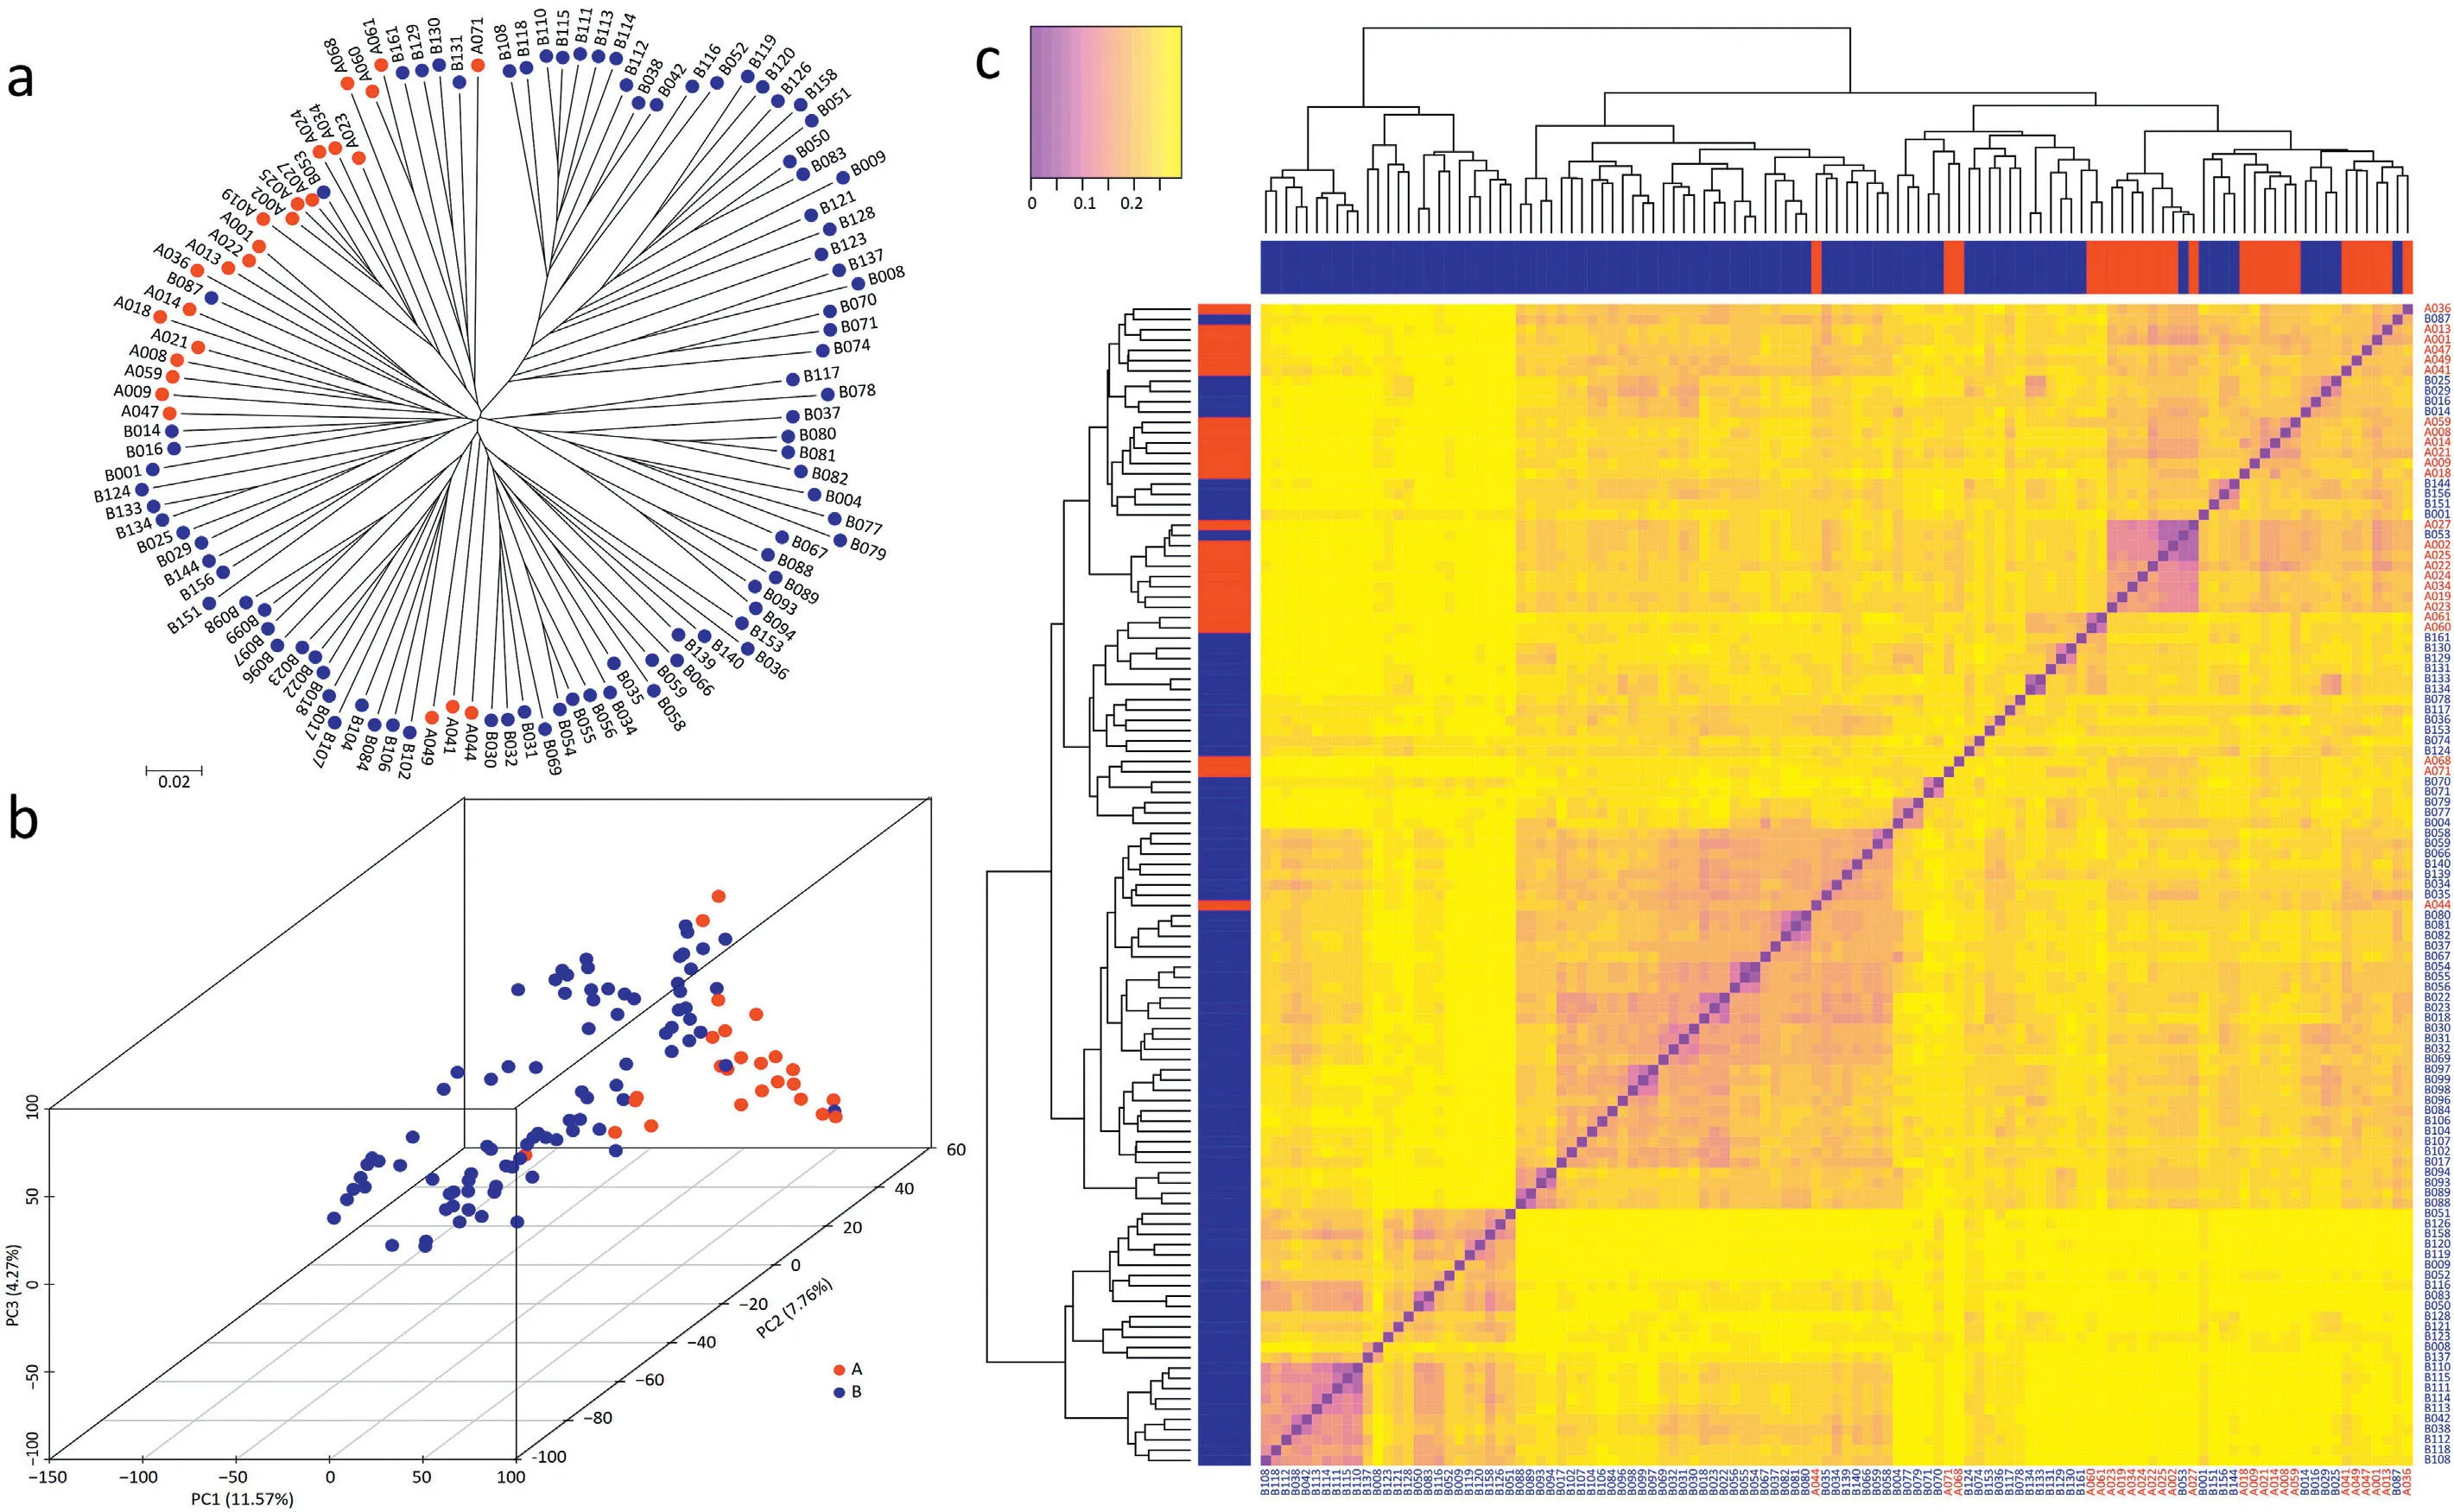
Fig.2–Genetic relationships among the 113 parental inbred lines.(a)Neighbor joining tree based on the genetic distances among 113 lines genotyped by 47,458 SNP markers.(b Principal coordinate analysis illustrating the population structure.(c)Cluster dendrogram and heat m ap showing all pairwise genetic distances.Lines from the Shaan A group are indicated in red,and lines from the Shaan B group in blue.
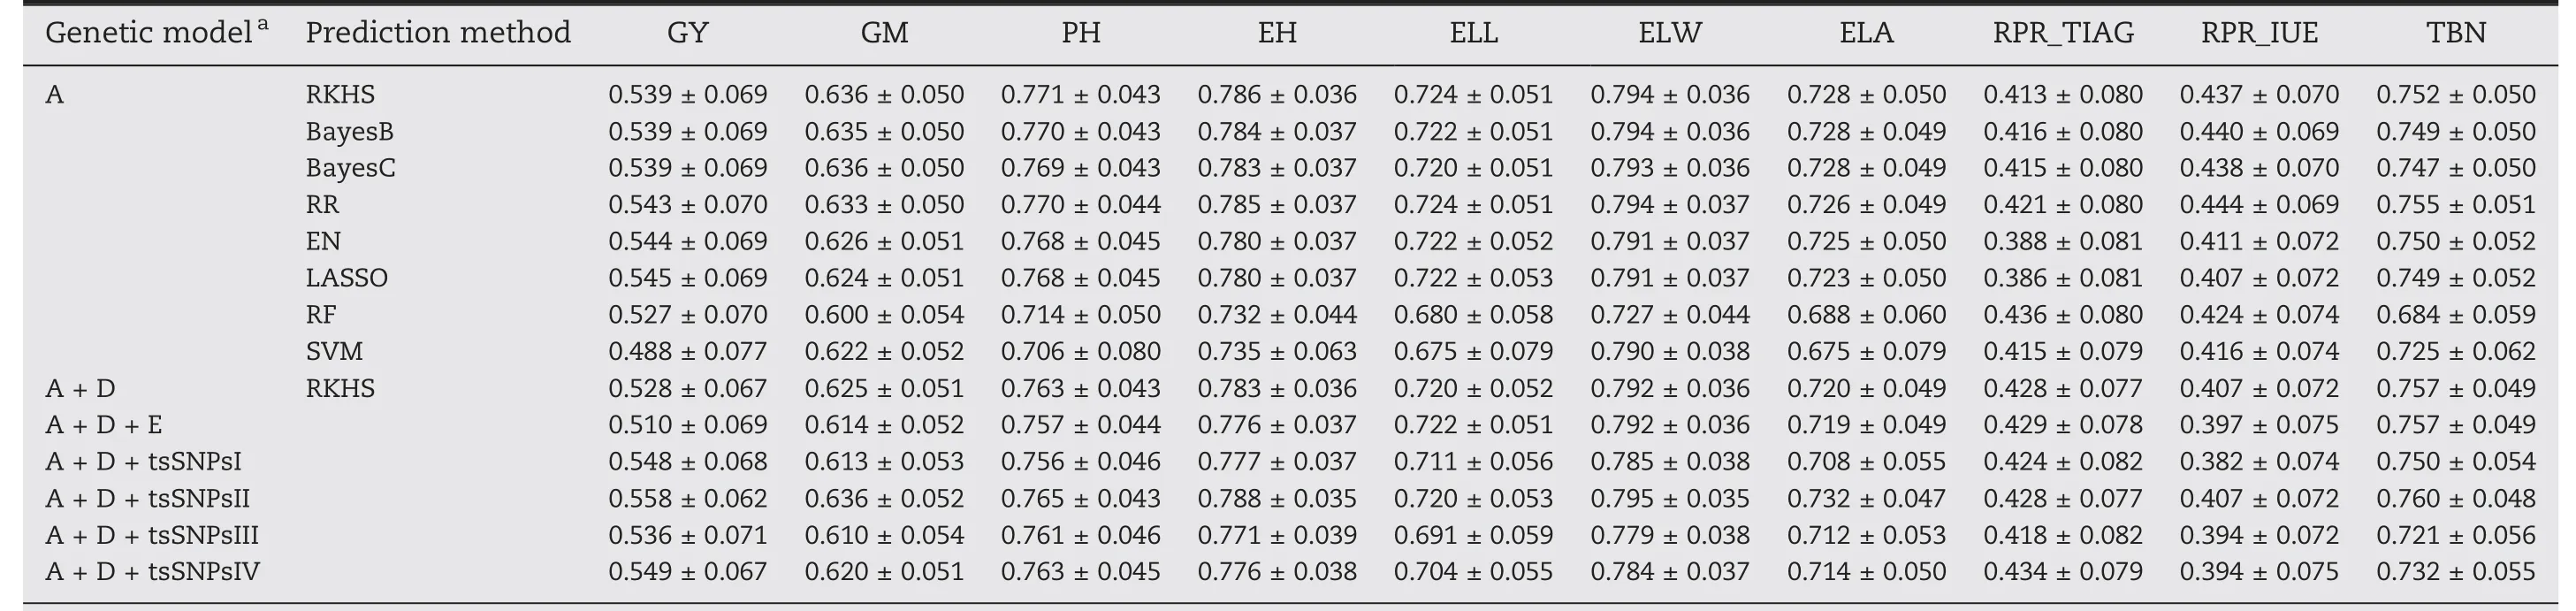
Table 2–Average and standard deviation of prediction ability of 10 traits for 8 genom e-wide prediction m ethods with different genetic effects.
3.5.The potential of trait-specific SNPs in genome-wide prediction
We investigated the potential to increase the prediction ability by considering four approaches to model trait-specific SNPs(tsSNPs).Across all four approaches,scenario tsSNPsII,i.e.,selecting SNPs based on the variance they explain,performed best and for example increased the prediction ability for grain yield by 3%(Table 2;Fig.3).Furthermore,we investigated the effect of the number of tsSNPs on the prediction ability.Comparisons were made for all traits with different numbers of tsSNPs:the 1,2,3,4,5,10,or 20 SNPs with the lowest P-value from association mapping were included as fixed effects and the 10,30,50,70,100,200,300,500,700,1000,2000,5000,or 10,000 most strongly associated SNPs were modelled as random effects.For the scenarios with fixed effects,prediction abilities decreased slightly when the number of SNPs increased(Fig.S9),while the scenarios with random effects profited from either a harsh selection or relaxed selection of SNPs(Fig.S10).It is important to note that the prediction ability never exceeded that of the tsSNPsII scenario.
3.6.Genome-wide selection is more effective than conventional selection
We trained a genome-wide prediction model using all 442 phenotyped hybrids and predicted the performance of all possible 6328 single-cross hybrids.These data served to compare the selection gain in the population of 442(Scenario 1)versus the 6328 hybrids(Scenario 2).When the same number of superior combinations(10%,44/442)were selected,the selection differential of Scenario 1 was 0.21 Mg ha-1for grain yield,while that of Scenario 2 amounted to 0.59 Mg ha-1(Table S2;Fig.4).Moreover,the selection differential in Scenario 2 was higher compared to that of Scenario 1 for all other traits except grain moisture.
3.7.Additional 34 excellent single-cross combinations were identified
Based on the predicted performance of the 6328 singlecross hybrids,we identified 44 promising high-yielding combinations(Fig.4;Table S3),which could lead to a 6%increase in grain yield compared to the commercial hybrid variety Zhengdan 958.Among these,10 combinations were already evaluated(Table S4),but we also identified 34 novel hybrids that have not yet been established and tested(Fig.4).These hybrids are promising candidates for evaluation in field trials.
4.Discussion
4.1.Hybrid maize breeding based on the two divergent heterotic groups Shaan A and B
Hybrid maize breeding benefits from genetically distinct and complementary heterotic groups[60,61].This has been shown based on quantitative genetic theory[62,63]but also empirically[64,65].Our study is based on the two heterotic groups Shaan A and B that are genetically divergent(Fig.2)and are used for hybrid maize breeding in Shaanxi Province,China.Based on the genotypic and phenotypic data,we studied the potential and limits of genome-wide prediction of the hybrid performance for this heterotic pattern.
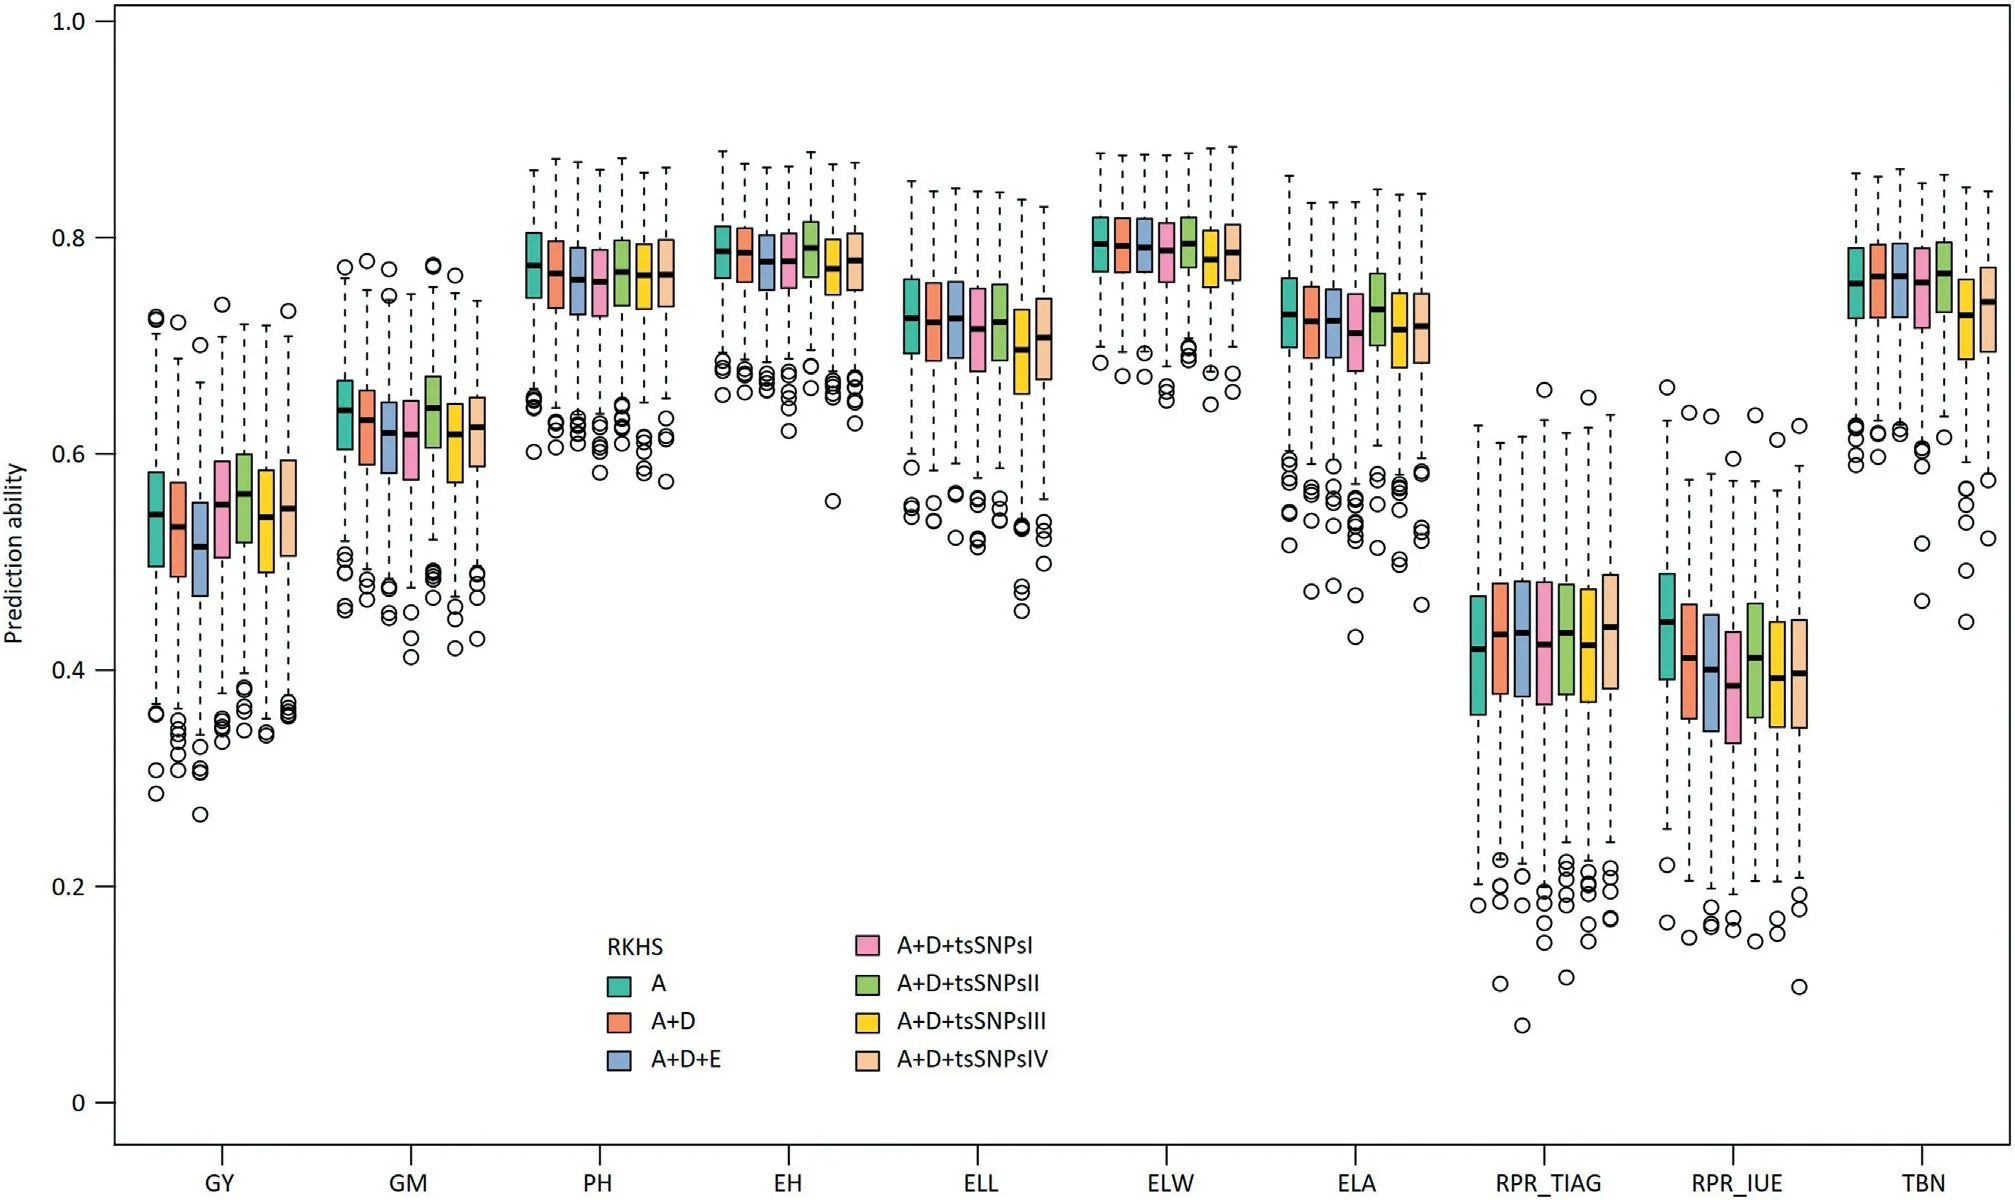
Fig. 3 – Box-Whisker plots of whole-genome best linear unbiased prediction (RKHS) ability of 10 traits. Additive (A), dominance(D) and epistatic (E) effects were included in the RKHS step by step. And, four SNPs sets were selected to expand the A + D RKHS model. The 4 trait-specific SNPs sets (tsSNPs) picked according to the score (-log10 (P)) of SNPs and the phenotypic variation explained (PVE) by SNPs in GWAS analysis based on training data: tsSNPsI, the SNPs set with score > 4.02, was considered as fixed effect; tsSNPsII, the SNPs set with PVE >10%, was considered as fixed effect; tsSNPsIII, the SNPs set of score > 3, was modelled as random effect; tsSNPsIV, the top 10 most significant SNPS, was modelled as random effect.
Although the control of population structure is important to reduce the false positive rate in genome-wide association studies,many studies of genome-wide prediction have shown that population structure did not affect the prediction accuracy[66,67],neither for a genetically wide diversity population[68],nor for genetically narrow material[69].Consequently,in our study population structure was only used to control the polygenic background in genome-wide association mapping to identify trait-specific SNPs,but was not taken into consideration for hybrid prediction.
These previous findings were corroborated by this study.There were many hybrids with predicted high yield that showed excellent performance in multi-environmental trials.Furthermore,some varieties were released already,for example Shandan 619(A008×B008),a hybrid combination ranked sixth in the prediction of grain yield that has been released in 2018.
4.2.The prediction models only marginally influenced the prediction abilities

The six parametric models in our study reached similar prediction abilities(Table 2)either by linear regression(RR,EN and LASSO)or by Bayesian approaches(RKHS,Bayes B,and Bayes C)which confirms previous results[58,71].Among these six models,we observed slightly better prediction abilities for RR than for EN and LASSO,except for grain yield(LASSO was only 0.001 higher than RR).These results are again consistent with a previous study[72]in which RR outperformed LASSO with respect to the prediction ability for five out of six traits.Although there was a decrease in prediction ability for the non-parametric models(RF and SVM),the maximum difference between parametric and non-parametric models averaged across the 10 traits was only 0.071.Summarizing,the choice of the prediction model only marginally influenced the prediction abilities[73].

Fig.4–Grain yield improvement by genomic selection.(a)The distribution of the top 44 single-cross combinations selected by two strategies,either from the predicted values of the tested 442 hybrids,or from the predicted values of all 6328 possible hybrid combinations.The black vertical dotted line represents the grain yield of check commercial variety Zhengdan 958;light blue and green represents the average performance of 44 from 442 and 6328 hybrids,respectively.(b)Promising hybrid combinations that have not been generated in the breeding program so far.(c)Boxplot showing grain yield of the 10 hybrids with the highest predicted performance compared with that of the remaining 432 hybrids.
4.3. Modelling of non-additive effects did not improve the prediction ability for most traits
In our study, the prediction ability could not be improved by modelling non-additive effects for most traits with the exception of RPR_TIAG (Fig. 3). The lack of improvement or even decrease was also observed in previous studies on genomic prediction of hybrid performance in rice [11], but contrasts with the results in hybrid wheat [35], rapeseed [40],and maize [37,70]. One reason for this discrepancy is the fact that the relationship between additive, dominance, and epistatic kinship matrices were not independent in our study (Table S5). Thus, non-additive variance provided only limited novel information, but increased the noise for the prediction model, leading to a decline in the prediction ability.The increase in prediction ability observed for RPR_TIAG when modelling also non-additive effects (Fig. 3) can be explained by their exceptionally prominent role: The nonadditive variance including D, AA, AD, and DD was four times larger than the variance of additive effects (Fig. S11), thus boosting prediction ability by the addition of dominance and epistasis effects in the model (Table 2).
4.4. Trait-specific SNPs can drive an increase in predictive ability
According to earlier studies [7,8,29,30,74], trait-specific markers can be advantageous for genome-wide prediction,especially for traits controlled by small numbers of quantitative trait loci. However, when the phenotypic information of the test set is used to identify trait-specific markers, their potential may be overestimated, since the phenotype of the test set is the goal of our prediction. Thus, in our study, we exclusively identified marker-trait associations in the respective training population. We tested a variety of trait-specific SNP subsets in the A + D RKHS model either as fixed or as random effects. Some combinations led to an increase in the predictive ability analogous to previous studies [29,30]. The best model with the SNP subset with PVE >10% increased the prediction ability of grain yield from 0.528 to 0.558. This suggests that in the case of significant marker-trait associations, the prediction ability can be increased by considering trait-specific SNPs in the prediction model [7]. In conclusion,the efficiency of molecular breeding programs can be substantially increased by the knowledge of the genetic architecture of the target traits [30].
4.5. Implications of genomic selection for hybrid maize breeding
Previous studies on the prediction of F1hybrids between recombinant inbred lines [70] or doubled haploid lines [75]derived from bi-parental populations indicated the potential of this biometric tool for hybrid maize breeding. The results of our study corroborate previous findings and substantiate the power of genomic selection for the identification of excellent single-cross combinations between the heterotic groups Shaan A and B. This pattern is based on two diverse heterotic groups that are adapted for maize cultivation in Shaanxi Province, China. The performance of all 6328 potential hybrids was predicted using genotypic and phenotypic data from 442 hybrids. Compared to the selection based on 442 hybrids (10%,44/442), selection based on all possible hybrids showed a stronger selection efficiency (Table S2), which is based on a high selection intensity (44/6328 = 0.006953). Similar results were reported in other crops, such as rice [11], wheat [35], and millet [76]. The comparison with the performance of the important commercial hybrid variety Zhengdan 958, demonstrates the immediate practical relevance of the results of our study.
5.Conclusions
Our study was performed to identify outstanding single-cross hybrids and to evaluate the potential of genome-wide prediction based on data from a maize population in Shaanxi,China. The impact of the different prediction models was negligible. In contrast, prediction abilities depended strongly on the genetic architecture of the traits. This suggests that this knowledge should be incorporated into genome-wide prediction models as it can increase prediction ability.
Supplementary data for this article can be found online at https://doi.org/10.1016/j.cj.2020.04.006.
Author contributions
Wenxin Liu,Shutu Xu,Jiquan Xue,Shaojiang Chen,and Jochen Reif managed the project.Shutu Xu,Yuan Dong,Xiaokang Tian,and Jiquan Xue designed and executed the experiment.Guoliang Li,Yusheng Zhao,Jochen Reif,and Wenxin Liu performed data analysis.Guoliang Li,Jochen Reif,Tobias Würschum,and Winxin Liu wrote the manuscript.All authors read and approved the final manuscript.
Declaration of competing interest
The authors declare that the research was conducted in the absence of any commercial or financial relationships that could be construed as a potential conflict of interest.
Acknowledgments
This work was supported by the National Key Research and Development Program of China(2016YFD0101200 and 2018YFD0100200),and the Scientific Research Foundation for the Returned Overseas Chinese Scholars,Ministry of Education.
- The Crop Journal的其它文章
- Quantitative genetic studies with applications in plant breeding in the omics era
- Brief Guide for Authors
- Use of family structure information in interaction with environments for leveraging genomic prediction models
- META-R:A software to analyze data from multi-environment plant breeding trials
- Modeling and simulation of recurrent phenotypic and genomic selections in plant breeding under the presence of epistasis
- A sulfotransferase gene BnSOT-like1 has a minor genetic effect on seed glucosinolate content in Brassica napus