
Spatial variations in food web structures with alternative stable states: evidence from stable isotope analysis in a large eutrophic lake*
2018-05-07 06:07:27LIYunkai李云凱ZHANGYuying張毓穎XUJun徐軍ZHANGShuo張碩
關鍵詞:徐軍
LI Yunkai (李云凱) , ZHANG Yuying (張毓穎) , XU Jun (徐軍) , ZHANG Shuo (張碩)
1 College of Marine Sciences, Shanghai Ocean University, Shanghai 201306, China
2 Marine Sciences Program, School of Environment, Arts and Society, Florida International University, 3000 NE 151st St., North Miami, Florida 33181, USA
3 Donghu Experimental Station of Lake Ecosystems, State Key Laboratory of Freshwater Ecology and Biotechnology of China,Institute of Hydrobiology, Chinese Academy of Sciences, Wuhan 430072, China
1 INTRODUCTION
Lakes are complex aquatic ecosystems consisting of distinct subsystems or habitats with large environmental heterogeneity (Arcagni et al., 2015).Such spatial heterogeneity may be associated with strong variations in environmental conditions and resource availability, possibly resulting in different contribution of planktonic and benthic production to food webs (Zambrano et al., 2010; Vander Zanden et al., 2011; Xu et al., 2014). Such variation is usually related to anthropogenic sources of sewage (Steff y and Kilham, 2004) or proximity to areas of increased urban populations (Harvey and Kitchell, 2000). For instance, agricultural, urban, and industrial development has led to the release of a relative abundance of nutrients to aquatic environments,which influences the abundance and nutritional quality of organisms at the base of the food web,thereby affecting the overall condition of upper-level consumers (Hebert et al., 2006; Ofukany et al., 2015).Moreover, many food web studies of lakes have generally attempted to characterize the overall food web structure and have largely ignored internal spatial and environmental variations. In reality, differences in food web structures have often been observed in large lakes with strong environmental gradients(Guzzo et al., 2011; Hobson et al., 2012).
Stable carbon and nitrogen isotopes are increasingly employed to characterize the food web structure of aquatic ecosystems and isotope ratios (13C/12C and15N/14N, referred to as δ13C and δ15N, respectively) can reveal distinct components of an organism’s dietary niche (Post, 2002; Fry, 2006; Layman et al., 2007;Shiff man et al., 2012). δ13C values change little (0–1‰) as carbon moves up the food chain, thus they can be used to trace the ultimate food sources of an organism (Peterson and Fry, 1987). δ15N values show a predictable stepwise enrichment (2‰–4‰) from prey to predator, providing a means to quantify the trophic position of an organism (Minagawa and Wada,1984; Post, 2002; Caut et al., 2009; Hussey et al.,2014). This approach has been used to elucidate major pathways of energy flow to organisms (Vander Zanden et al., 2011), regime shifts in freshwater ecosystems(Xu et al., 2014), impacts of eutrophication (Hobson et al., 2012), and has allowed spatial heterogeneity to be identified within a single lake (Zambrano et al.,2010; Guzzo et al., 2011).
Taihu Lake is the third largest freshwater lake in China, with an area of 2 338 km2and a mean depth of 1.9 m. The lake has provided drinking water, tourism,fisheries, and shipping services for centuries (Qin et al., 2007; Li et al., 2009). Gross Domestic Product(GDP) in the lake drainage area is about one-seventh of the total GDP of China (Qin et al., 2007). Due to the rapid development of the economy and the intensive use of the lake, pollution has become increasingly serious in Taihu Lake since the 1980s, and this has rapidly accelerated the eutrophication of the lake (Li et al., 2009). different degrees of economic growth and urbanization around the lake have resulted in a large trophic gradient from southern to northern Taihu Lake(Qin et al., 2007). Therefore, two sub-basins with distinct morphometry and trophic status can be found in Taihu Lake; Meiliang Bay (MB) and East Taihu Lake (ETL). MB is relatively large with phytoplankton as the main primary producer. ETL is located in the southeast of Taihu Lake and is covered with a dense population of vascular plants and referred to as a macrophyte-type lake (Wu et al., 2006). Although the eutrophication and changes within the planktonic community have been the focus of previous trophic studies on Taihu Lake (Wu et al., 2006; Tan et al.,2009), and studies related to fish populations have emerged in recent years (Zhou et al., 2011; Mao et al.,2012), most of these studies were not comprehensive at the spatial or community-wide levels (Xu et al.,2011; Mao et al., 2012; Li and Gong, 2014), though a high degree of spatial heterogeneity within the ecosystem was observed (He et al., 2012). This may provide misleading information when examining trophic interactions among key species at a whole lake scale or making comparisons of food web structures among lakes. Additionally, the consideration of such spatial heterogeneity will be helpful for policy decisions in restoration and ecosystem-based fishery management (Li et al., 2009).
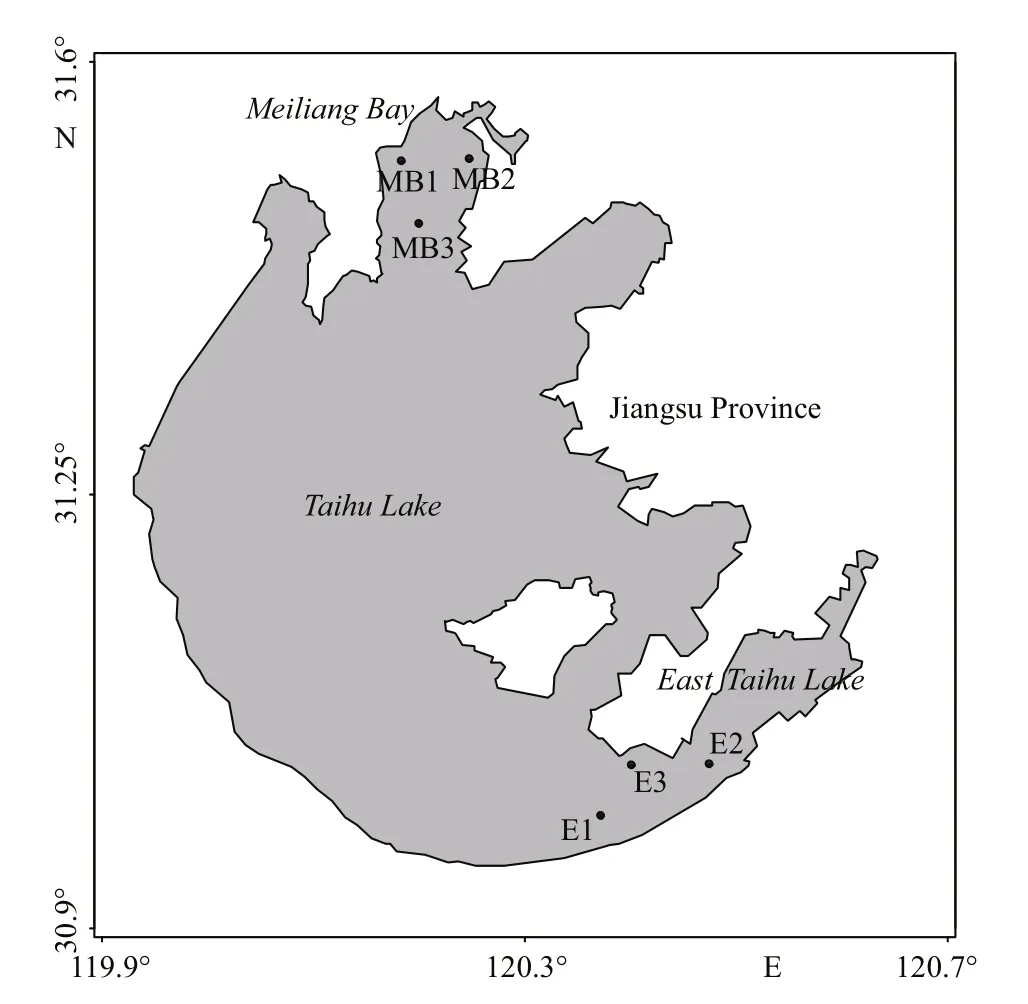
Fig.1 Map of Taihu Lake and the sampling stations between August and October, 2012
The objectives of this research are; (1) to evaluate the spatial heterogeneity of δ13C and δ15N values of organisms, and compare the food web attributes between different lake sub-basins, and (2) to elucidate the major pathways of energy flow through the food web. Stable isotope data will provide baseline information for comparison with future food web studies and aid researchers in predicting how changes in eutrophication will affect fish community structures and fisheries resources.
2 MATERIAL AND METHOD
2.1 Study sites
Taihu Lake (119°53′45″to 120°36′15″E and 22°00′to 27°10′N) is a eutrophic system with a mean depth of 1.9 m. The annual precipitation in the area is 1 100–1 400 mm, and the mean temperature is approximately 16°C. We randomly selected three sampling sites in MB (sampling sites: MB1, MB2,MB3) and ETL (sampling site: E1, E2, E3), (Fig.1).Inter-site distance within each basin was approximately 5 km. MB is in the northwest part of Taihu Lake and is considered to be one of the most hypereutrophic parts of the lake due to the heavy allochthonous inputs from the surrounding terrestrial ecosystem.Microcystisblooms occur annually from June to October (Qin et al., 2007). Conversely, ETL is a relatively small sub-basin with clear water and abundant submerged macrophytes.
2.2 Field collections
Water samples, plankton, macrophytes, benthic invertebrates, and fish were collected at each site every month from August to October 2012. Floating and submerged leaves of macrophytes were collected by hand at each site. Phytoplankton and zooplankton samples were collected by hauling plankton nets(mesh size 47 μm and 64 μm for phytoplankton and zooplankton, respectively) vertically through the entire water column. Benthic invertebrates, mainly snails and mussels, were collected using a bottom trawl at a speed of 2 km/h for 10 min. Fish were collected by fishermen using a casting net and a bottom trawl net. For each fish captured, total length(TL) was recorded.
2.3 Sample preparation and stable isotope analysis(SIA)
Nutrient concentrations were determined immediately after collecting water samples (total nitrogen (TN), total phosphorus (TP), and chlorophyllaconcentrations (Chl-a) were measured). TN and TP were analyzed using the alkalinepotassium persulfate digestion-UV spectrophotometric method and the potassium persulfate digestion-ammonium molybdate spectrophotometric method, respectively, (Fu et al.,2014). Chl-awas determined using the 90% acetone extraction method (Mantoura and Llewellyn, 1983).
A total of 553 organisms were sampled for SIA from three plant groups, seven invertebrate groups,and nine fish groups. Species categorized into groups and sample sizes are listed in Table 1. All the samples were frozen whole and brought back to the lab in thermally sealed plastic bags. The foot tissues of snails and mussels were dissected for SIA. Individual snails and mussels with similar body weights (grouped by 1 g increments using their weight data) were pooled for processing. Dorsal muscle (white muscle)was removed from each fish since it has less variability in terms of δ13C and δ15N than other tissues (Pinnegar and Polunin, 1999), rinsed with water, placed in cryovials, and frozen at -20°C for subsequent SIA.
Prior to SIA, all the samples were freeze-dried at-55°C for at least 48 hours using a Christ Alpha 1-4 LD plus Freeze Dryer (Martin Christ; Osterode am Harz, Germany) and homogenized using a Retsch Mixer Mill MM 400 (Retsch; Haan, Germany).Samples were weighed (1 200–1 600 μg) into 0.3 mg tin capsules and analyzed using an IsoPrime 100 isotope ratio mass spectrometer (Isoprime Corporation, Cheadle, UK) and vario ISOTOPE cube elemental analyzer (Elementar Analysensysteme GmbH, Hanau, Germany). Reference standards USGS 24 (-16.1‰ V-PDB) and USGS 26 (53.7‰AIR) were used for quantification of stable isotope values of carbon and nitrogen, respectively. Every tenth sample was a triplicate lab reference standard(Protein: δ15N: 5.9‰ and δ13C: -27.0‰) to assess intra-run precision, and a blank sample was run every ten samples to clear off residual gases. The analytical error for samples was approximately 0.1‰.
2.4 Isotope-mixing model
Primary consumers (snails and mussels) were considered to be a better proxy of isotopic baseline for inshore and off shore food chains, respectively(Vander Zanden et al., 1999; Post, 2002). An isotopemixing model was used to calculate the contribution of planktonic secondary production to fish by using the equation below:
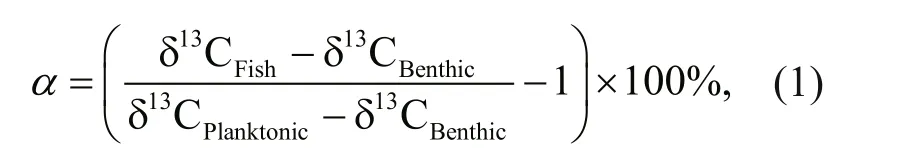
whereαrepresents the planktonic contribution to the isotopic composition of the fish. δ13CFish, δ13CBenthicand δ13CPlanktonicare the mean δ13C values of fish, benthic baseline consumer (snail) and planktonic baseline consumer (mussel), respectively.
Trophic levels of fish species (TLFish) were calculated using the equation below:

whereλis the trophic level of selected baseline consumers (in this case,λ=2 is used for the primary consumers). δ15NFish, δ15NBenthicand δ15NPlanktonicare the mean δ15N values of fish, benthic baseline consumer(snail), and planktonic baseline consumer (mussel),respectively. Δ15N represents the trophic level enrichment of δ15N value. In this study, we used the generally assumed value of 3.4 from Post (2002).
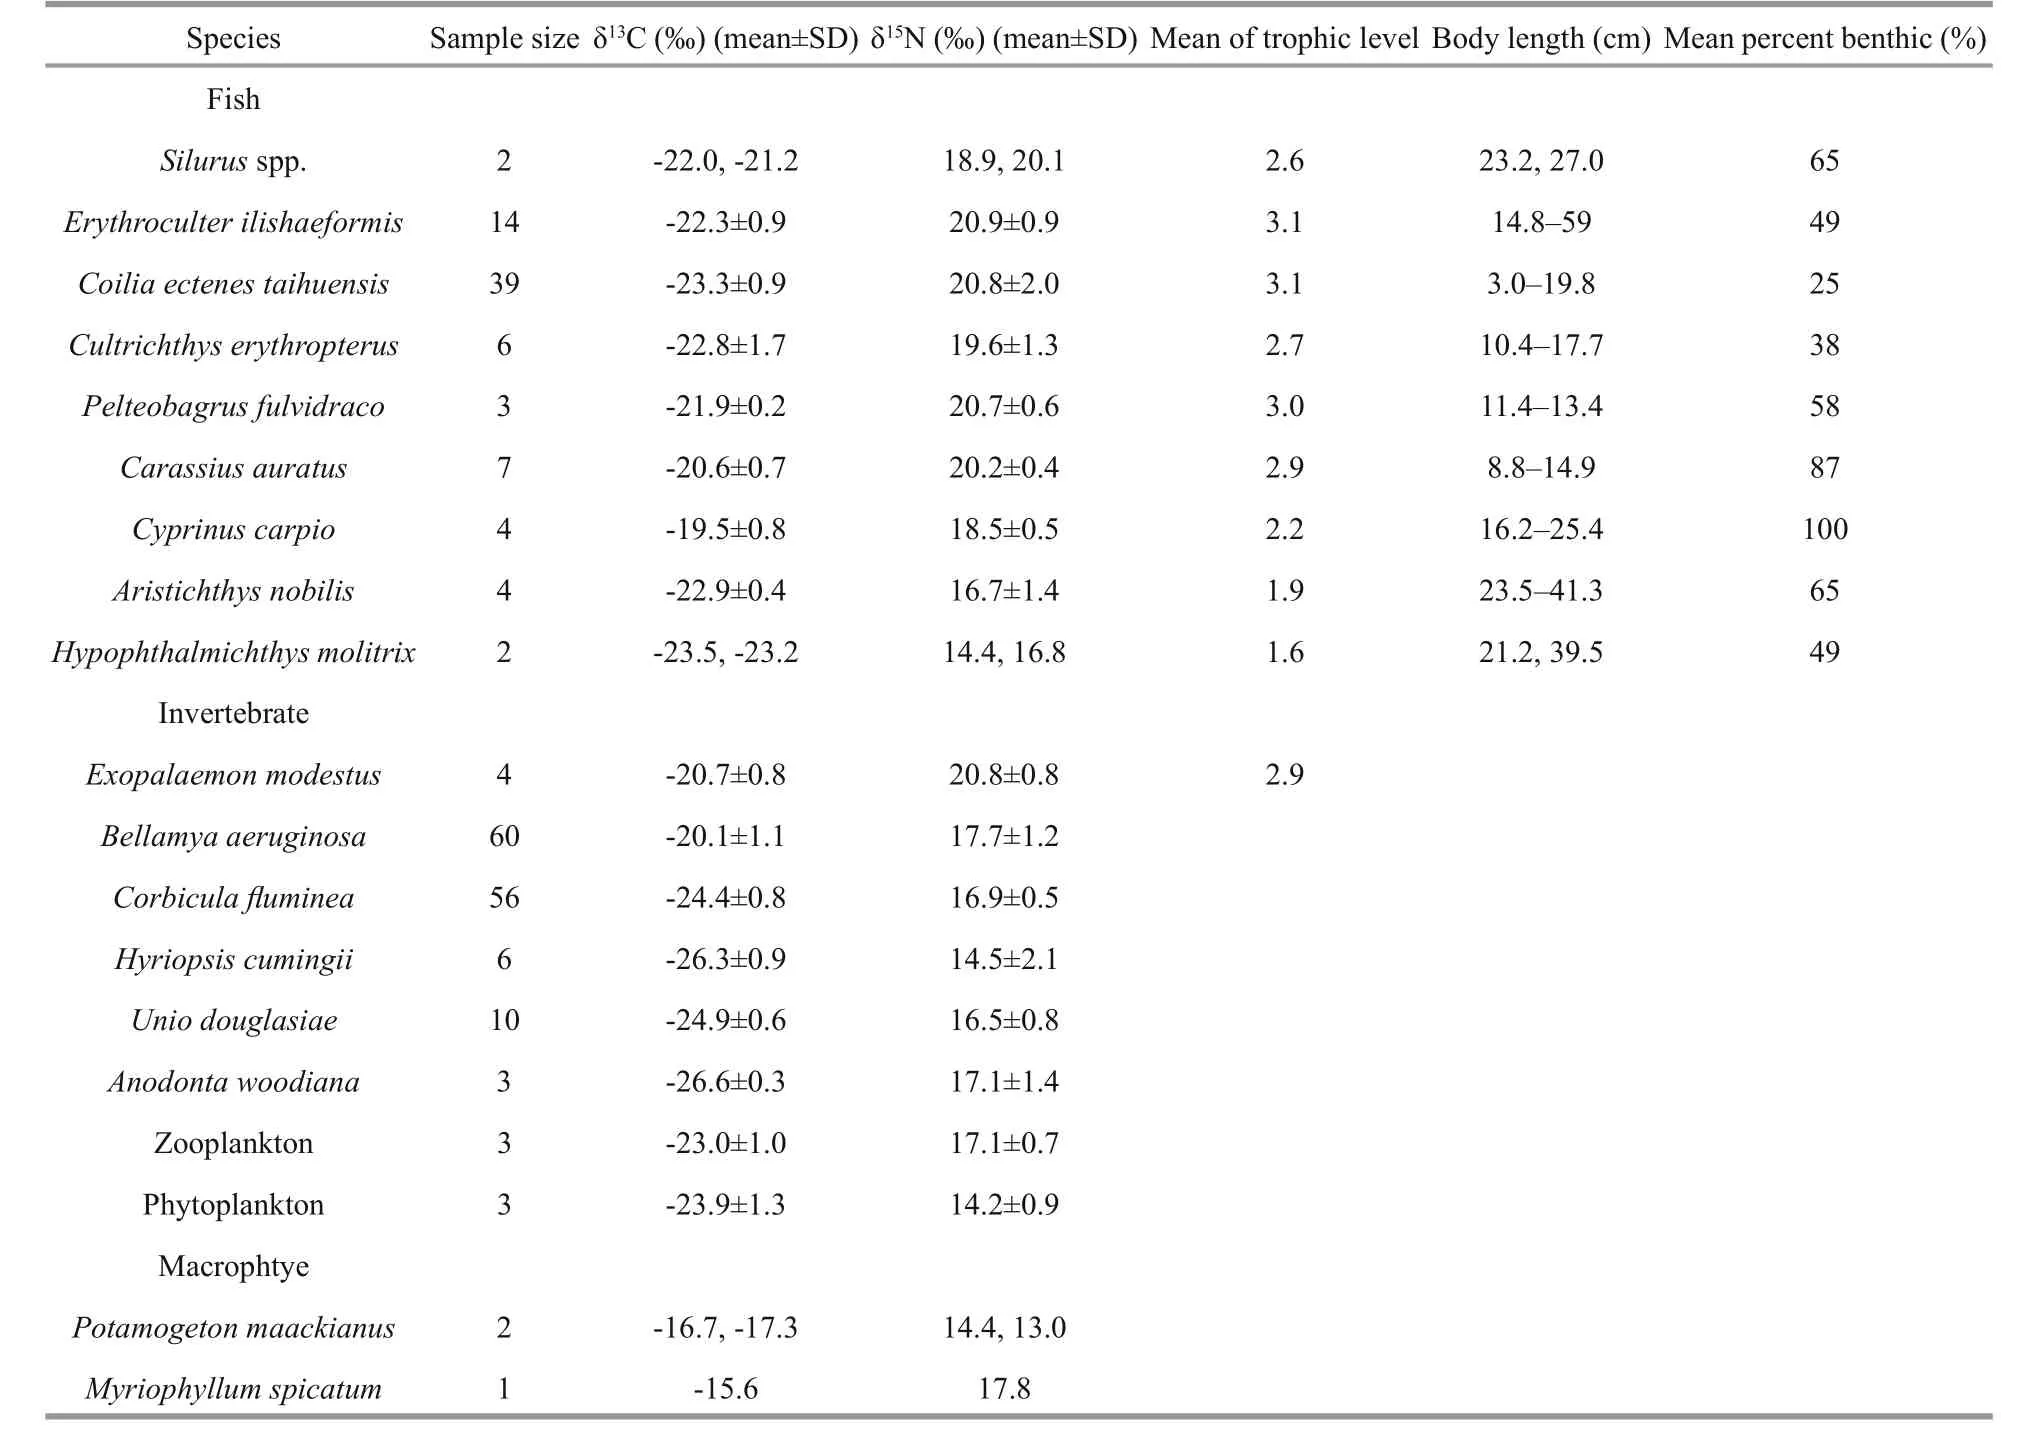
Table 1a Stable isotope values and estimated trophic levels of organisms in the food web of Meiliang Bay
2.5 Statistical analysis
The statistical analyses were performed using R(Version 3.1.2; R Development Core Team, 2014).differences in nutrient concentrations between basins were examined using the Studentt-test. The stable isotope values of organisms were displayed using conventional bi-plots (δ15N versus δ13C). Paired t tests were applied on the averaged stable isotopic values of species to determine whether there were significant differences in isotope values of the same species between the two basins. Comparison of baseline species (snails and mussels) isotope values between basins were conducted usingt-test as well. Equality of variances of isotope values were examined before t test analysis. Averaged trophic level of carnivorous fish species between basins were compared using pairedt-test. Community niche analysis variables from Layman et al. (2007) including δ15N range (NR),δ13C range (CR), and total niche area (TA, the total area in the food web space occupied by the whole community) were used to quantitatively compare food web structures between basins. NR and CR are the differences between the mean δ15N and δ13C values of two species with the highest and lowest isotope values, respectively, which represent the vertical and horizontal structure of the food web. TA is the convex hull area estimated from the δ13C–δ15N bi-plot using the mean isotopic values. This can represent the total amount of niche space of all the species in the food web.
3 RESULT
In order to examine the spatial heterogeneity in structural and functional traits of Taihu Lake, we compared SIA data from different regions of the lake with contrasting environments. We observed a significant spatial effect on nutrient concentrations,Chl-avalues and aquatic organism isotope values between the two regions of the lake (Tables 1 and 2).TN, TP and Chl-ain MB were much higher than those in ETL (t-test s, TN:t=5.60; df=25;P<0.01; TP:t=7.43; df=25;P<0.01; Chl-a:t=16.33; df=25;P<0.01; Table 2). Fish from MB had significantly higher δ15N and δ13C mean values than those of fishfrom ETL (pairedttests, δ15N:t=13.06; df=8;P<0.01;δ13C:t=2.93; df=8;P<0.05; Table 1). Similar trends were also observed in the invertebrate primary consumers (snail (Bellamyaaeruginosa) and mussel(Corbiculafluminea)), as the isotopic values of both species were significantly higher in MB than those in ETL (t-test s, for snail, δ15N:t=33.58; df=104.5;P<0.01; δ13C:t=14.65; df=133.9;P<0.01; for mussel,δ15N:t=41.78; df=94.7;P<0.01; δ13C:t=17.41;df=117.2;P<0.01) (Table 1).
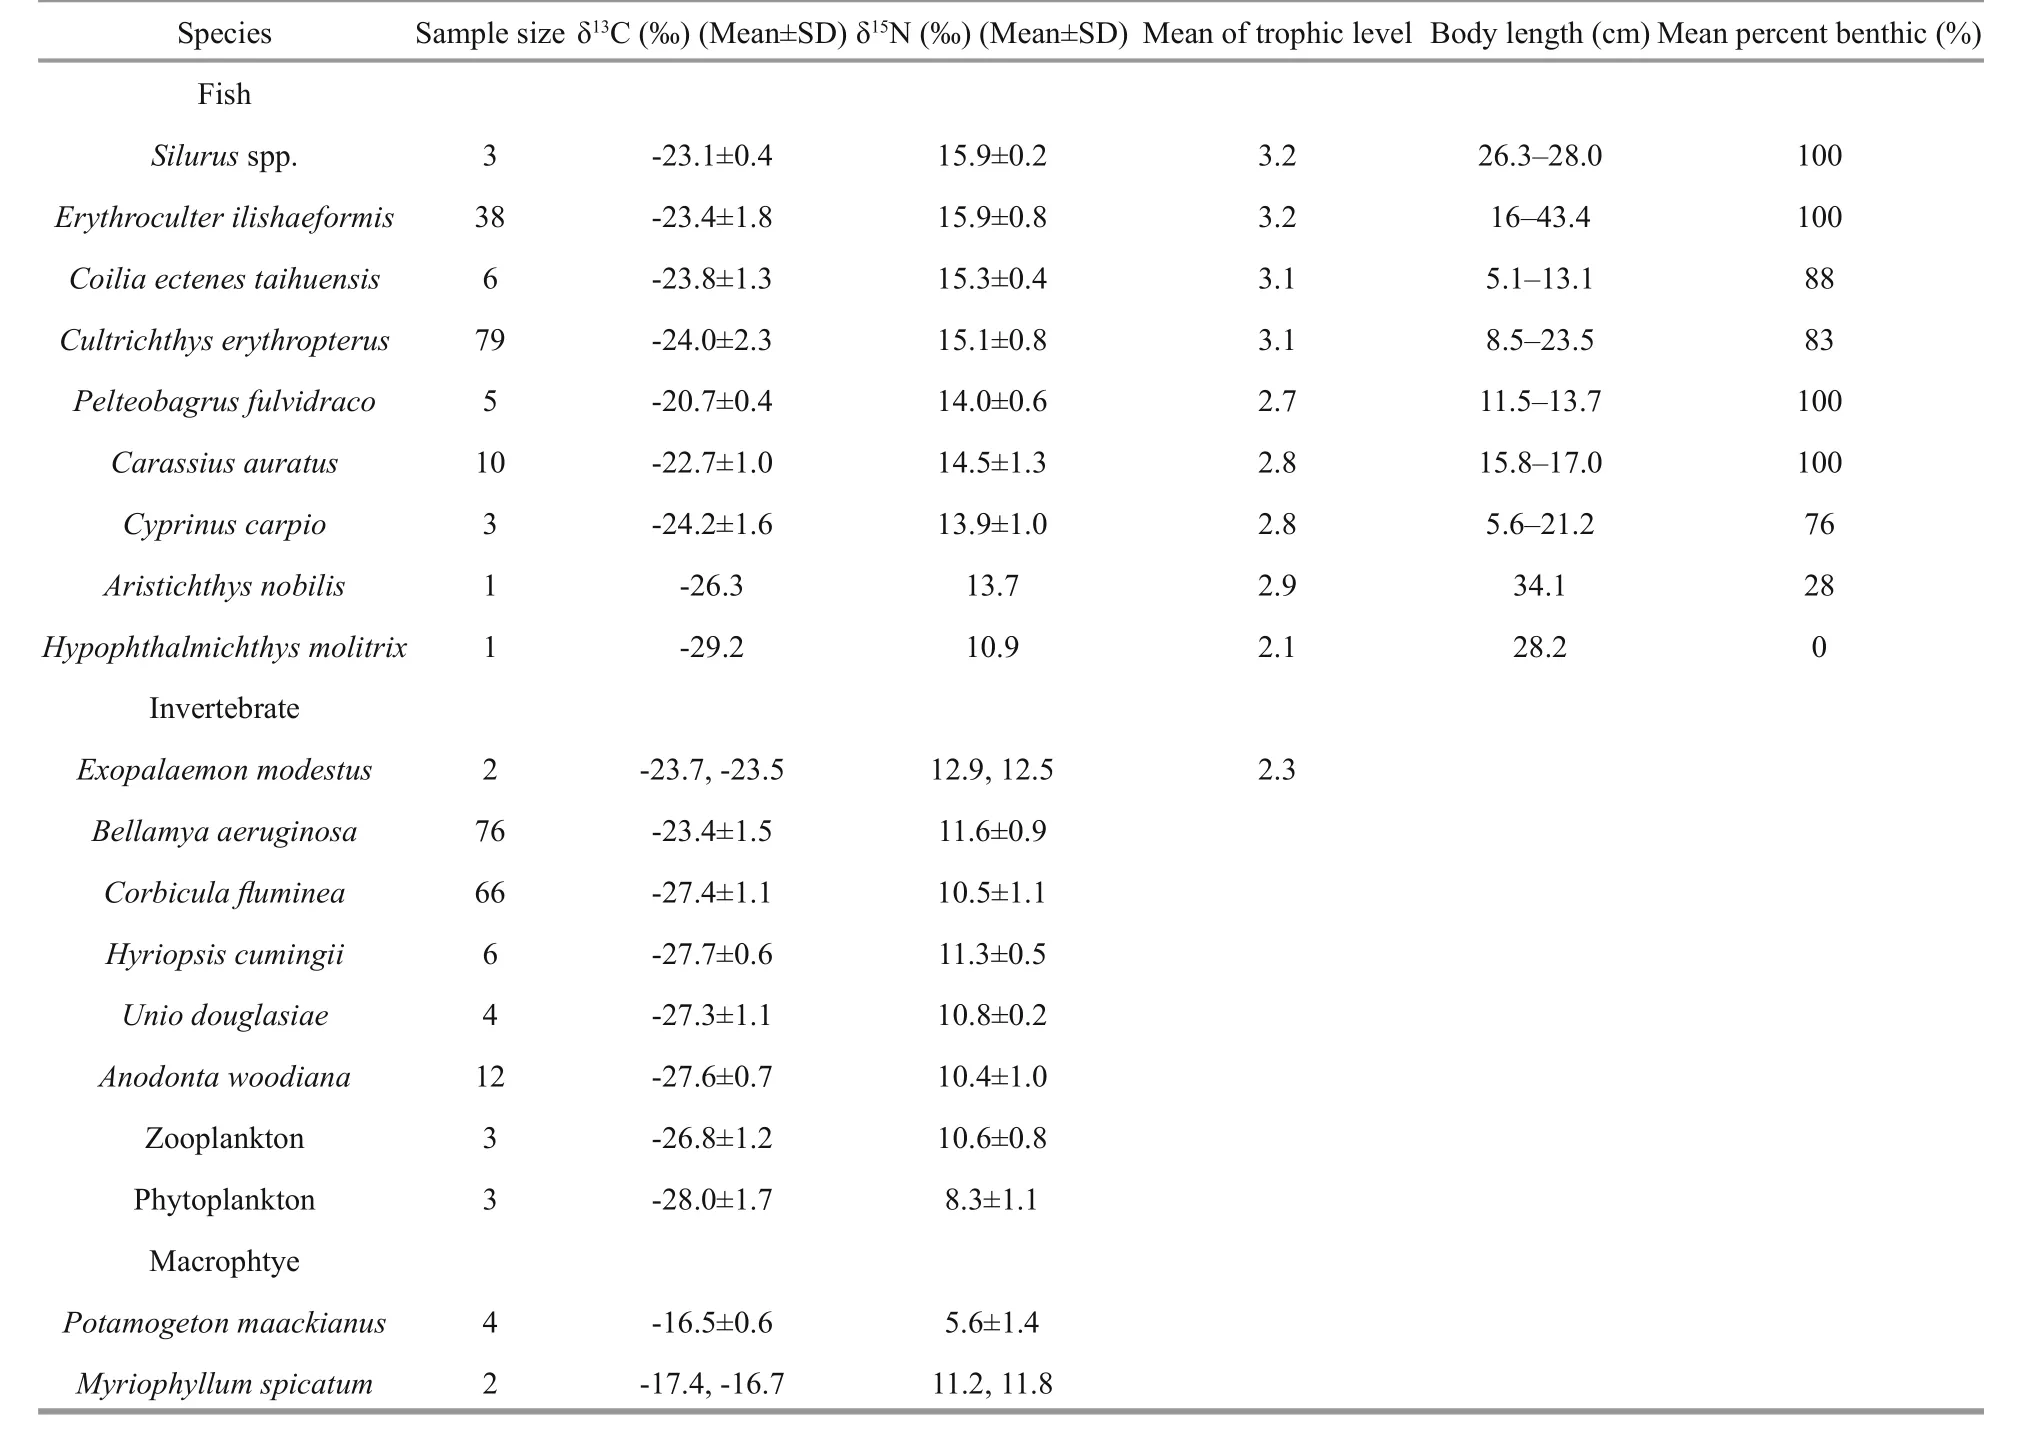
Table 1b Stable isotope values and estimated trophic levels of organisms in the food web of East Taihu Lake
All stable isotope data for the organisms sampled in both basins are presented as a bi-plot in Fig.2. δ15N and δ13C values of organisms in the basins differed and the fish communities occupied different isotopic spaces in the bi-plot. We observed a mean shift of 3.2‰ and 6.3‰ in δ13C and δ15N values of the primary consumers, snails (3.3‰ for δ13C and 6.1‰ for δ15N)and mussels (3.0‰ for δ13C and 6.4‰ for δ15N) from ETL to MB, respectively. Such shifts were also detected in the mean isotopic values of zooplankton and phytoplankton (zooplankton: 3.9‰ for δ13C and 6.5‰ for δ15N; phytoplankton: 4.0‰ for δ13C and 5.0‰ for δ15N). No significant differences were foundin the mean δ13C values of macrophytes between the two basins though a change in δ15N values of 7.2‰was observed.
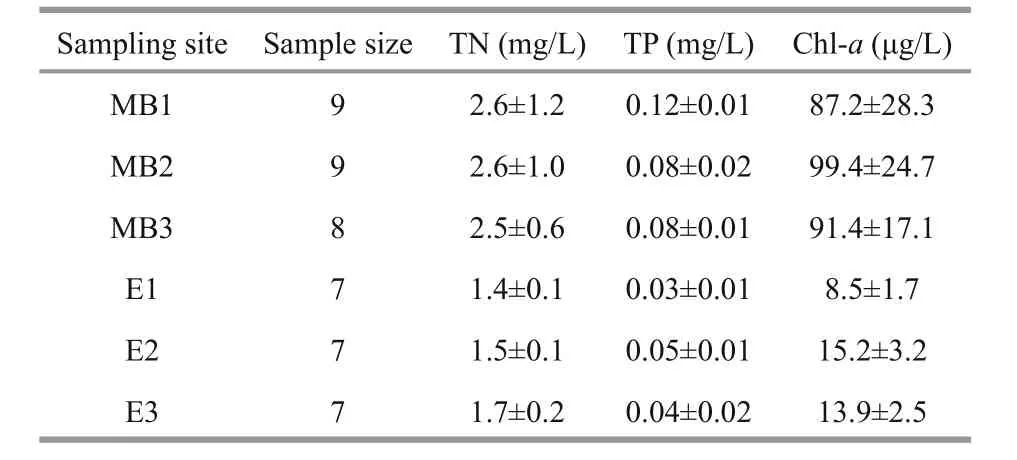
Table 2 Mean values±SD of TN, TP and chlorophyll- a concentrations for water samples at each sampling site of Taihu Lake from August to October 2012
Using the isotope-mixing model, the average trophic position and the mean percent contribution of benthic prey to fish diet was estimated (Table 1). The average trophic levels of carnivorous fish species in MB were significantly lower than those of the same carnivorous fish in ETL (pairedttests,t=-3.13; df=4;P<0.05). In general, benthic foods were more important to fish. Moreover, although the δ15N values of the fish communities had a similar range between both basins, the CR of fish was smaller in MB versus ETL. difference was also found in TA value between basins (Table 3; Fig.3b).
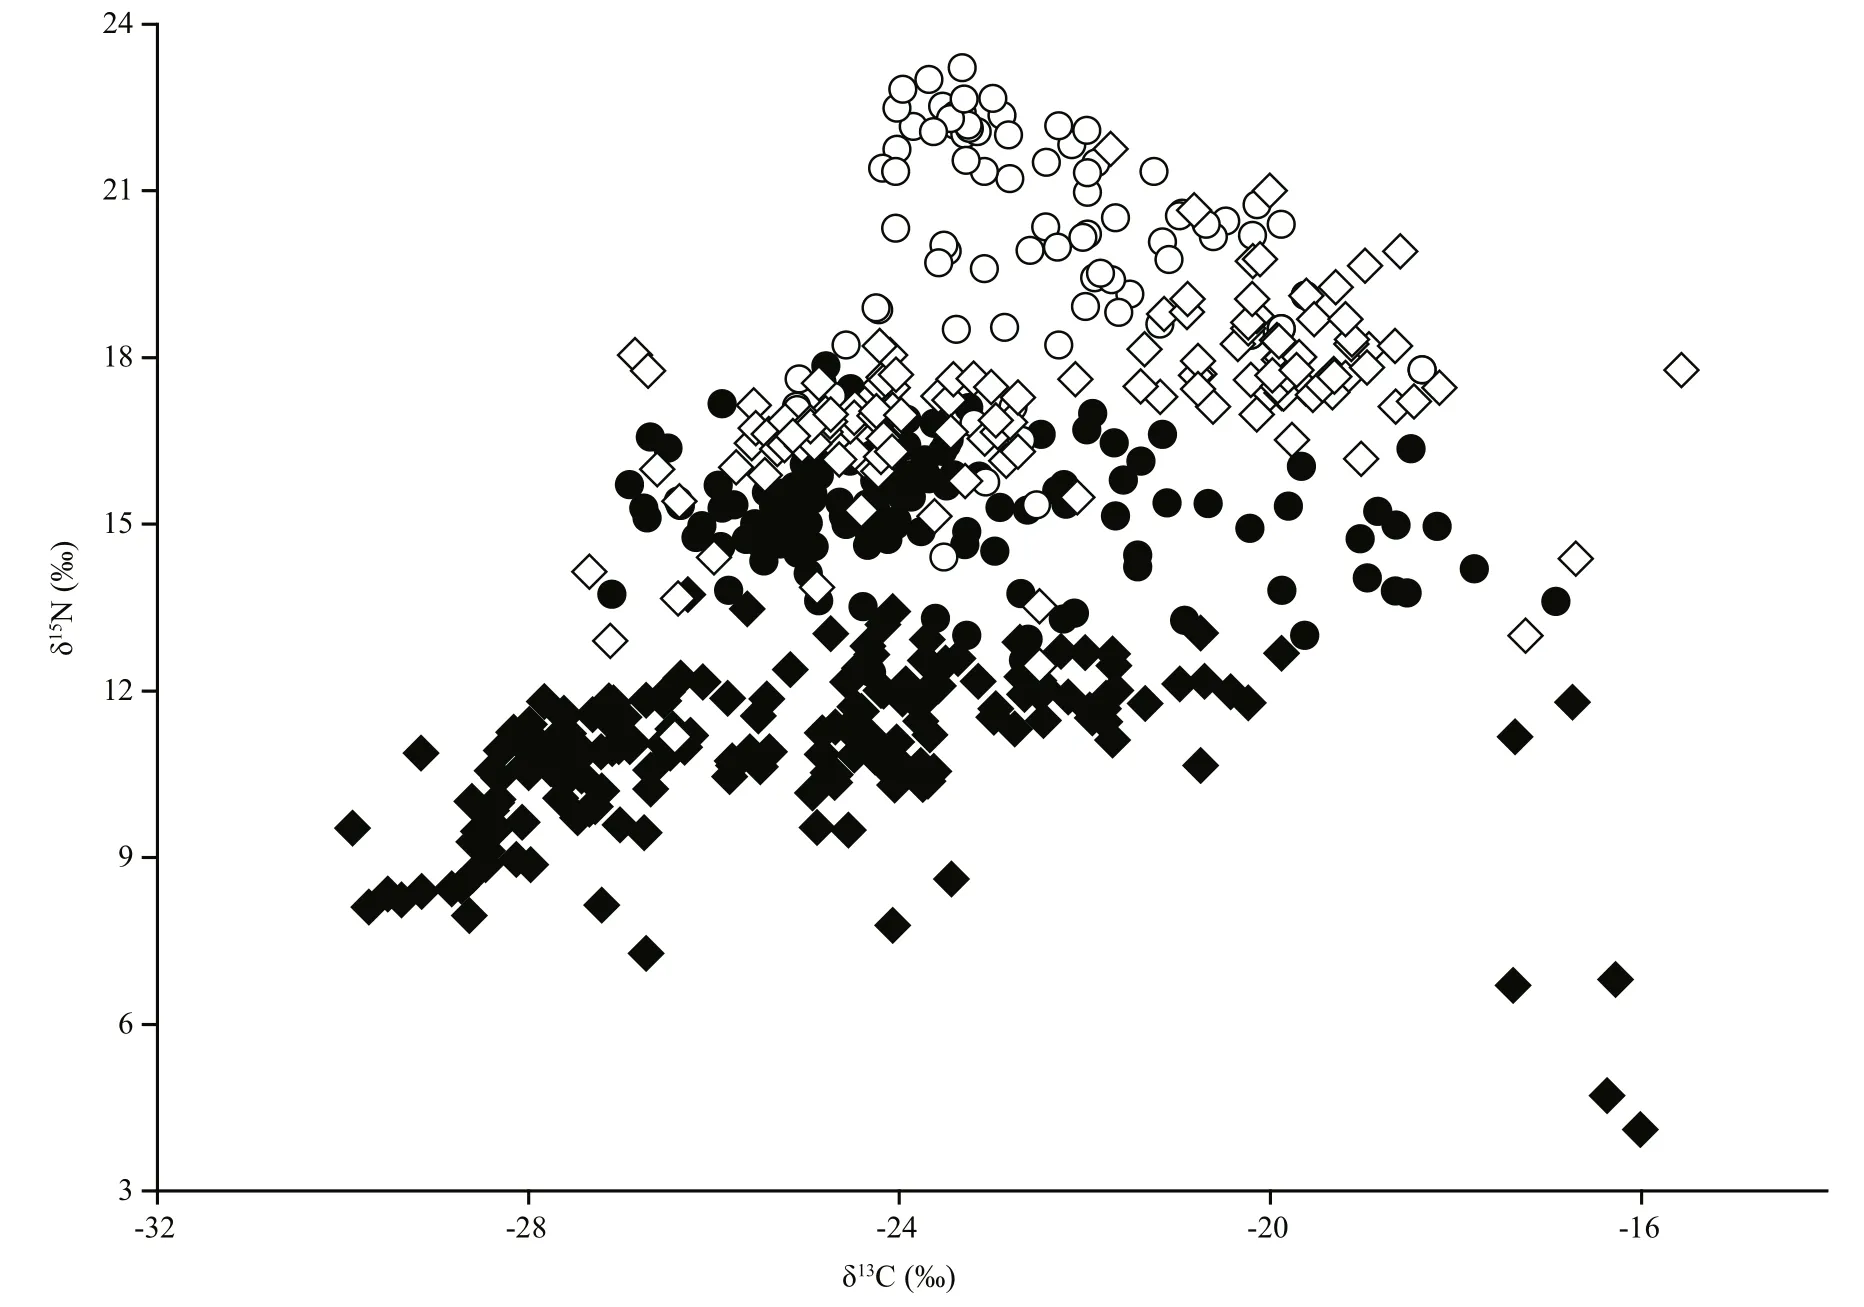
Fig.2 δ 15 N and δ 13 C values of organisms sampled in Meiliang Bay (MB) and East Taihu Lake (ETL)
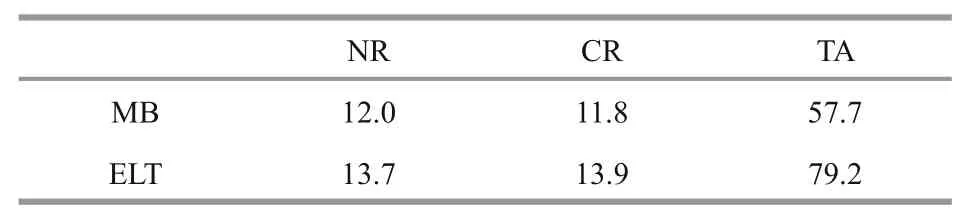
Table 3 Community niche variables of Meiliang Bay (MB)and East Taihu Lake (ETL)
4 DISCUSSION
Spatial variation in δ13C and δ15N values was observed despite the fact that our samples were collected from sites of similar depth in both basins of Taihu Lake. The δ13C and δ15N values of organisms in Taihu Lake exhibited isotopic differences between MB and ETL. This finding was in agreement with previous studies that suggested MB and ETL should be considered as separate ecological entities (Qin et al., 2007; Li and Gong, 2014).
different nutrient concentrations across basins(Table 2) were likely driving the significant spatial isotopic baseline differences in primary consumers(Fig.3a). Increases in food web baseline δ15N values have often been associated with increased sewage inputs (Cabana and Rasmussen, 1996; Hobson et al.,2012). MB is the most hyper-eutrophic part of Taihu Lake, receiving large amounts of15N-enriched nitrogen annually due to the intensive development of surrounding terrestrial industry and agriculture (Qin et al., 2007). Sewage and fertilizer runoff bring nitrogen and phosphorus into the water, contributing to cyanobacteria blooms in the warm season (Paerl et al., 2010). Moreover, cyanobacteria have a faster turnover rate than other phytoplankton species, their increased biomass is stimulated by high temperatures and nutrient availability, typically resulting in less negative δ13C values than for other algae (Schindler et al., 1997; Hobson et al., 2012). In addition, due to the high production of cyanobacteria and its dominance in the upper layer of the water, the growth of benthic algae and macrophytes in MB is restricted by light limitation, in turn leading to a low coverage of macrophytes and resulting trophic pathways starting being dependent upon phytoplankton. In contrast,ETL has relatively less nutrient inputs from the terrestrial system (Li and Gong, 2014), and is dominated by benthic algae and macrophytes.Considering the distinct δ13C values of phytoplankton and submerged macrophytes, the differences observed in δ13C values of organisms between the two basins could be explained. Generally, phytoplankton fractionates less13C to a lesser degree compared to submerged macrophytes resulting a lower δ13C values in phytoplankton (Graham et al., 2010).
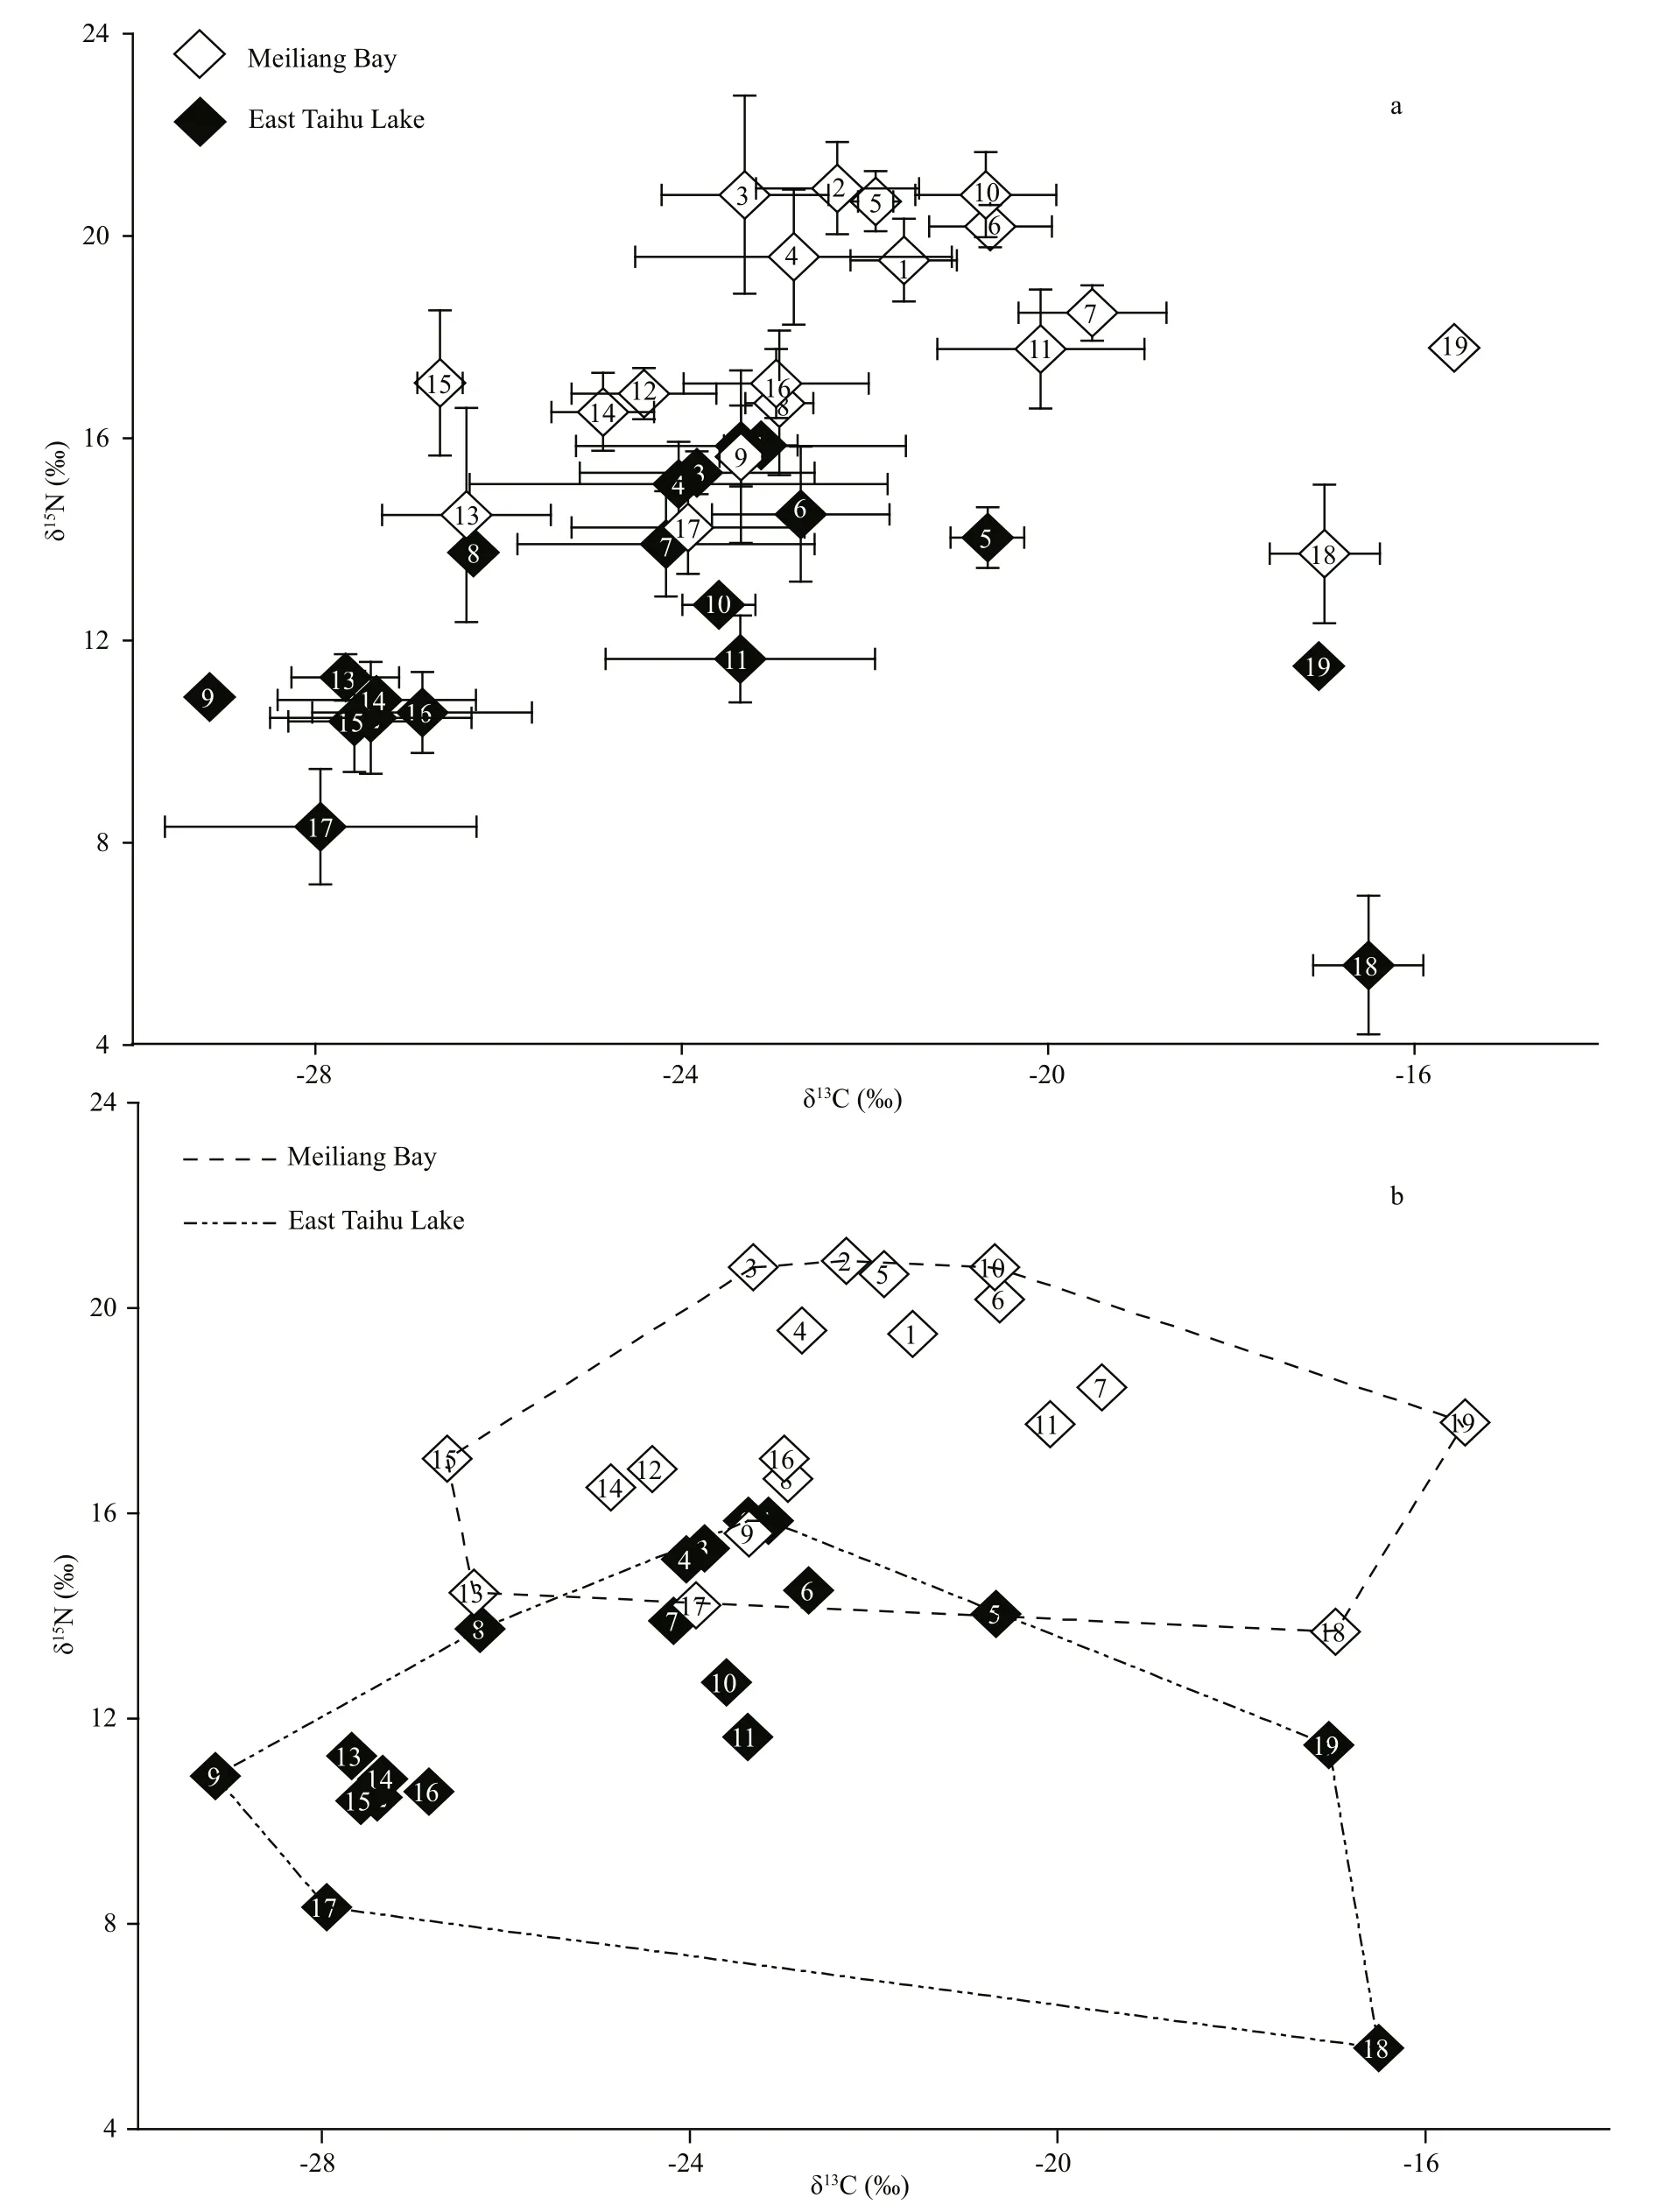
Fig.3 Mean values (±SD) of δ 15 N and δ 13 C of species sampled in Meiliang Bay (MB) (hollow diamond) and East Taihu Lake(ELT) (black diamond) (a); total area (convex hull area) of δ 15 N and δ 13 C bi-plots of MB and ETL of Taihu Lake (b)
Isotope mixing models are frequently used to estimate trophic position and inshore/off shore food source contribution to lake organisms (Vander Zanden et al., 2011; Xu et al., 2011; Zhou et al., 2011).However, these models require an accurate assessment of isotopic baselines. This could be problematic for large carnivorous fish which may move over large distances thereby integrating different isotopic baselines associated with different areas. In Taihu Lake,Erythroculterilishaeformisis considered to be the top predator. Analyses of gut contents from that species revealed thatCoiliaectenestaihuensiscontributes more than 80% (wet weight) of theE.ilishaeformisdiet (Liu, 2008). Similar δ13C values of these two species confirmed their predator-prey relationship. However, it is unexpected that the mean differences in δ15N values of these two species were less than 1‰ in both basins, far less than one trophic level. One possible reason to explain such small differences could be the high degree of movement ofE.ilishaeformiswhich potentially migrate over larger spatial areas for food than smaller fish (Xu, 1984),and thus will integrate isotopic information from different foraging areas with large baseline isotopic variation. Another possible reason could be the differences in muscle turnover rate of these two species. Large fish such asE.ilishaeformis, have slower turnover and growth rates than smaller fish.Thus, the isotope values ofE.ilishaeformisreported in this study may reflect their dietary integration over several months whereas the isotope values ofC.ectenestaihuensismay reflect dietary integration over a shorter period, although this is expected to be altered by both fish size and growth stage (Martínez del Rio et al., 2009).
Regarding eutrophication, clearly, the isotopic information of smaller fish with low mobility and high tissue turnover rates could be a better proxy to track spatial changes in nutrient inputs to the lake and the degree of eutrophication compared with the highly mobile top predators (Perga and Gerdeaux,2004; Hobson et al., 2012; Mayer and Wassenaar,2012). Using the food web isotopic values reported in this study, a possible means of detecting future alterations due to eutrophication would be to routinely monitor the δ13C and δ15N values of a small species likeC.ectenestaihuensisfrom the same locations over time.
The results obtained using the isotope-mixing model revealed distinct trophic pathways contributing to fish diets in the two basins. Although phytoplankton rather than macrophytes are often considered to be the primary carbon source in aquatic ecosystems, it is worth noting that the estimated contribution of benthic carbon to most fish species was higher in ETL in comparison with MB, suggesting that macrophytes could make an important contribution to the organic carbon pool though they may not be the direct food source for fish species (Keough et al., 1996).
Extreme nutrient loading, as a consequence of urban and industrial development and agricultural fertilizer runoff , is most likely the driver of within system isotopic variation in Taihu Lake. TA was reported to be negatively related to nutrient loading in the aquatic community (Zambrano et al., 2010). The smaller NR, CR and TA of MB suggested a potential effect of anthropogenic nutrient inputs on food web structure, which may reduce the diversity of the resource base and therefore reduce the area occupied by the community in isotope niche space (Xu et al.,2014).
5 CONCLUSION
Stable isotope analysis has been increasingly employed to provide insights into trophic interactions among species and to reveal the structural and functional traits of large aquatic ecosystems. Variation in stable isotope values within large ecosystems is associated with chemical and physical environmental conditions. In this study, spatial heterogeneity in environmental and food web properties was detected within Taihu Lake. In this study, spatial heterogeneities in environmental and food web properties were detected within Taihu Lake. These differences with resultant effects on isotopic values in organisms are likely related to local spatial variation in nutrient loadings to lake waters and possibly to differences in trophic pathways. This information highlights the importance of considering isotopic variability in food web studies for ecosystem-based management in large lakes.
Arcagni M, Rizzo A, Campbell L M, Arribére M A, Juncos R,Reissig M, Kyser K, Barriga J P, Battini M, Guevara S R.2015. Stable isotope analysis of trophic structure, energy flow and spatial variability in a large ultraoligotrophic lake in Northwest Patagonia.J.GreatLakesRes.,41(3):916-925.
Cabana G, Rasmussen J B. 1996. Comparison of aquatic food chains using nitrogen isotopes.Proc.Natl.Acad.Sci.U.S.A.,93(20): 10 844-10 847.
Caut S, Angulo E, Courchamp F. 2009. Variation in discrimination factors (Δ15N and Δ13C): the effect of diet isotopic values and applications for diet reconstruction.J.Appl.Ecol.,46(2): 443-453.
Fry B. 2006. Stable Isotope Ecology. Springer, New York.308p.
Fu D F, Gong W J, Xu Y, Singh R P, Surampalli R Y, Zhang T C. 2014. Nutrient mitigation capacity of agricultural drainage ditches in Tai lake basin.Ecol.Eng.,71: 101-107.
Graham B S, Koch P L, Newsome S D, McMahon K W,Aurioles. 2010. Using isoscapes to trace the movements and foraging behavior of top predators in oceanic ecosystems.In: West J B, Bowen G J, Dawson T E, Tu K P eds. Isoscapes: understanding movement, pattern and process on earth through isotope mapping. Springer, New York. p.299-318.
Guzzo M M, Haff ner G D, Sorge S, Rush S A, Fisk A T. 2011.Spatial and temporal variabilities of δ13C and δ15N within lower trophic levels of a large lake: implications for estimating trophic relationships of consumers.Hydrobiologia,675(1): 41-53.
Harvey C J, Kitchell J F. 2000. A stable isotope evaluation of the structure and spatial heterogeneity of a Lake Superior food web.Can.J.Fish.Aquat.Sci.,57(7): 1 395-1 403.
He H, Yu J L, Zhang M, Liu Z W, Li K Y. 2012. Characteristic of nitrogen stable isotope inBellamyaaeruginosain different bays of Lake Taihu, China.J.LakeSci.,24(2):282-286. (in Chinese with English abstract)
Hebert C E, Arts M T, Weseloh D V C. 2006. Ecological tracers can quantify food web structure and change.Environ.Sci.Technol.,40(18): 5 618-5 623.
Hobson K A, Ofukany A, Soto D X, Wassenaar L I. 2012. An isotopic baseline (δ13C, δ15N) for fishes of Lake Winnipeg:implications for investigating impacts of eutrophication and invasive species.J.GreatLakesRes.,38(S3): 58-65.
Hussey N E, MacNeil M A, McMeans B C, Olin J A, Dudley S J F, Cliff G, Wintner S P, Fennessy S T, Fisk A T. 2014.Rescaling the trophic structure of marine food webs.Ecol.Lett.,17(2): 239-250.
Keough J R, Sierszen M E, Hagley C A. 1996. Analysis of a Lake Superior coastal food web with stable isotope techniques.Limnol.Oceanogr.,41(1): 136-146.
Layman C A, Arrington D A, Monta?a C G, Post D M. 2007.Can stable isotope ratios provide for community-wide measures of trophic structure.Ecology,88(1): 42-48.
Li Y K, Chen Y, Song B, Olson D, Yu N, Chen L Q. 2009.Ecosystem structure and functioning of Lake Taihu(China) and the impacts of fishing.Fish.Res.,95(2-3):309-324.
Li Y K, Gong Y. 2014. Food web structure of the East Lake Taihu by analysis of stable carbon and nitrogen isotopes.Chin.J.Ecol.,33(6): 1 534-1 538. (in Chinese with English abstract)
Liu E S. 2008. A study on diet composition of dominant fishes in Lake Taihu.J.Fish.China,32(3): 395-401. (in Chinese with English abstract)
Mantoura R F C, Llewellyn C A. 1983. The rapid determination of algal chlorophyll and carotenoid pigments and their breakdown products in natural waters by reverse-phase high performance liquid chromatography.Analytica ChimicaActa,151: 293-314.
Mao Z G, Gu X H, Zeng Q F, Zhou L H, Sun M B. 2012. Food web structure of a shallow eutrophic lake (Lake Taihu,China) assessed by stable isotope analysis.Hydrobiologia,683(1): 173-183.
Martínez del Rio C, Wolf N, Carleton S A, Gannes L Z. 2009.Isotopic ecology ten years after a call for more laboratory experiments.Biol.Rev.,84(1): 91-111.
Mayer B, Wassenaar L I. 2012. Isotopic characterization of nitrate sources and transformations in Lake Winnipeg and its contributing rivers, Manitoba, Canada.J.GreatLakes Res.,38(S3): 135-146.
Minagawa M, Wada E. 1984. Stepwise enrichment of15N along food chains: further evidence and the relation between δ15N and animal age.Geochim.Cosmochim.Acta,48(5): 1 135-1 140.
Ofukany A F A, Hobson K A, Wassenaar L I, Bond A L. 2015.The efficacy of scale sampling for monitoring trace element concentrations and stable isotopes in commercially harvested walleye (Sandervitreus).IsotopesEnviron.HealthStud.,51(3): 359-371.
Paerl H W, Xu H, McCarthy M J, Zhu G W, Qin B Q, Li Y P,Gardner W S. 2010. Controlling harmful cyanobacterial blooms in a hyper-eutrophic lake (Lake Taihu, China): the need for a dual nutrient (N & P) management strategy.WaterRes.,45(8): 1 973-1 983.
Perga M E, Gerdeaux D. 2004. Changes in the δ13C of pelagic food webs: the influence of lake area and trophic status on the isotopic signature of whitefish (Coregonuslavaretus).Can.J.Fish.Aquat.Sci.,61(8): 1 485-1 492.
Peterson B J, Fry B. 1987. Stable isotopes in ecosystem studies.Ann.Rev.Ecol.Syst.,18(1): 293-320.
Pinnegar J K, Polunin N V C. 1999. differential fractionation of δ13C and δ15N among fish tissues: implications for the study of trophic interactions.Funct.Ecol.,13(2): 225-231.
Post D M. 2002. Using stable isotopes to estimate trophic position: models, methods, and assumptions.Ecology,83(3): 703-718.
Qin B Q, Xu P Z, Wu Q L, Luo L C, Zhang Y L. 2007.Environmental issues of Lake Taihu, China.Hydrobiologia,581(1): 3-14.
Schindler D W, Carpenter S R, Cole J J, Kitchell J F, Pace M L. 1997. Influence of food web structure on carbon exchange between lakes and the atmosphere.Science,277(5323): 248-251.
Shiff man D S, Gallagher A J, Boyle M D, Hammerschlag-Peyer C M, Hammerschlag N. 2012. Stable isotope analysis as a tool for elasmobranch conservation research:a primer for non-specialists.Mar.FreshwaterRes.,63(7):635-643.
Steff y L Y, Kilham S S. 2004. Elevated δ15N in stream biota in areas with septic tank systems in an urban watershed.Ecol.Appl.,14(3): 637-641.
Tan X, Kong F X, Zeng Q F, Cao H S, Qian S Q, Zhang M.2009. Seasonal variation ofMicrocystisin Lake Taihu and its relationships with environmental factors.J.Environ.Sci.,21(7): 892-899.
Vander Zanden M J, Shuter B J, Lester N, Rasmussen J B.1999. Patterns of food chain length in lakes: a stable isotope study.Am.Nat.,154(4): 406-416.
Vander Zanden M J, Vadeboncoeur Y, Chandra S. 2011. Fish reliance on littoral-benthic resources and the distribution of primary production in lakes.Ecosystems,14(6): 894-903.
Wu J L, Lin L, Gagan M K, Schleser G H, Wang S M. 2006.Organic matter stable isotope (δ13C, δ15N) response to historical eutrophication of Lake Taihu, China.Hydrobiologia,563(1): 19-29.
Xu J, Wen Z R, Ke Z X, Zhang M, Zhang M, Guo N C, Hansson L A, Xie P. 2014. Contrasting energy pathways at the community level as a consequence of regime shifts.Oecologia,175(1): 231-241.
Xu J, Zhang M, Xie P. 2011. Sympatric variability of isotopic baselines influences modeling of fish trophic patterns.Limnology,12(2): 107-115.
Xu P C. 1984. The biology of the whitefish (Erythroculter ilishaeformisBleeker) and the significance for prupagation in Tai Hu Lake.J.Fish.China,8(4): 275-286. (in Chinese with English abstract)
Zambrano L, Valiente E, Vander Zanden M J. 2010. Stable isotope variation of a highly heterogeneous shallow freshwater system.Hydrobiologia,646(1): 327-336.
Zhou Q, Xie P, Xu J, Liang X F, Qin J H, Cao T, Chen F Z.2011. Seasonal trophic shift of littoral consumers in Eutrophic Lake Taihu (China) revealed by a two-source mixing model.Sci.WorldJ.,11: 1 442-1 454, https://doi.org/10.1100/tsw.2011.134.
猜你喜歡
Chinese Physics B(2022年4期)2022-04-12 03:45:02
Chinese Physics B(2021年10期)2021-10-28 07:17:34
Chinese Physics B(2021年4期)2021-05-06 08:55:52
故事會(藍版)(2020年10期)2020-10-19 23:06:28
鴨綠江·下半月(2020年6期)2020-08-14 13:03:48
Plasma Science and Technology(2020年3期)2020-04-24 05:50:06
知音·下半月(2020年1期)2020-03-02 11:36:04
Chinese Physics B(2019年8期)2019-08-16 01:20:46
知音·下半月(2019年7期)2019-07-30 01:53:38
婚姻與家庭·性情讀本(2017年2期)2017-03-09 14:51:25
 Journal of Oceanology and Limnology2018年2期
- Journal of Oceanology and Limnology的其它文章
- Editorial Statement
- Hydroacoustic estimates of fish biomass and spatial distributions in shallow lakes*
- A comparison between benthic gillnet and bottom trawl for assessing fish assemblages in a shallow eutrophic lake near the Changjiang River estuary*
- Morphological beak differences of loliginid squid, Uroteuthis chinensis and Uroteuthis edulis, in the northern South China Sea*
- Muelleria pseudogibbula, a new species from a newly recorded genus (Bacillariophyceae) in China*
- Planaxidae (Mollusca, Gastropoda) from the South China Sea*