
TRISim: A Triage Simulation System to Exploit and Assess Triage Operations for Hospital Managers- Development, Validation and Experiment -
2017-03-13 05:46:50KobayashiSuginumaFuruichi
A. Kobayashi, K. Suginuma, M. Furuichi
1 Introduction
When a large-scale disaster occurs, patients with different emergency levels are accepted by the same hospital for treatment and diagnosis. Therefore, the emergency control of the medical operations is crucial. When the number of patients exceeds the hospital’s capacity, it is impossible to rescue all patients through regular medical treatment. Medical organizations must have management criteria for such situations and should follow their national standard for triage systems. Examples of national standards are Japan Triage Acuity Scale (JTAS) [Japanese Association for Acute Medicine (2012)]or Emergency Severity Index (ESI) [Agency for Healthcare Research and Quality (2011)],Manchester Triage System (MTS) [Santos (2014)], or Canadian Triage and Acuity Scale(CTAS) [Murray (2004)]. Such standards are defined for emergency situations to assign treatment priorities to the patients based on the severity of their injuries; the patients who are seriously injured can receive the best medical treatment under the constraints of the medical environment.
In general, each hospital studies a triage operation method based on its local triage standards. The method is examined by changing the triage method or the criteria and urgency levels and by employing former triage results [Kizawa (2012)]. Such results are particularly important for hospital managers who are responsible for planning and designing the triage systems of their hospitals. Many studies have been conducted that simulate triage systems using queueing models. The results of these studies show the waiting times and the nursing quality [Di (2014); Akcali (2006); Au-Yeung (2006);James (2011); Hajnal (2015)]. Other studies used multi-agent-based simulations and derived data such as emergency patient waiting time [Schaaf (2014); Halim (2014);Annamalai (2012); Taboada (2014); Ashok (2008); Spencer (2008)]. These studies revealed the need for more precise simulations. Other research works studied triage protocols through multi-agent-based simulations using ESI [Paula (2013)], MTS [Schaaf(2014)], CTAS [Halim (2012)], and the standard triage protocols of each country[Annamalai (2012); Taboada (2014)]. Previous multi-agent-based simulations are almost the same as the simulations with standard triage protocols of countries outside Japan.Since a triage simulation based on the JTAS protocol does not exist, there were not performed to analysis and evaluation of the triage operation for Japanese hospital. In addition, we assume that the number of patients that pass away in the emergency department of the hospital is not negligible. Therefore, we need to consider the death rate and survival probability. However, in previous studies, the death rate was not considered[Schaaf (2014); Halim (2014); Annamalai (2012); Taboada (2014)], or it was considered,but its calculation method was unclear [Paula (2013)].
Triage is judged based on the patient’s trauma status, vital signs, and Glasgow coma level [Japanese Association for Acute Medicine (2012)]. A previous study did not judge the patients’ triage emergency levels but generated patients based on the distribution of the triage emergency levels in hospitals [Schaaf (2014)]. Another study judged the triage emergency levels, but only considered the vital signs and not the trauma status and Glasgow coma levels [Paula (2013)]. These results indicate that a multi-agentbased simulation of hospital triage alone is not sufficient to study and analyze a hospital’s triage operation method in detail.
In our study, we developed a multi-agent simulation system called TRISim.TRISim improves the before mentioned issues and provides the hospital managers with a means to study the triage operation methods. We assume that a Japanese hospital uses the JTAS as the triage protocol. For calculating the death rate, we employ the TRISS(Trauma Revised Injury and Severity Score) [Boyd (1987)] model, which was assessed by various research works [Siritongtaworn (2009)]. In our study, we also judge the triage emergency levels and perform an accurate simulation based on trauma status, vital signs,and Glasgow coma levels. We argue that TRISim allows us to study, analyze, and evaluate the triage operation method of the JTAS protocol.
2 Overview of the TRISim conceptual model
Our prototype system is intended to be used by hospital managers. The concept of the system is shown in Fig. 1.
In Japan, a doctor or a triage nurse judges the emergency levels of the patients based on the JTAS. Patients are operated on or treated according to their emergency levels. The patients who stay in the hospital after an operation are provided emergency medical treatment or are simply examined by a doctor. Finally, the patients are discharged from the hospital. TRISim simulates these processes by simulating all entities such as patients,doctors, and nurses through a multi-agent-based simulation. In this paper, we provide an overview of our system and present the evaluation and validation results.
3 Triage system model in an emergency department
Fig. 2 shows a model of an emergency department in TRISim. In the consultation room, the patients are diagnosed. In the operation room, surgeries are performed to cure a patient. The emergency room is the room where high-emergency patients are operated on.Low-emergency patients are being monitored in the observation room, while highemergency patients are being monitored in the injury severity observation room. In the intensive care unit (ICU), high-emergency patients are taken care of until their condition is stable, while in the high care unit (HCU), low-emergency patients than emergency of patients in ICU are taken care of until their condition is stable. A patient’s body status is examined in the X-ray room. In the computed tomography (CT) room and the magnetic resonance imaging (MRI) room, a patient’s body status can be examined in detail. The status of the blood vessels and blood fluid is examined in the angiography room. In the following sections, we describe the component models of our emergency department model in more detail.
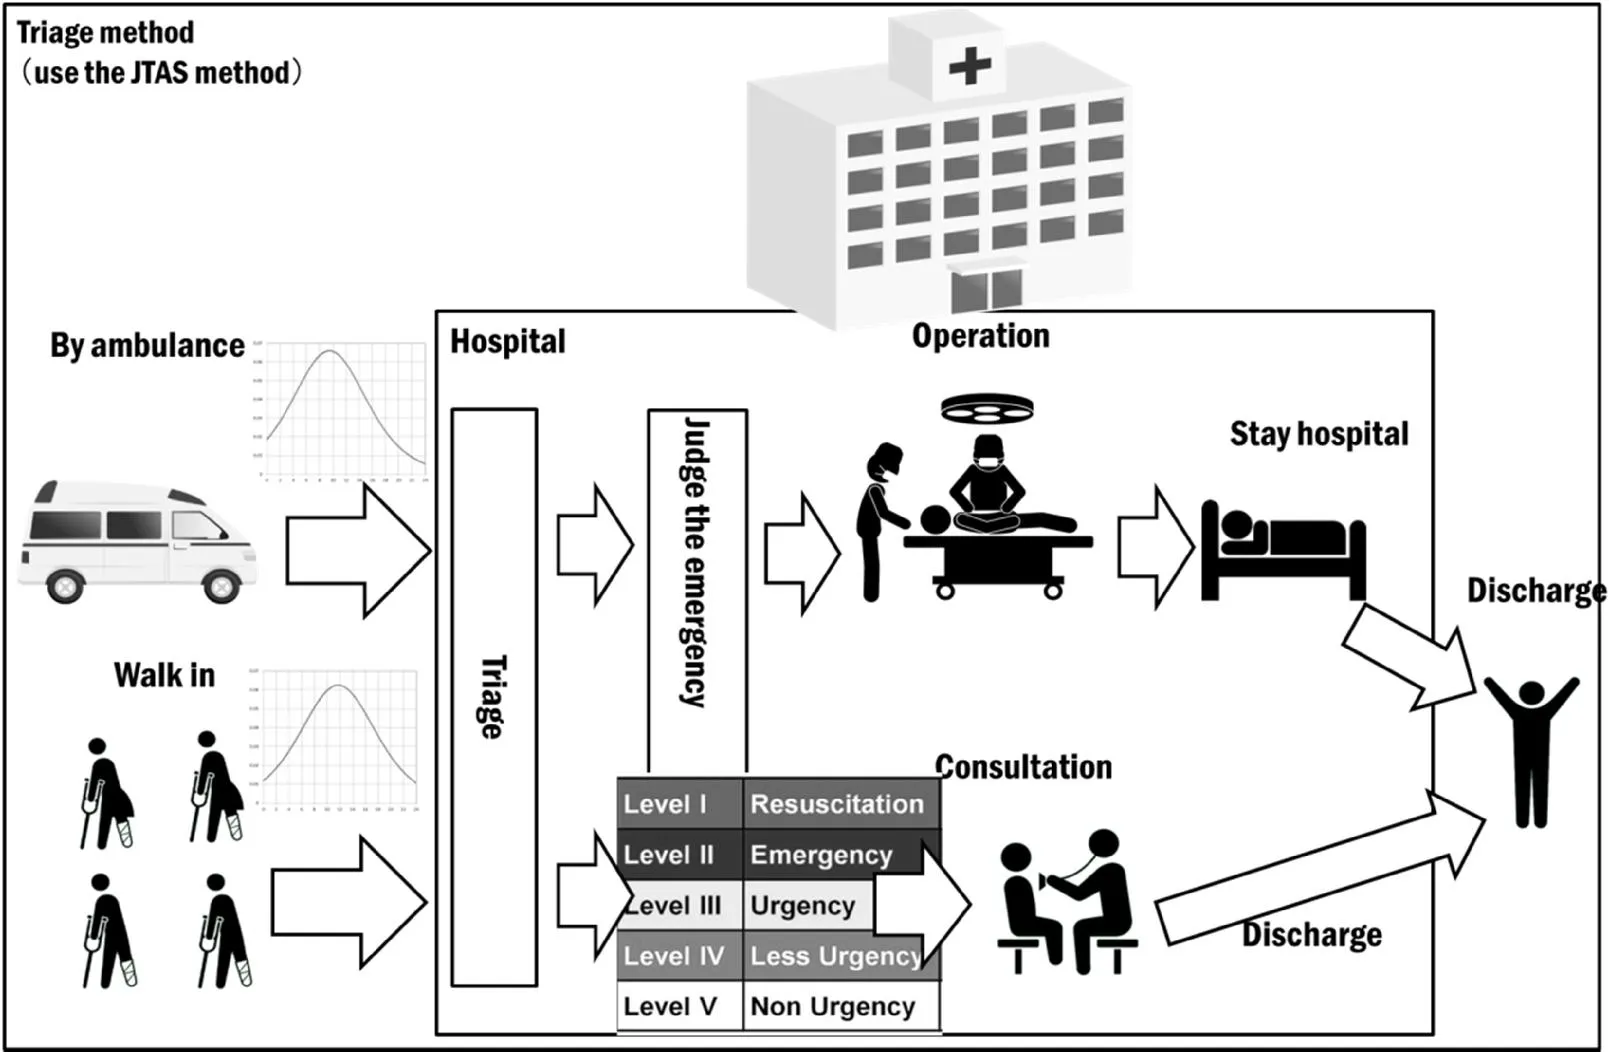
Figure 1: Overview of the TRISim conceptual model
3.1 Waiting room model
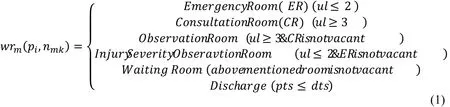
The waiting room model is expressed by Eq. 1. Patients walking into the emergency department or arriving by ambulance are examined by a doctor or a triage nurse. The method of arrival such as walking in or arriving by ambulance is also considered when calculating the density. After their arrival, a triage nurse or a doctor decides on the urgency levels of the patients. There are five different urgency levels, namely Resuscitation, Emergency, Urgency, Less-Urgency, and Non-Urgency.
After a patient is assigned an urgency level, the patient is moved to an observation room, a consultation room, or an emergency room depending on the required treatment. If no emergency room is vacant, patients need to wait in the injury severity observation room until an emergency room becomes available.
If no emergency room or severity injury observation room is vacant, even patients with an emergency level higher than Emergency need to wait in the waiting room.Patients with an urgency level Urgency, Less-Urgency, or Non-Urgency are moved to the consultation room. If the consultation room is not vacant, they need to wait in the observation room until the consultation room becomes available. Patients with an urgency level lower than Urgency wait in the waiting room if no consultation or observation room is available. The consultation room doctor decides if a patient can be discharged.
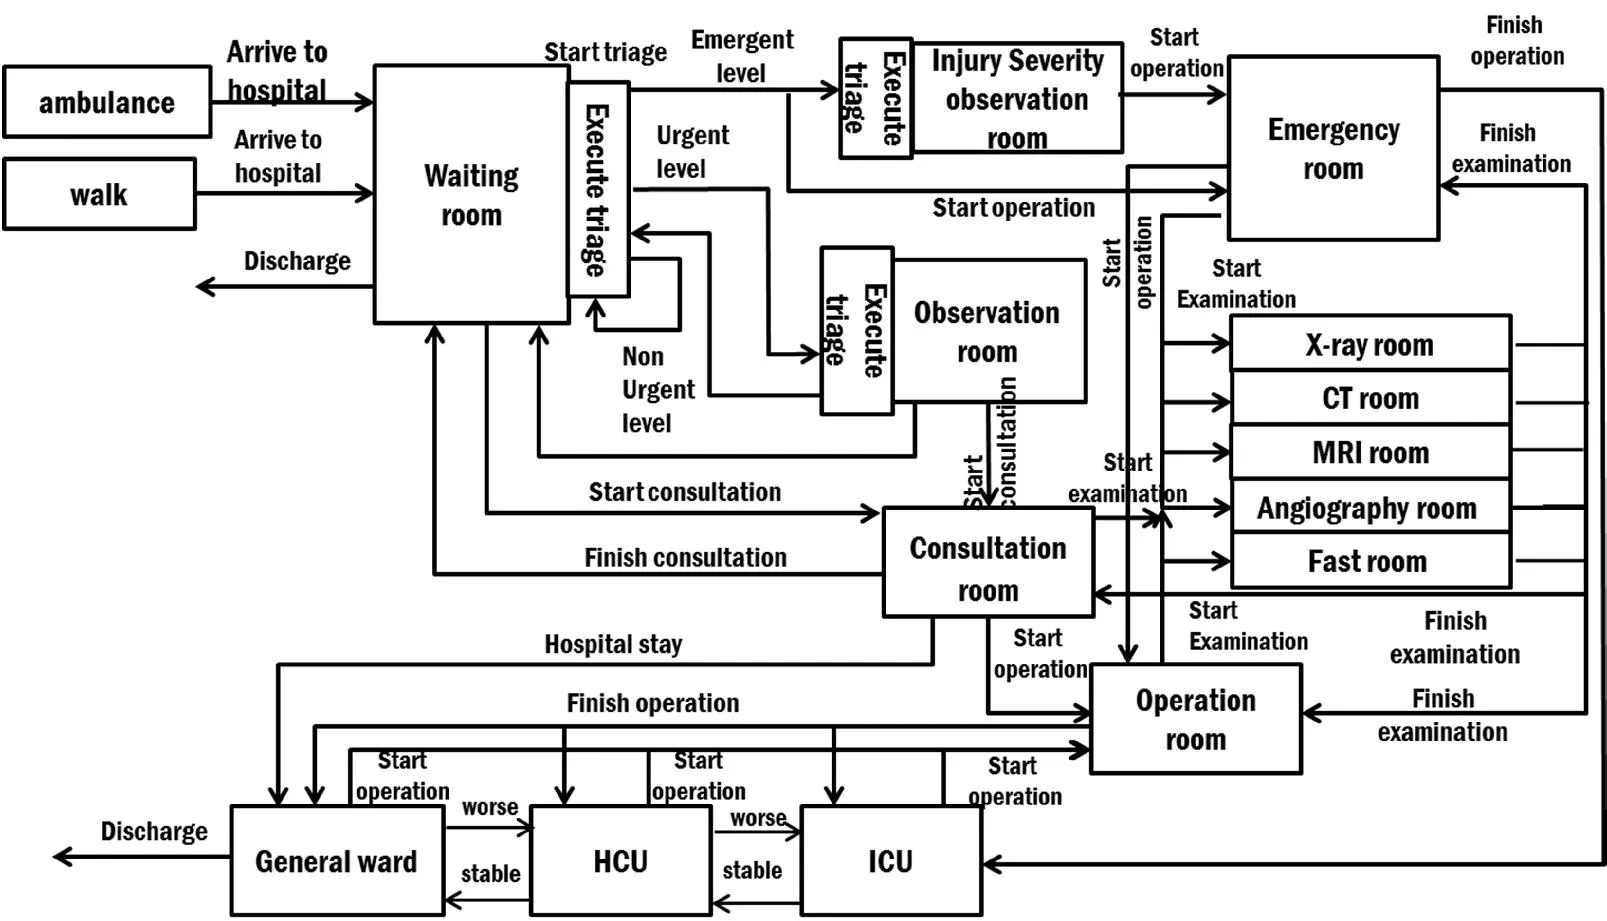
Figure 2: TRISim system model
3.2 Injury severity observation room model
The injury severity observation room model is expressed by Eq. 2. The nurse agents who are assigned to this room periodically triage the patients that enter the room.If emergency rooms are available, the patients are moved to them. Otherwise, they need to wait in injury severity observation room until an emergency room becomes available.

3.3 Emergency room model
The emergency room model is expressed by Eq. 3. The doctor agents who are assigned to this room examine the patient agents that enter the room and perform operations on them. After the operation, a patient is moved to the ICU. If the ICU is not vacant, the patient is moved to the HCU. If the HCU is not vacant, the patient is moved to the General Ward. A clinical engineer agent examines a patient agent as needed.

3.4 ICU model
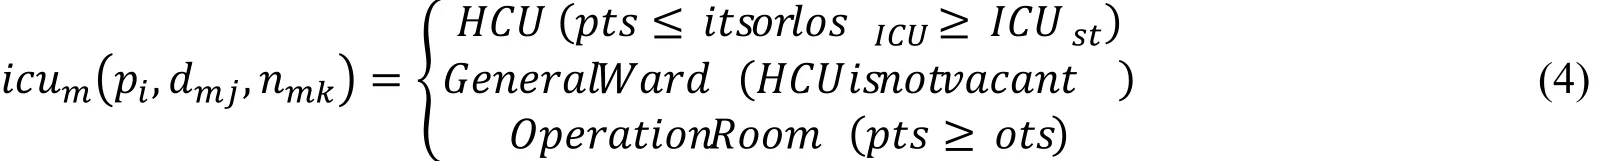
The ICU model is expressed by Eq. 4. Patient agents that enter this room gradually recover from their trauma status. We choose the healing method to recover from the trauma status based on statistical data with a geometric series to minimize the length of the hospital stay [Ministry of Health (2013)]. Patient agents are moved to the HCU when their trauma status is below a certain threshold. If the HCU is not available, the patient agents need to wait in the ICU. They are moved to an operation room if their trauma status is above a certain threshold.
3.5 HCU model
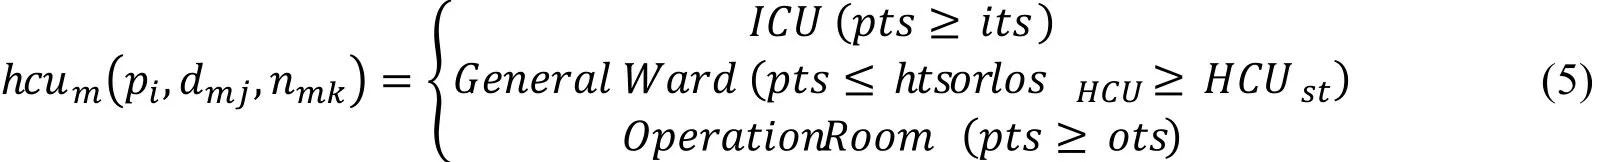
The HCU model is expressed by Eq. 5. Patient agents that enter this room gradually recover from their trauma status by being treated in the ICU. They stay in the ICU as long as their trauma status is above a certain threshold. In case the ICU is not vacant, they need to stay in the HCU. If their trauma status falls below the threshold, they are moved to a General Ward. If their trauma status exceeds a certain threshold, they are moved to an operation room.
3.6 General ward model
The General Ward model is expressed by Eq. 6. By receiving treatments in the ICU and HCU, the patient agents gradually recover. They are moved to the HCU when their trauma status is above a certain threshold. They are discharged when their trauma status falls below the threshold. If their trauma status exceeds a certain threshold, they are moved to an operation room.

3.7 Observation room model
The observation room model is expressed by Eq. 7. The nurse agents who are assigned to this room periodically triage patients that enter this room. If consultation rooms are vacant, the patients are moved to them. Otherwise, they need to wait in the observation room until a consultation room becomes available.
3.8 Consultation room model
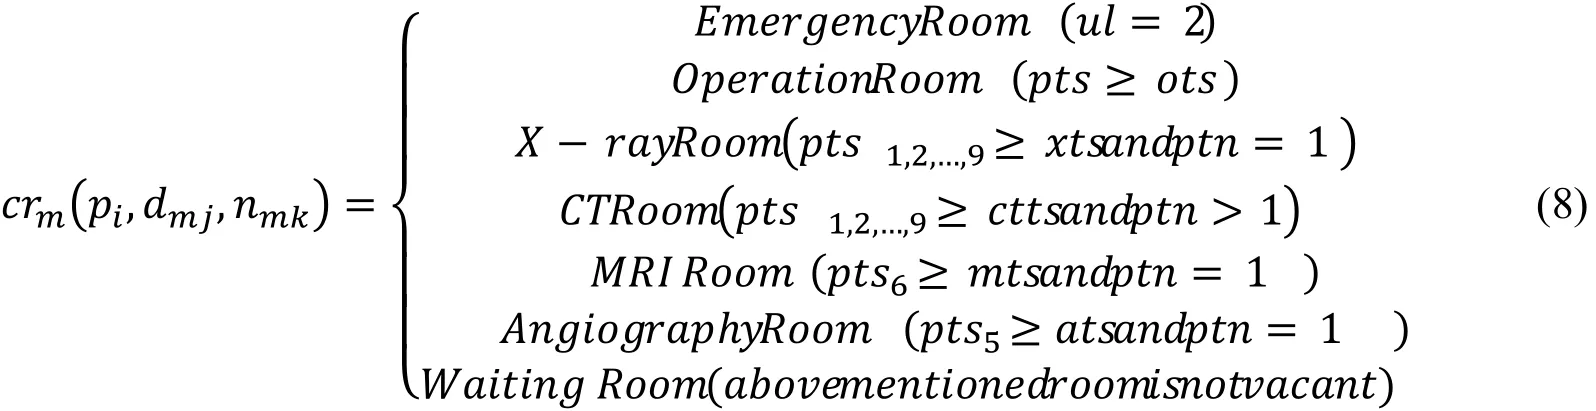
The consultation room model is expressed by Eq. 8. A doctor agent diagnoses the patient agents that enter this room. Depending on the urgency level, the patients are moved to the emergency room, to an operation room, or to an examination room. In case no examination, operation, or emergency room is available, they are moved to the waiting room.
3.9 Operation room model
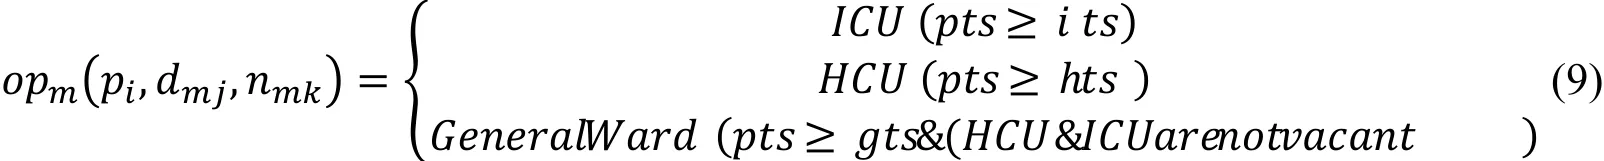
The operation room model is expressed by Eq. 9. Doctor agents operate on patient agents that enter this room, and the patients recover from their trauma status depending on the type of operation and the body part that was affected. Depending on the severity of their condition after the operation, the patients are then moved to the ICU, HCU, or General Ward.
3.1 0 Examination room model
The examination room model is expressed by Eq. 10. A clinical engineer agent who is assigned to this room examines the severity of the trauma of the patient agents that enter this room on the request of a doctor agent. The patients are moved to the consultation room after the examination. If no consultation room is available, they need to wait in the waiting room. In our study, an examination room can be an X-ray room, CT room, MRI room, or an angiography room.

4 Agent model for an emergency department
In TRISim, patients, doctors, nurses, and clinical engineers are represented as agent models. A clinical engineer examines a patient’s condition with medical tests such as X-ray, CT, MRI, and angiography.
4.1 Patient agent model
Fig. 3 shows a patient agent model. The patient agent model is expressed by Eq. 11.
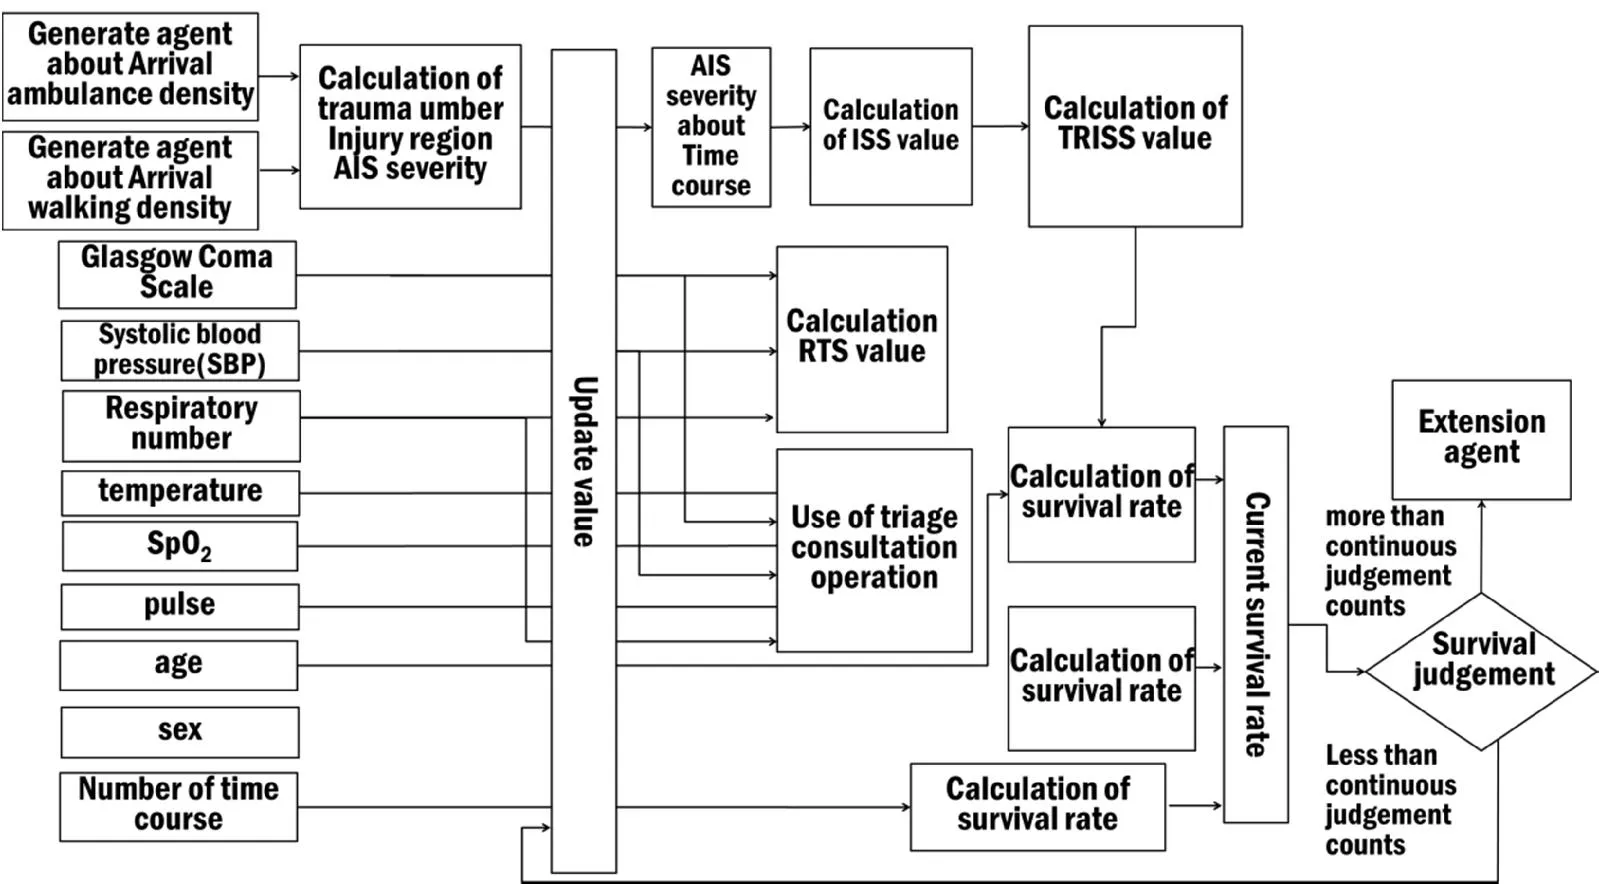
Figure 3: Patient agent model

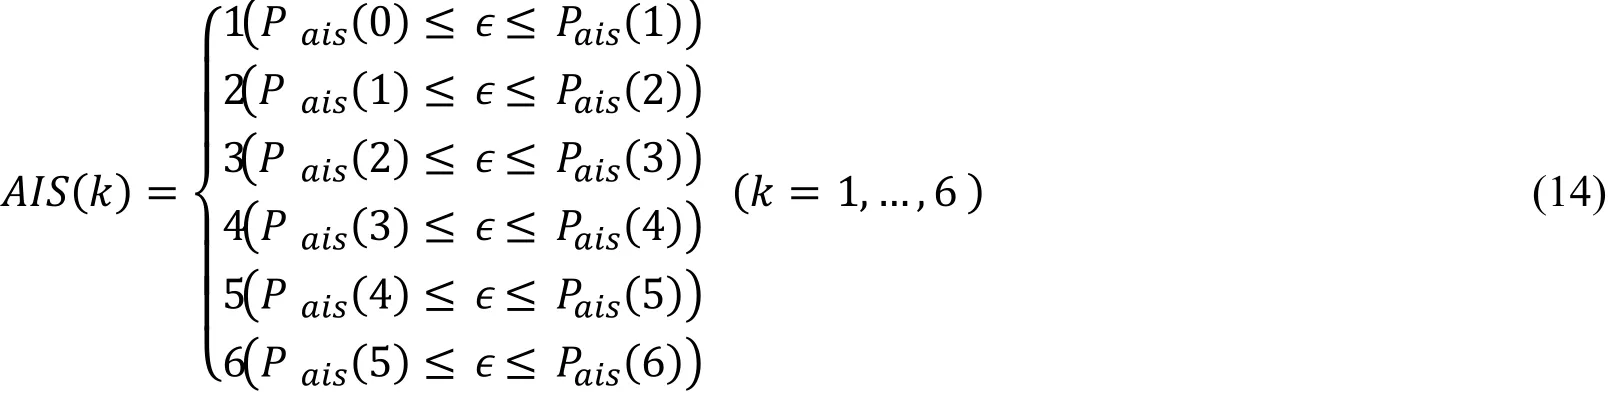
Upon arrival at a hospital, the patient agents are assigned numbers for their trauma regions and the severity of their injuries. The numbers for the regions and severity are determined based on the Abbreviated Injury Scale (AIS). The AIS is based on the kind of trauma and the anatomical severity. The AIS distinguishes nine different body regions,namely head, face, neck, thorax, abdomen, spine, upper extremity, lower extremity, and unspecified region. It distinguishes six levels for specifying the severity of an injury,namely Minor (level 1), Moderate (level 2), Serious (level 3), Severe (level 4), Critical(level 5), and Unsurvivable (level 6). The amount of trauma, anatomical trauma, and severity are calculated with a Weibull distribution based on the statistical data from the Japan Public Trauma Data Bank [Japan Trauma Care and Research (2014)]. The trauma number is given by Eq. 12 and the injury region by Eq. 13. The AIS severity is determined by Eq. 14.

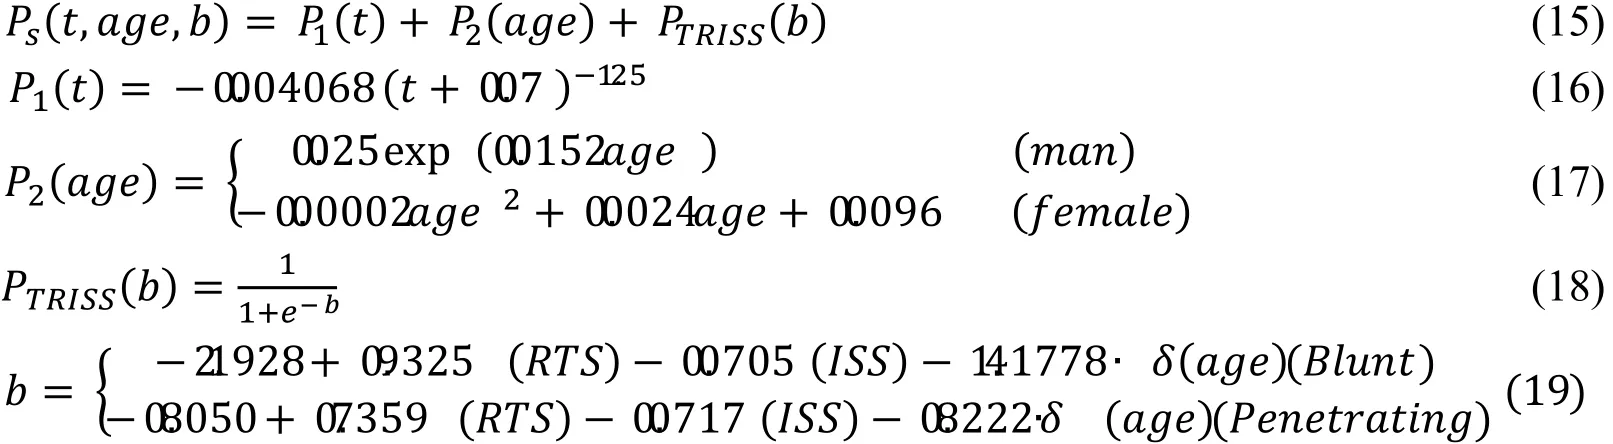
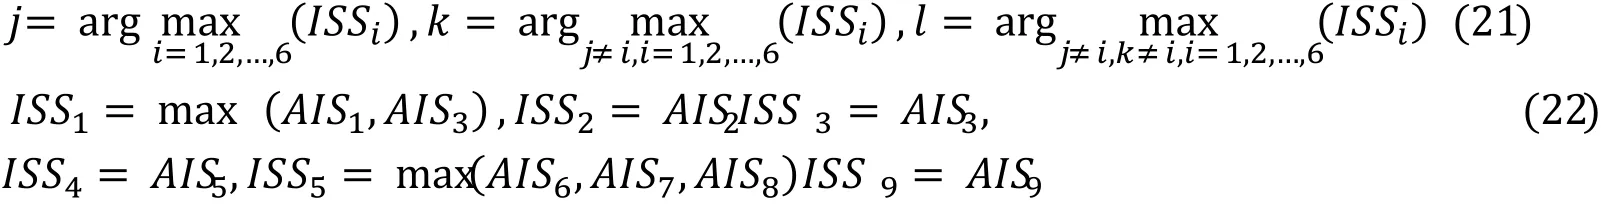
Eqs. 20–22 specify the ISS. The ISS is an anatomical scoring system that provides an overall score for patients with multiple injuries. The ISS is calculated based on the AIS severity. It has a minimum value of 0 and a maximum value of 75. A value of 0 denotes a healthy status, and a value of 75 denotes the highest severity.

Eq. 23 specifies the RTS. RTS is a physiological scoring system with a high interrater reliability and accuracy for predicting death. RTS is calculated through a transformation table based on the GCS (Glasgow Coma Scale), SBP (Systolic Blood Pressure), and RR (Respiration Rate). Tab. 1 shows the transformation table. Each value of GCS, SBP, and RR is mapped to the coded value of Tab. 1. Eq. 19 is calculated based on the coded value of GCS, SBP, and RR. It has a minimum value of 0 and a maximum value of 8.4184. Here, a value of 0 denotes the highest severity, and a value of 8.4184 denotes a healthy state. We use calibrated TRISS and RTS parameters [Naoko (2009)].

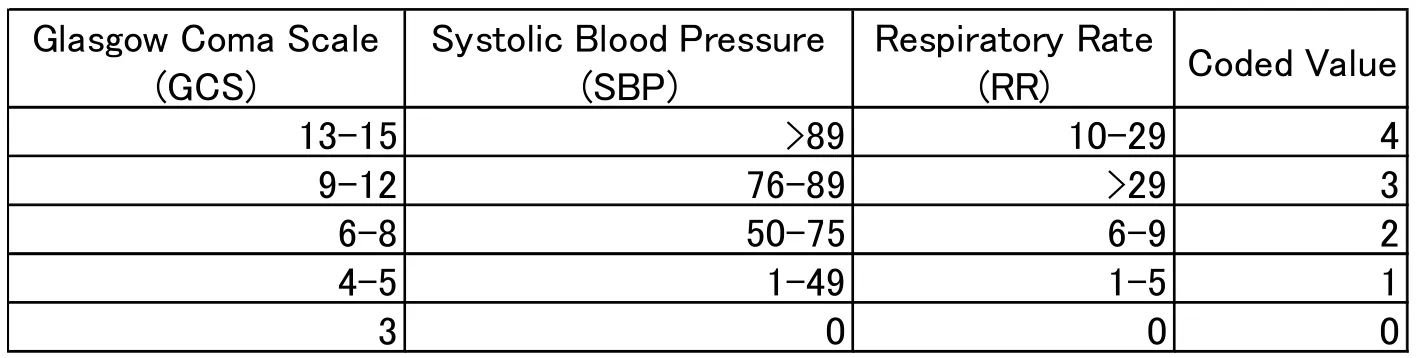
Table 1: The transformation table for GCS, SBP and RR.
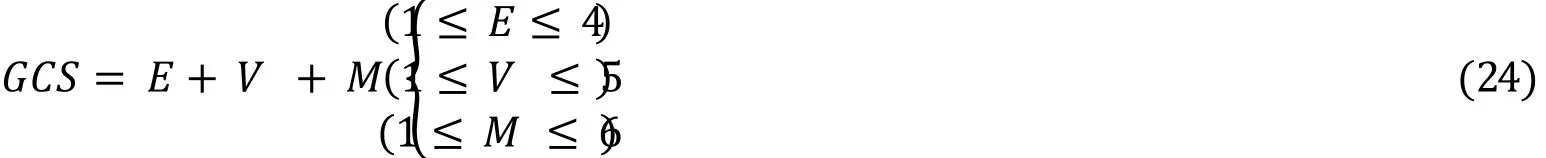
The GCS is specified in Eq. 24. It is the total score of three elements, namely eye opening (E), best verbal response (V), and best motor response (M). A GCS value of 3 denotes the highest severity, a GCS value of 15 means a normal state. For this study, the GCS is uniformly distributed based on research on the occurrence rate of GCS values for head injuries [Healey (2003)].
Tab. 2 shows the vital signs for a normal level and shock levels. Vital signs are respiration, pulse, systolic blood pressure, diastolic blood pressure, and SpO2[Sasaki(2016a); Sasaki (2016b); Shindo (2016)]. In this study, when the AIS value is less than 3,the vital signs are generated from a normal distribution centering around a normal value.When the AIS value is more than 3, the vital signs are generated from a Weibull distribution based on a survey of vital signs and composition of blood associated with the shock level [Mutscher (2013)].
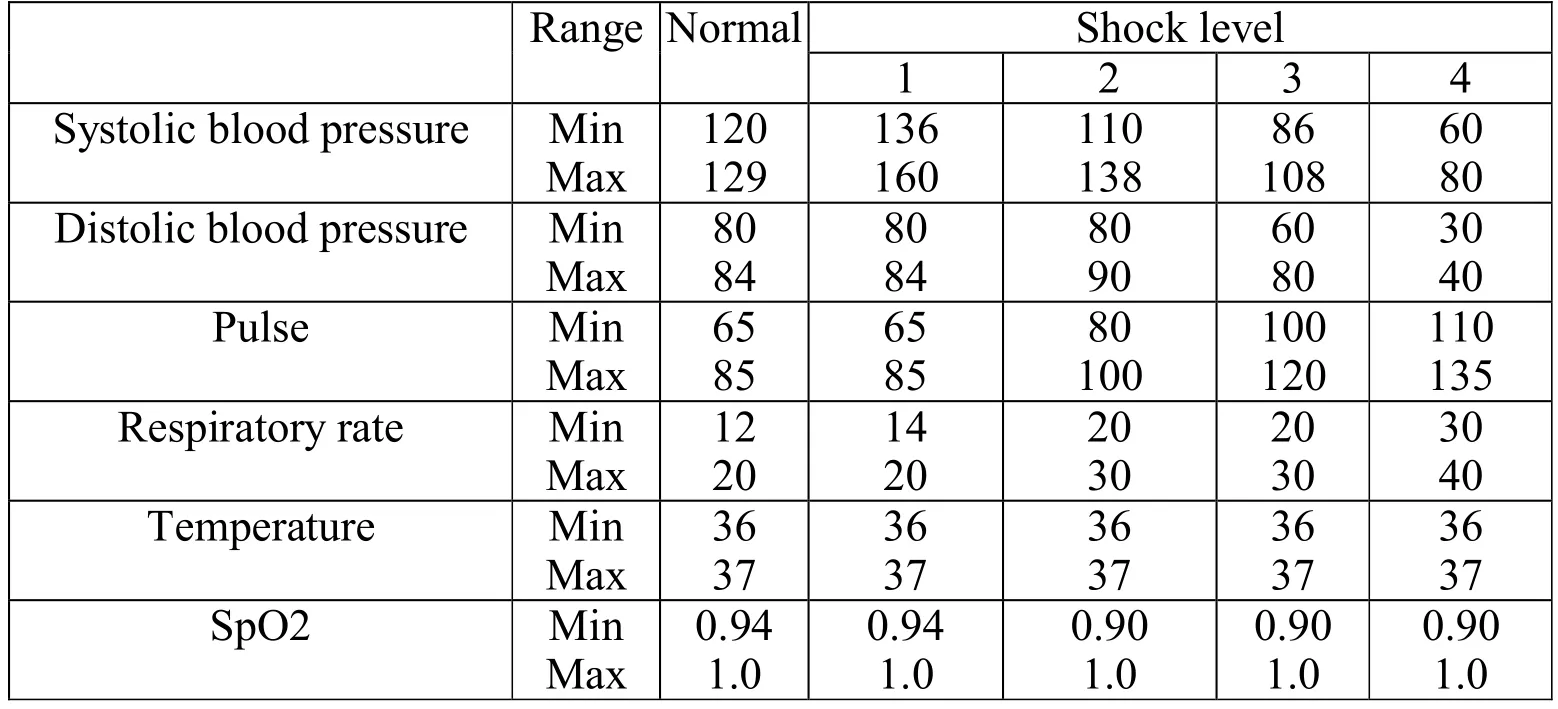
Table 2: Vital sign with respect to normal and shock level
When the patient agents stay in the ICU, HCU, and General Ward, the AIS severity gradually improves according to the algorithm shown in Eq. 25.

4.2 Nurse agent model
Fig. 4 shows our nurse agent model. The nurse agent model is expressed by Eq. 26.

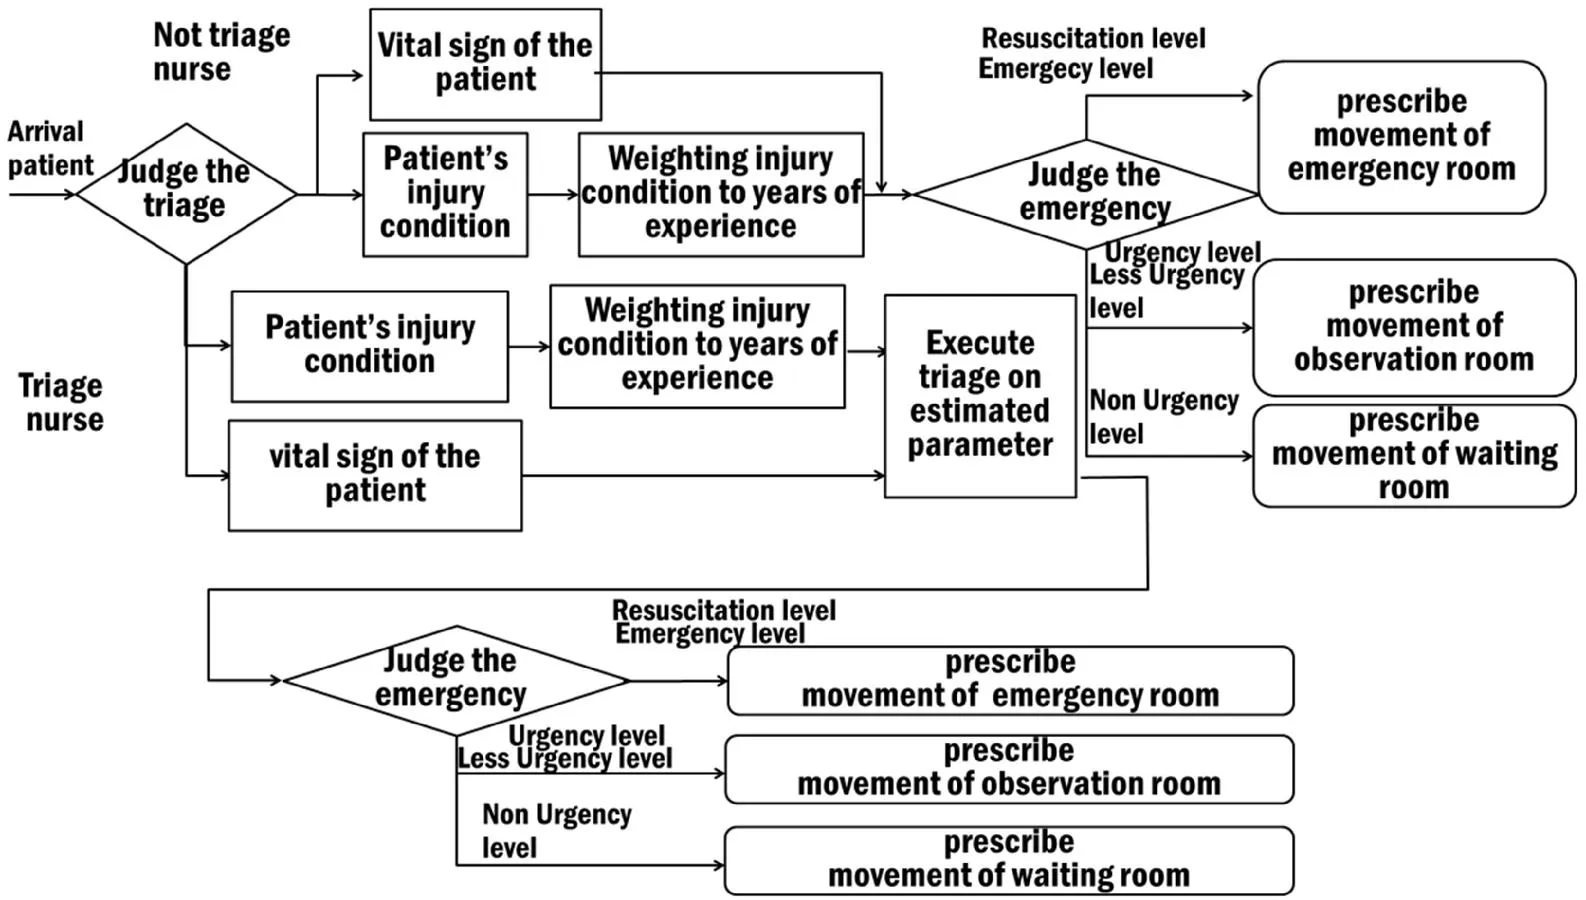
Figure 4: Nurse agent model
There are two types of nurse agents, namely a triage nurse and a normal nurse. A triage nurse assesses the patient agents and decides their urgency level based on the triage method (JTAS). For this, they use the condition, trauma status, respiration, SpO2, body temperature, GCS, patient’s blood pressure, and AIS as input. A nurse agent spends between 20 s and 30 s on a triage based on the JTAS. In the JTAS, the nurse agents triage the patients depending on their urgency level at specific time intervals. If the urgency level is Resuscitation, the nurse agent supports the patient. For an urgency level of Emergency, Urgency, Less-Urgency, or Non-Urgency, the nurse agent triages the patient in intervals of 15, 30, 60, or 120 min, respectively. The AIS severity is selected from uniformly distributed random numbers based on the experience of the nurses. A normal nurse agent assesses the urgency level based on the vital signs and AIS severity. The nurse agents send the triage results to the doctor agents and to other nurse agents. Fig. 5 shows the JTAS algorithm used in this study. The JTAS judges the vital signs, SpO2,circulatory dynamics, consciousness, and temperature. When judging the vital signs, a patient’s emergency level is set to Resuscitation if≥ 140 and≥ 40. Otherwise, the nurse continues with the evaluation. When judging the SpO2, a patient’s emergency level is set to Resuscitation if≤ 0.9. Otherwise,the nurse continues with the evaluation. When judging the circulatory dynamics, a patient’s emergency level is set to Resuscitation if≤ 30 or≥ 140 and≤ 80 and ≤ 30. Otherwise, the nurse continues with the evaluation. When judging the consciousness, a patient’s emergency level is set to Resuscitation if 3≤ GCS ≤ 9.Otherwise, the nurse continues with the evaluation. When judging the body temperature,a patient’s emergency level is determined based on the number of times his or her temperature was either too low or too high (i.e.,38 ), how often the pulse was too high (i.e., t≥ 90), and how often the respiratory rate was too high (i.e.,≥ 20). The urgency level is set to Emergency for a count of 3,to Urgency for a count of 2, to Less-Urgency for a count of 1, and to Non-Urgency for a count of 0. The final emergency level is computed from the result of each judgement.
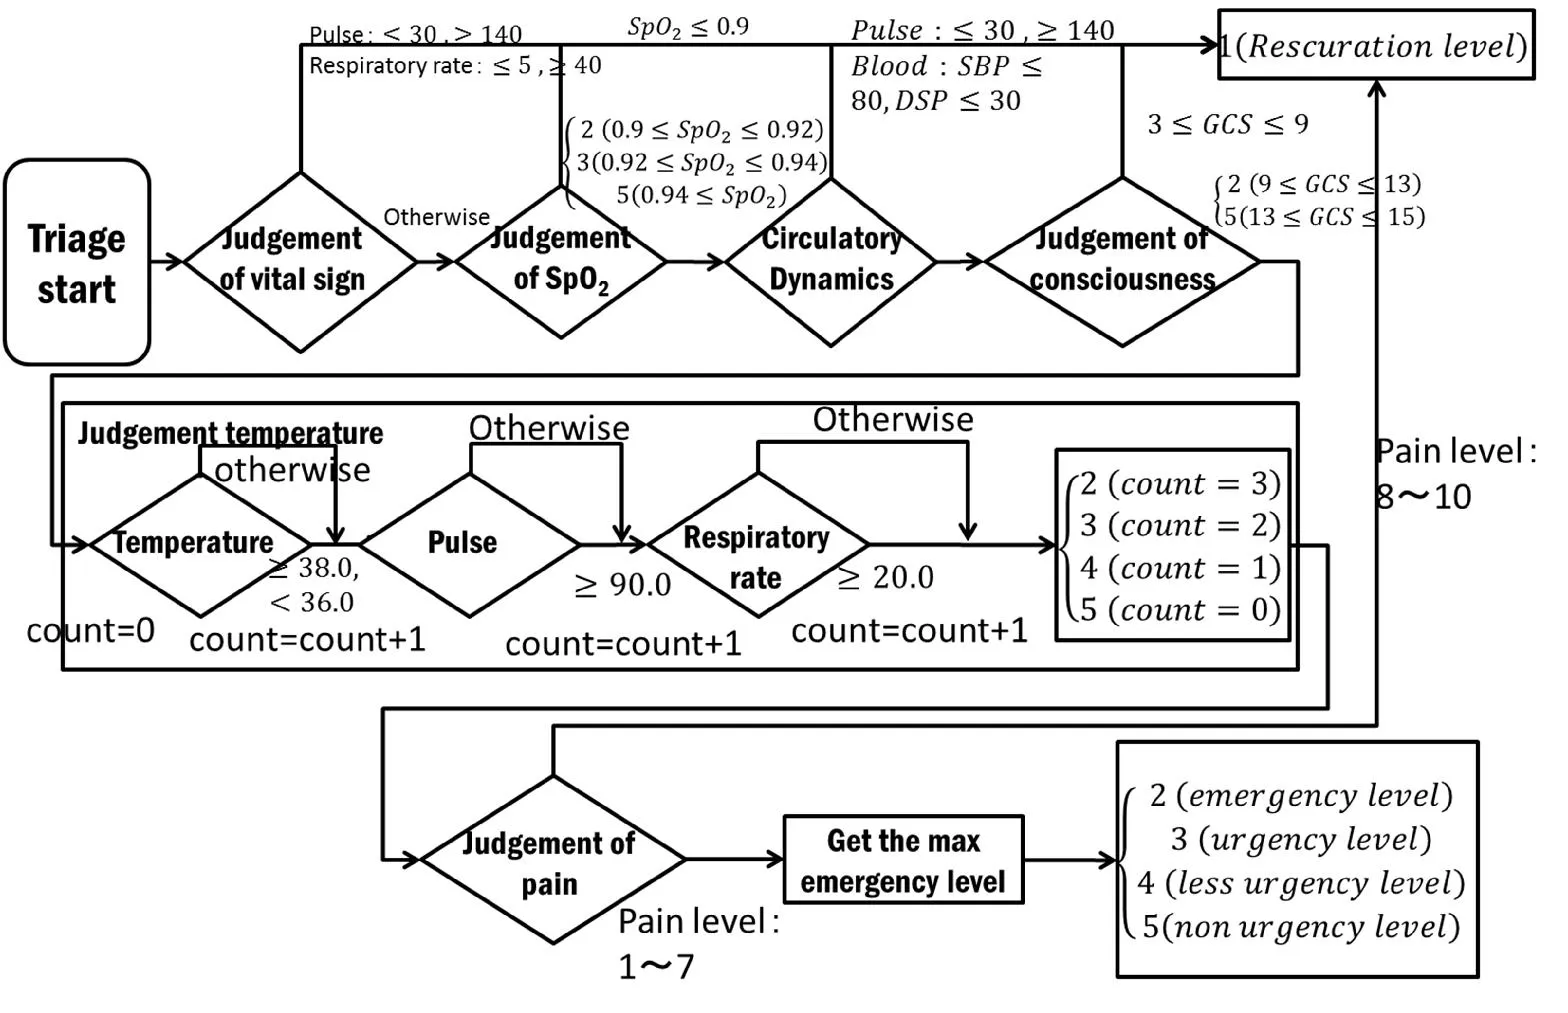
Figure 5: JTAS algorithm
A normal nurse agent judges the trauma severity based on the AIS severity and the vital signs. This algorithm corresponds to the process of judging the vital signs, SpO2,and pain in the JTAS algorithm.
4.3 Doctor agent model
Fig. 6 shows an examination model for a doctor agent. A consultation model for a doctor agent is expressed by Eq. 26.

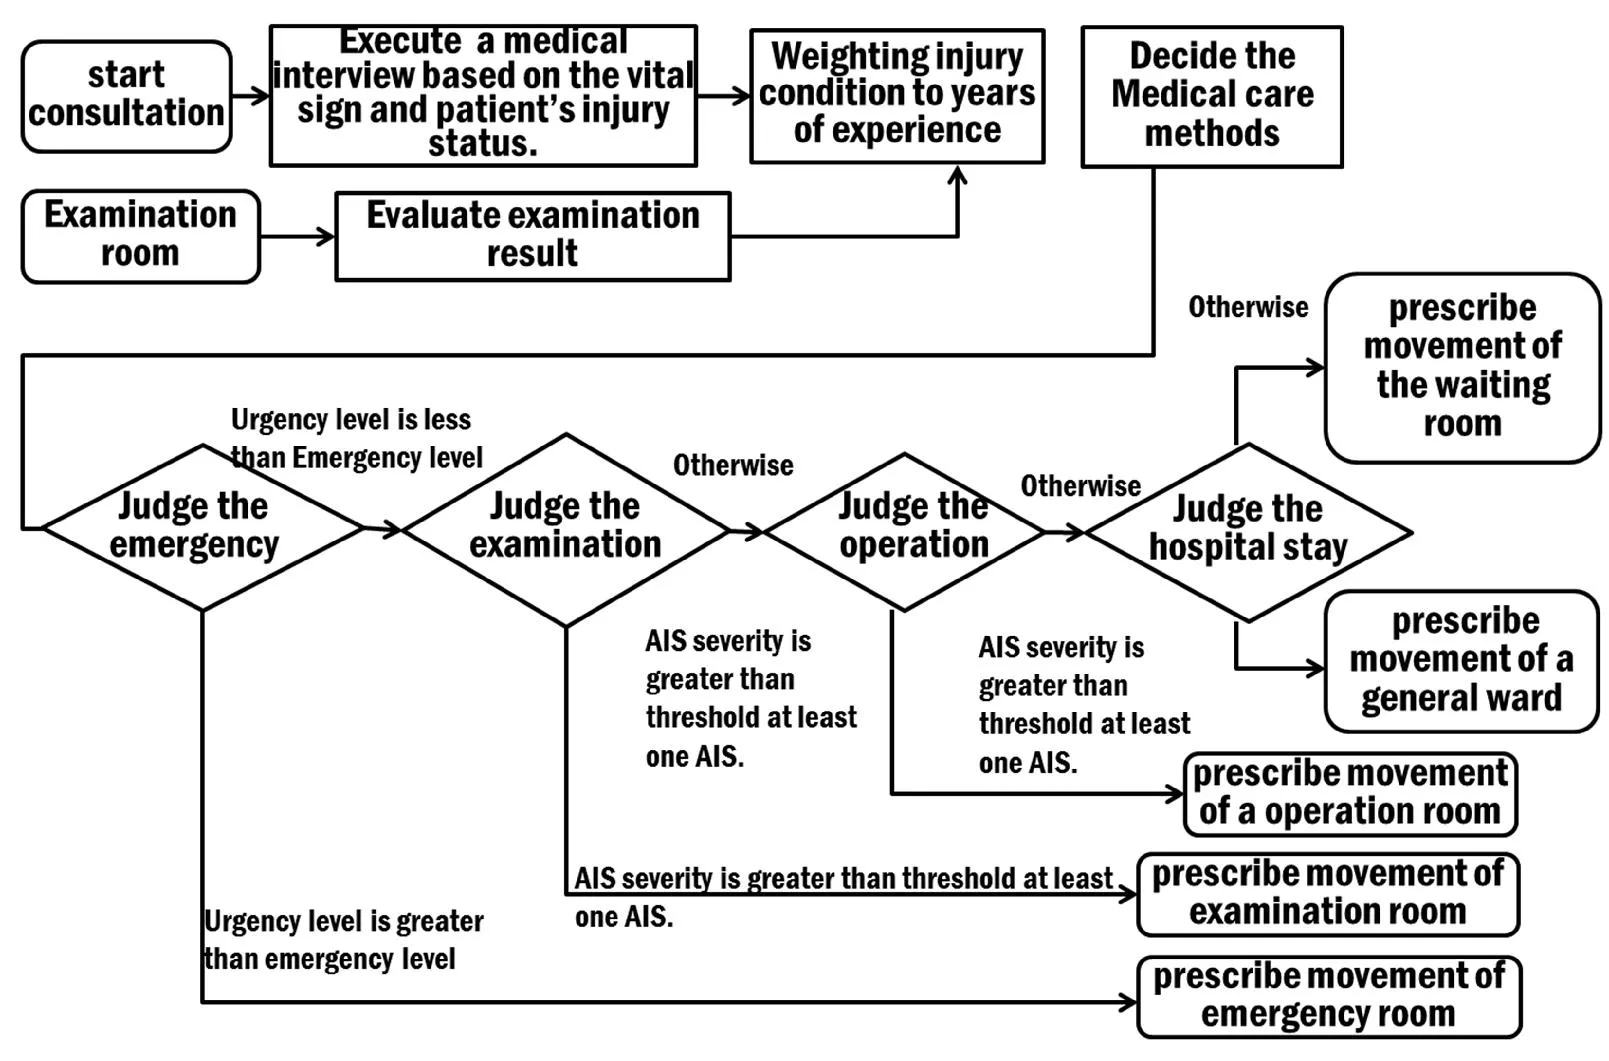
Figure 6: Consultation model for a doctor agent
A doctor agent checks the vital signs and estimates the AIS severity based on a medical interview.
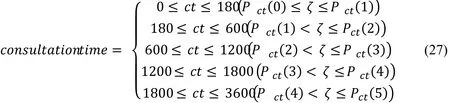
The doctor then obtains the examination result from the examination room. First, a doctor agent assesses the emergency status and checks whether a patient needs to be sent to the emergency room to undergo an operation. A doctor agent then decides based on the AIS severity whether an examination or an operation is required. Finally, the doctor agent assesses based on the AIS severity whether a patient needs to stay in the hospital. In TRISim, the time required for an examination is based on the Patient's Behavior Survey by the Ministry of Health, Labour, and Welfare, Japan (MHLW) [Ministry of Health(2013)]. The consultation time is expressed by Eq. 27.
In addition, we also consider the doctor’s experience in performing surgeries. Fig. 7 shows an operation model for a doctor agent. The operation model is expressed by Eq. 28.
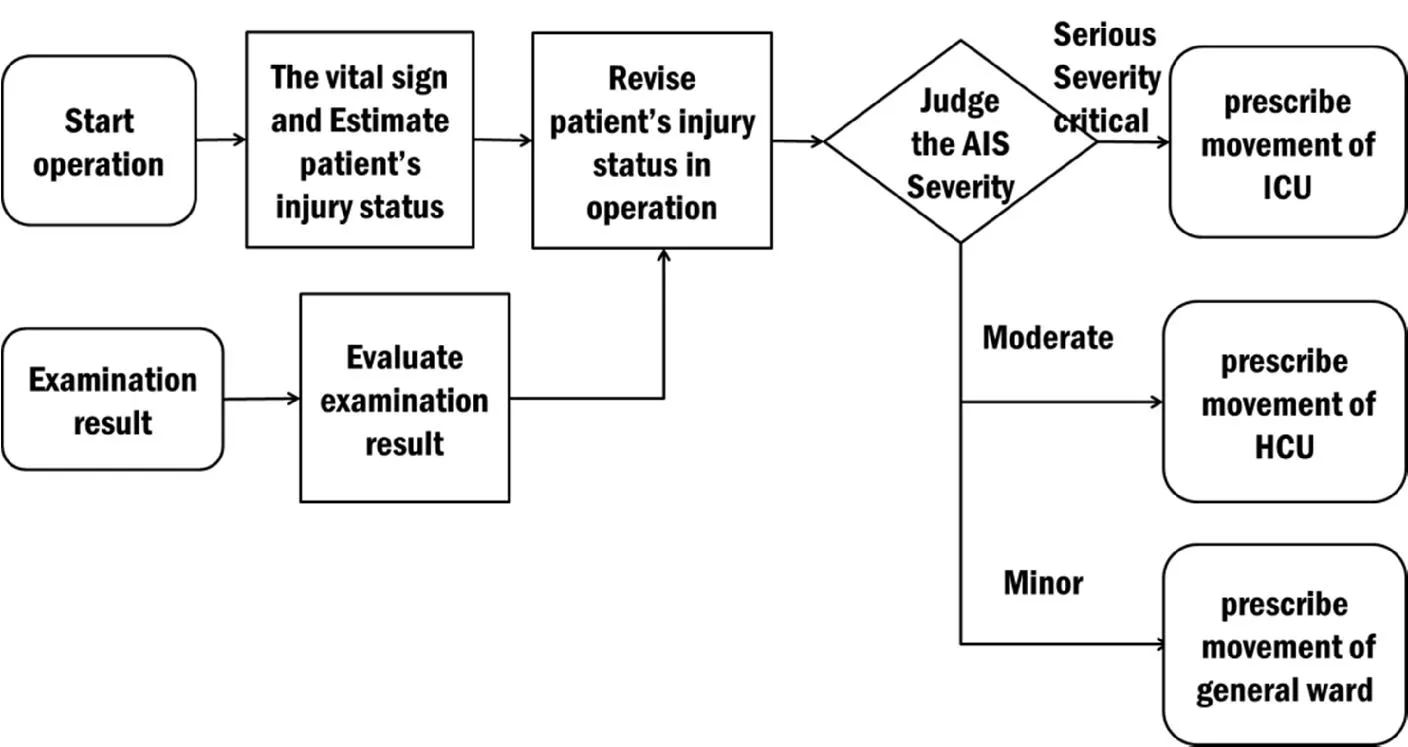
Figure 7: Operation model for a doctor agent
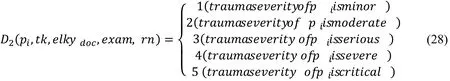
When the patient’s trauma status allows him or her to undergo an operation, the doctor agent assesses the severity and judges whether to send the patient to the ICU,HCU, or General Ward based on patient’s trauma status such as minor, moderate and serious, or severe and critical. The time required for an operation is based on an investigation by the MHLW (Ministry of Health, Labor, and Welfare) [Ministry of Health,Labor and Welfare (2013)]. The operation time is expressed in Eq. 29.

4.4 Clinical engineer agent model
Fig. 8 shows a clinical engineer agent model. A clinical engineer agent performs an examination on the request of a doctor agent. The doctor agent requests an X-ray examination if the patient’s trauma condition is thorax, lower extremity, upper extremity,or unspecified. The doctor agent requests a CT examination if the patient’s trauma condition specifies several injury regions. The doctor agent requests an MRI examination if the patient’s trauma condition is restricted to the spine. The doctor agent requests an angiography examination if the patient’s trauma condition is restricted to the abdomen.After the examination, the clinical engineer agent sends the patient’s examination results to the doctor and nurse agents. The examination time varies. An X-ray scan takes ~10 min, a CT scan takes 10–20 min, an MRI scan takes 20–40 min, an angiography scan takes 60–180 min, and a Fast scan takes 5–10 min [National Cancer Center Hospital East(2017)]. When selecting these times, we consider the experience of the clinical engineers.The process is described by Eq. 30.

5 Triage operation system model
Fig. 9 provides an overview of the triage operation system model. The triage operation system model consists of a normal input block, a TRISim block, an output result block, and an analysis and evaluation block.
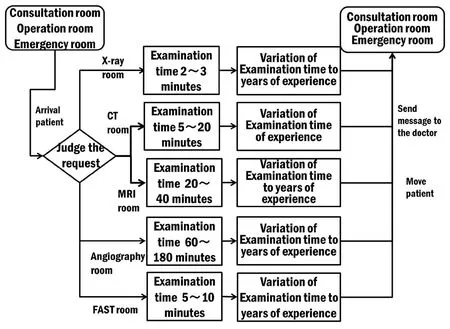
Figure 8: Clinical engineer model
The input parameters consist of the number of rooms and the parameters of the doctor agents, nurse agents, clinical engineer agents, and others, and they are taken from specific hospital model data. At the start of a simulation, these parameters are given to TRISim. TRISim then performs the simulation and outputs the simulation results. The scenario is analyzed and evaluated based on the simulation result. If necessary, the simulation is repeated after updating the model parameters to analyze the simulation in more detail.
6 Validation
To demonstrate the accuracy of the simulation results, we verified the simulation results with the corresponding field data. We used the triage results of the Tsukuba Medical Center [Goto (2013)], the Kyoto City Hospital [Kyoto City Hospital (2014)], and the Kurashiki Central Hospital [Kurashiki Central Hospital (2015)] as real reference data.
6.1 Scenario
We assumed that about 100 patients visit a hospital within one day. We assumed a very large medical center [Hyogo Prefectural Nishinomiya Hospital (2017); Nihon University Hospital (2017); Kyorin University Hospital (2017)] and modeled it in TRISim for the evaluation. In the hospital model, both the emergency and the critical care centers are composed of examination rooms, emergency rooms, waiting rooms, operation rooms, CT rooms, MRI rooms, and angiography rooms. In this scenario, the component agents are doctors, nurses, clinical engineers, and patients. Doctors, nurses, and clinical engineer agents are assigned to the ICUs and HCUs. Clinical engineer agents are assigned to the X-ray rooms, CT rooms, MRI rooms, and angiography rooms. Doctor and nurse agents are assigned to the examination and operation rooms. Nurse agents are also assigned to the observation rooms and the severity injury observation rooms.
6.2 Condition
In this experiment, the conditions were set based on the patient arrival distribution data of the Seirei Hamamatsu General Hospital [Seirei Hamamatsu Hospital (2016)] as a reference. Fig. 10 shows the patient arrival density. The vertical axis of the graphs shows the rate of patients and the horizontal axis shows the time of day starting at 8:30 a.m.
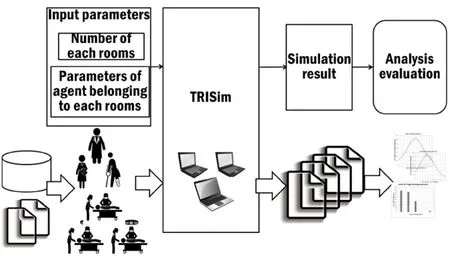
Figure 9: Triage operation system model
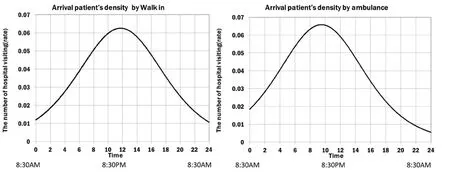
Figure 10: Patient arrival density (field data)
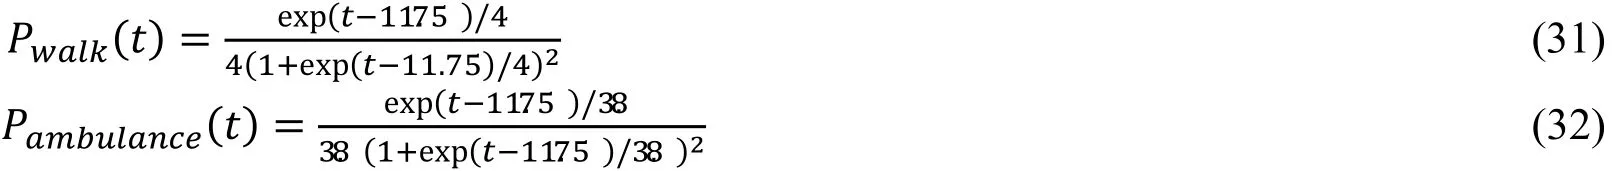
These graphs approximate the real data on the patient arrival density by the logistic density of walk-in patients and patients arriving with an ambulance. Eqs. 31 and 32 show the arrival densities.
Tab. 3 shows the hospital configuration parameters based on the Tsukuba Medical Center.
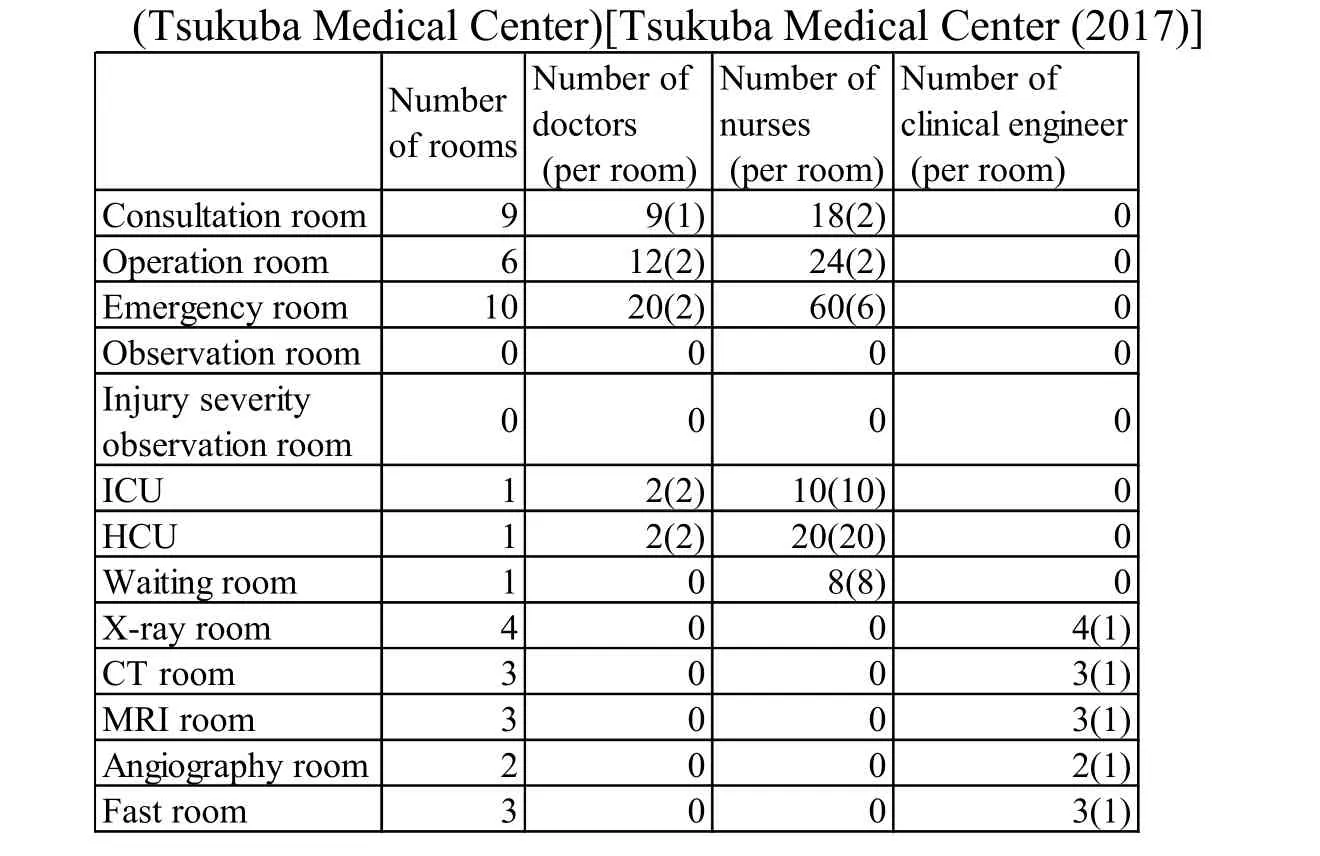
Table 3: Hospital configuration parameters
This table shows the total number of rooms and how many doctors, nurses, and clinical engineers are assigned in total to the different rooms. The number in parenthesis shows the number of agents per room.
In addition, Tab. 4 and Tab. 5 show the configuration parameters of each hospital based on the Kyoto City Hospital and the Kurashiki Central Hospital. In the Kyoto City Hospital, the number of patients arriving is around 75 [Kyoto City Hospital (2017)]. In the Kurashiki Central Hospital, the number of patients arriving is around 180 [Kurashiki Central Hospital (2017)].
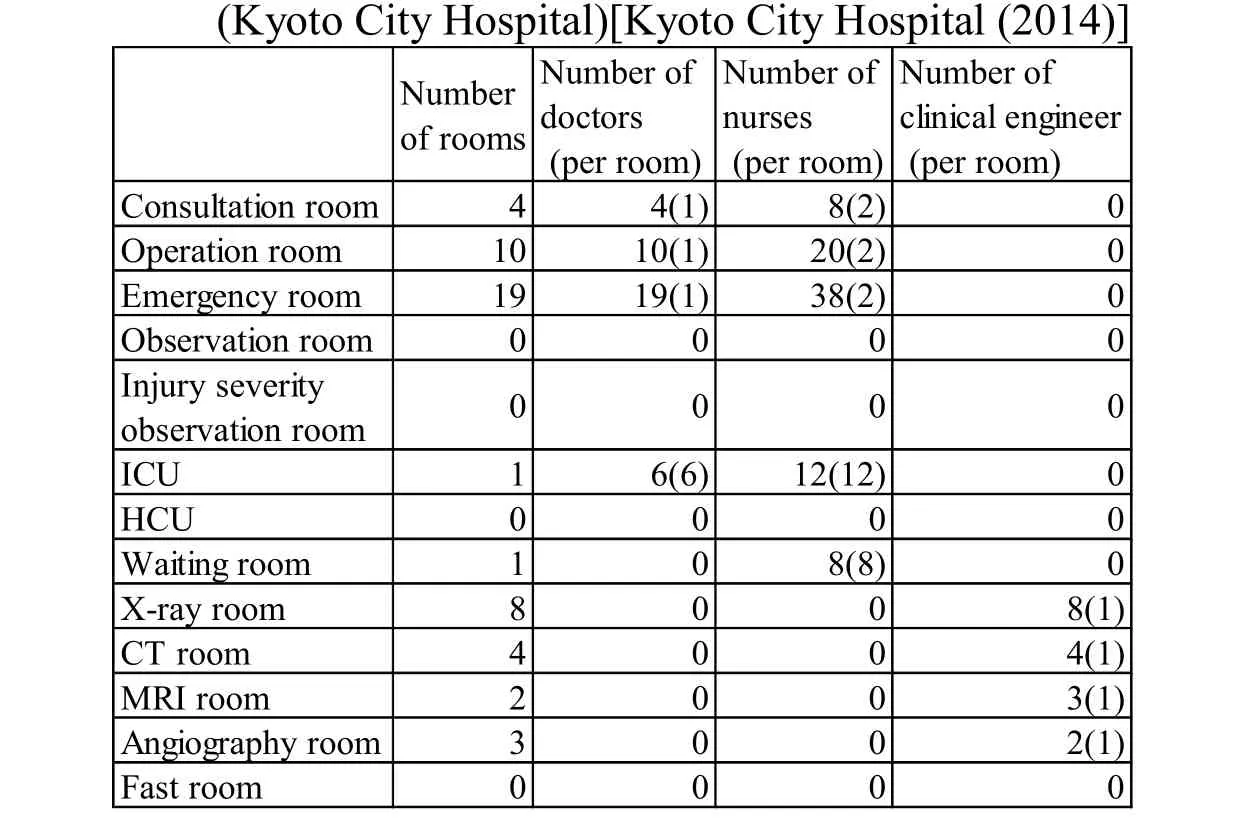
Table 4: Hospital configuration parameters
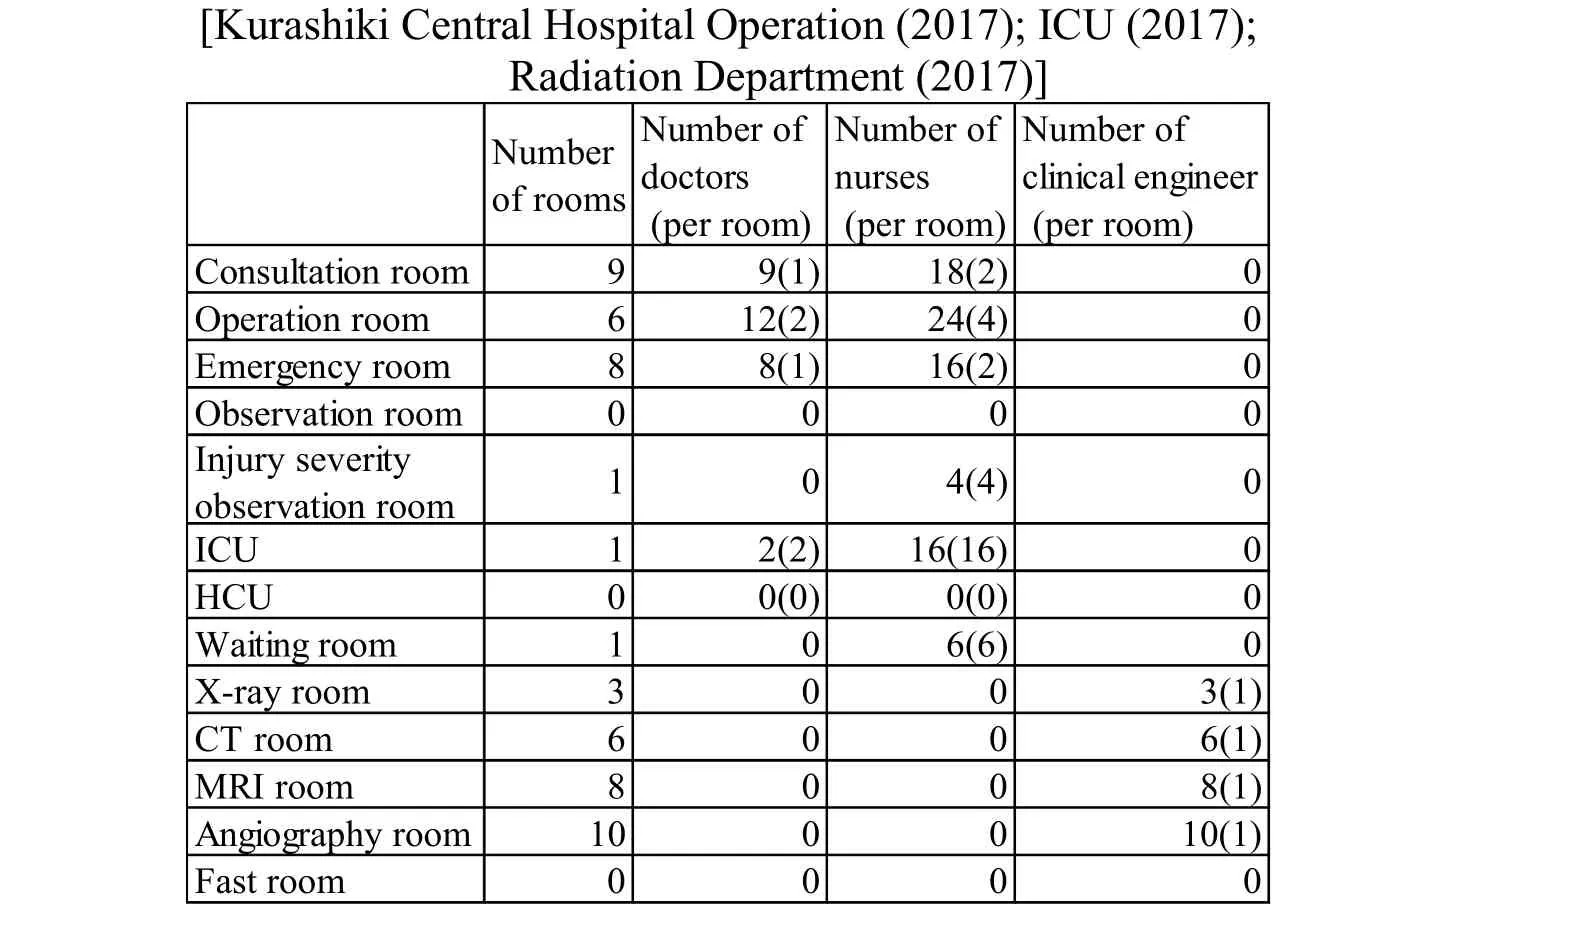
Table 5: Hospital configuration parameters (Kurashiki Center Hospital)
The simulations were performed for one day with a time delta t of 10 s. We repeated the simulation ten times. In the following sections, we present the average of 500 results obtained.
6.3 Result
Fig. 11 shows how many patients were assigned to each triage emergency level in one day. The vertical axis shows the number of judged people. The horizontal axis shows the triage emergency levels. The horizontal axis shows four levels because the triage system of the Tsukuba Medical Center assigns four emergency levels. The black bars show the simulation results and the gray bars show the field data. The field data is the statistical data of six months, and a simulation runs for one logical day. Both the simulation result and the field data of the triage emergency levels (Tsukuba Medical Center) are similar to the tendency.
Fig. 12 shows how many patients per triage emergency level had to stay at the hospital in one day. The vertical axis shows the number of people. The horizontal axis shows the triage emergency levels. The horizontal axis shows four levels because the triage system of the Tsukuba Medical Center assigns four emergency levels. The field data also transform the result of one day into a result for each triage emergency level based on the number of patients that stayed in the hospital. The graphs are similar to the tendency but show a slight difference.
We assume the reason is as follows. In the study, the distribution for calibrating the parameters does not directly generate patients based on the distribution of the number of judged patient and patients that stayed in the hospital with respect to each of the emergency levels, but it generates patients based on the condition distribution of the patient’s trauma status, vital signs, and Glasgow coma level. The doctor and nurse agents judge the triage emergency level based on the patient’s status. However, the result of the validation does not match completely because we lack the condition distribution of the Tsukuba Medical Center for calibrating the parameters. We assume that even small variations can influence the validation results.
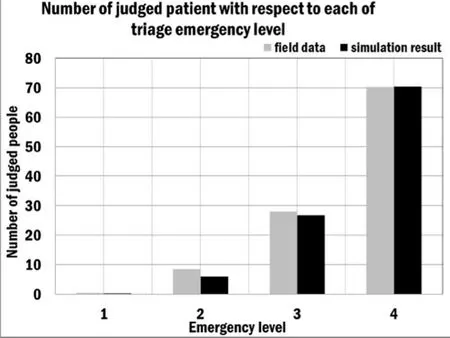
Figure 11: Number of judged patients(with respect to each triage emergency level (Tsukuba Medical Center) )

Figure 12: Number of patients staying in hospital (with respect to each triage emergency level (Tsukuba Medical Center) )
We perform a statistical test to validate whether the TRISim simulation result is consistent with the field data. Our statistical test method employs a goodness of fit test.As the null hypothesis, we judge whether the simulation result equals the field data with respect to the triage emergency levels. The outcome of our statistical test shows that the null hypothesis is not rejected at a significance level of 5%. The test for validating the number of people staying at the hospital for each triage emergency level also employs a goodness of fit test. Again, the hypothesis is not rejected at a significance level of 5%.We conclude that the simulation result is consistent with the field data.
Next, we validate the data of the Kyoto City Hospital. Fig. 13 and Fig. 14 show how many patients were assigned to each triage emergency level and how many patients per triage emergency level had to stay at the hospital. The vertical axis shows the number of people. The horizontal axis shows the triage emergency levels. The horizontal axis shows four levels because the triage system of the Kyoto City Hospital assigns four emergency levels. We perform a statistical test for this data with a goodness of fit test.The outcome of our statistical test shows that the hypothesis is not rejected at a significance level of 5%. To check the fit of the graph in detail, we compare the Tsukuba Medical Center data with the Kyoto City Hospital data. The result indicates a large fitting error for each emergency level. Therefore, the shape of the graph does not match.
Finally, we validate the data of the Kurashiki Central Hospital. Fig. 15 and Fig. 16 show how many patients were assigned to each triage emergency level and how many patients per triage emergency level had to stay at the hospital. The vertical axis shows the number of people. The horizontal axis shows the triage emergency levels. The horizontal axis shows five levels because the triage system of the Kurashiki Central Hospital assigns five emergency levels. The tendency of the shape of the graph is different. In particular,the figure of emergency level 4 and emergency level 5 is different. Therefore, the shape of the graph and the tendency do not correspond.
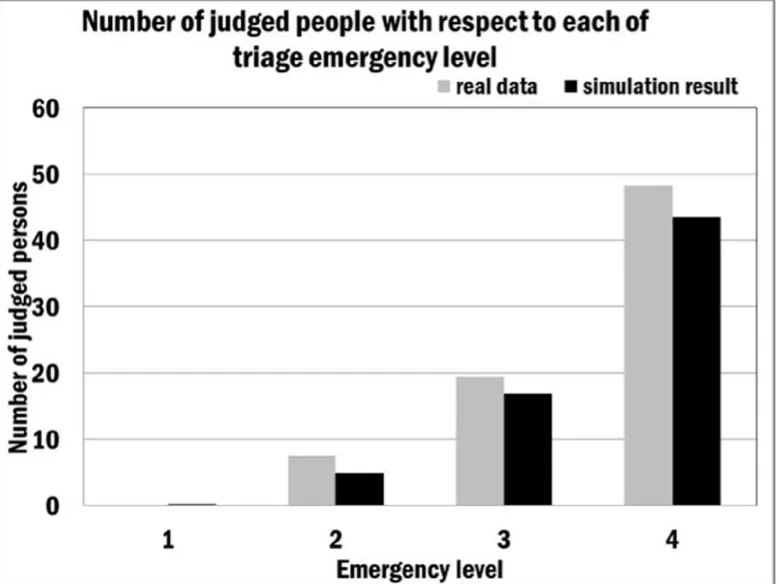
Figure 13: Number of judged patients(with respect to each triage emergency level (Kyoto City Hospital) )

Figure 14: Number of patients staying in hospital(with respect to each triage emergency level (Kyoto City Hospital) )
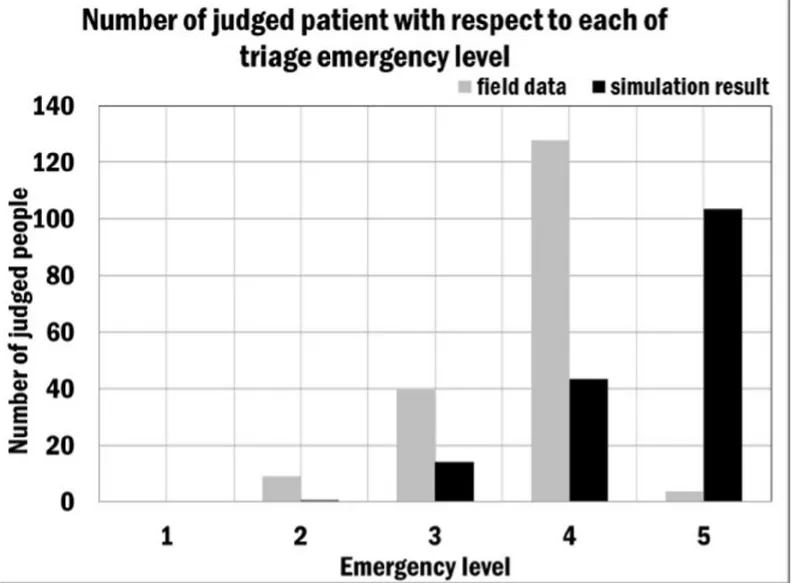
Figure 15: Number of judged patients(with respect to each triage emergency level (Kurashiki Center Hospital))
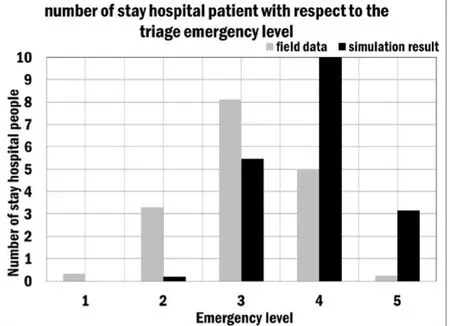
Figure 16: Number of patients staying in hospital(with respect to each triage emergency level (Kurashiki Center Hospital))
7.Experiment
To demonstrate the applicability and extensibility of TRISim, we evaluated the system using a general hospital model with a triage scenario. We employed the same scenario shown in previous sections. As reference data, we used data from different hospitals as discussed in previous sections. Applicability means that we can study and analyze the simulation result not only with respect to the hospitals used in the validation but also with respect to other hospitals. Expandability means that the performance of ahospital increases (e.g., decrease in waiting time or increase in operating rate) when we change the parameters accordingly.
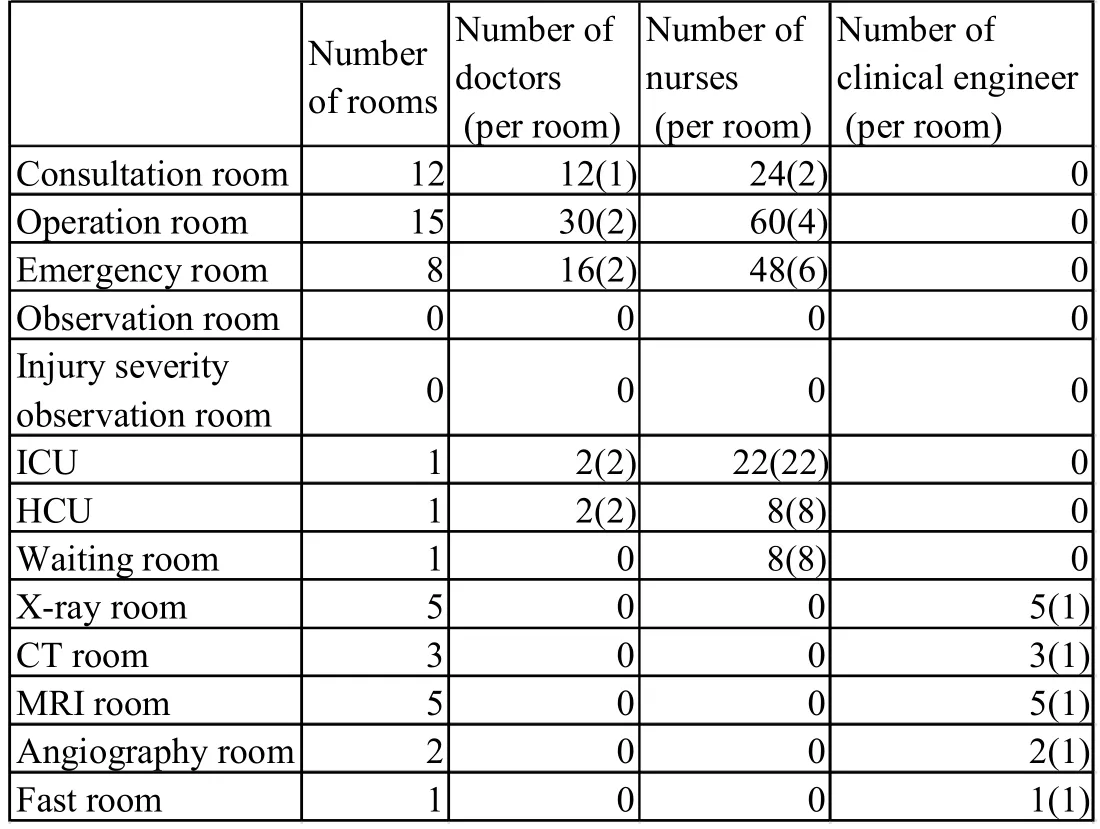
Table 6: Hospital configuration parameters(Seirei Hamamatsu General Hospital)[Seirei Hamamatsu Hospital Radiation Technology Department(2017) ;Emergency Department (2017)]
At the Seirei Hamamatsu General Hospital, the number of patients arriving is around 36 [Seirei Hamamatsu Hospital (2016)]. Tab. 6 shows the configuration parameters of this hospital. The table shows the total number of rooms and the total number of doctors, nurses, and clinical engineers that are assigned to each room. The number in parenthesis shows the number of agents per room.
7.1 Result
Figs. 17–22 show how the patient waiting time, survival probability, treatment time,and the time a patient must stay in the hospital changes depending on the number of consultation rooms. This study focuses only on the number of consultation rooms because the data on the dependency on the number of consultation rooms and in part also of emergency rooms is most characteristic.
Fig. 17 shows the patient waiting time in the waiting room when the number of consultation rooms changes. JTAS3, JTAS4, and JTAS5 represent the triage emergency levels three, four, and five, respectively. The patient waiting time in the waiting room decreases when we increase the number of consultation rooms. This result indicates that the operating rate of the consultation rooms rises in accordance with the increase of consultation rooms. The waiting time for the triage emergency levels 3, 5, and 4 increases in the given order when we have only one consultation room. This result indicates that JTAS4 judges more patients as low emergency than JTAS5 and JTAS3 judges more patients as high emergency than JTAS5. This means that the triage emergency level has less effect on a patient’s waiting time than the number of consultation rooms. Therefore,we assume that the effect of the triage emergency level on the JTAS is less significant than the effect of increasing the number of consultation rooms.
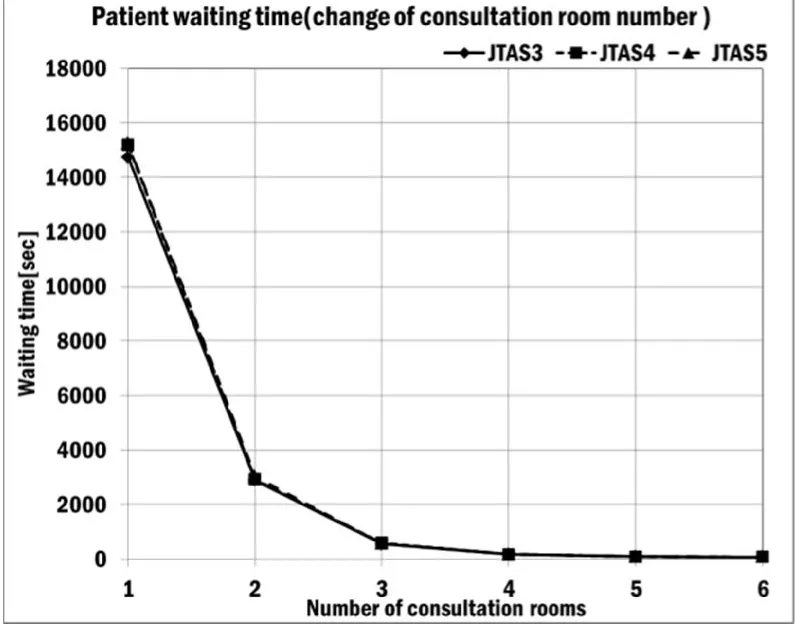
Figure 17: Patient waiting time

Figure 18: Probability of survival
Fig. 18 shows the survival probability of patients when the number of consultation rooms changes. As the graph shows, changing the number of consultation rooms does not affect the survival probability for the refined triage emergency levels. This result indicates that the high survival probability was obtained because many of the patients were assigned low emergency. The increase of the consultation rooms has no effect on the survival probability.

Figure 19: Patient treatment time in operation room
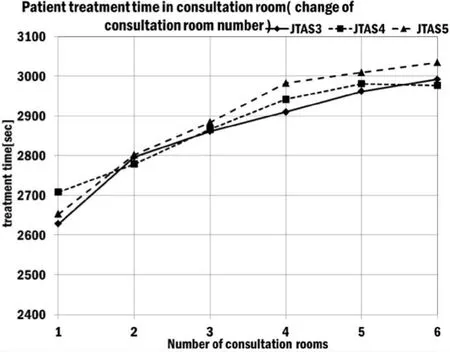
Figure 20: Patient treatment time in consultation room
Fig. 19 shows the impact of the number of consultation rooms on the treatment time of patients in the operation room. The time spent in the operation room changes very little when we increase the number of consultation rooms or refine the triage emergency levels. This result indicates that the increase of consultation rooms and the refinement of the triage emergency level have no effect on the treatment time in the operation room.
Fig. 20 shows the impact of the number of consultation rooms on the treatment time of patients in the consultation room. JTAS3, JTAS4, and JTAS5 represent the triage emergency levels three, four, and five. The treatment time in the consultation room increases when we increase the number of consultation rooms. The treatment time in the consultation room for the triage emergency levels 4, 5, and 3 increases in the given order when we have only one consultation room. This result indicates that JTAS4 judges more patients as low emergency than JTAS5 and that JTAS3 judges more patients as high emergency than JTAS5. This means that the triage emergency level has less effect on a patient’s treatment time than the number of consultation rooms. Therefore, we assume that the effect of changing the triage emergency level on the JTAS is less significant than the effect of increasing the number of consultation rooms.
Fig. 21 shows the impact of the number of consultation rooms on the treatment time of patients in the emergency room. The time spent in the emergency room changes very little when we increase the number of consultation rooms or refine the triage emergency levels. This result indicates that the increase of consultation rooms and the refinement of triage emergency level have no effect on the treatment time in the emergency room.
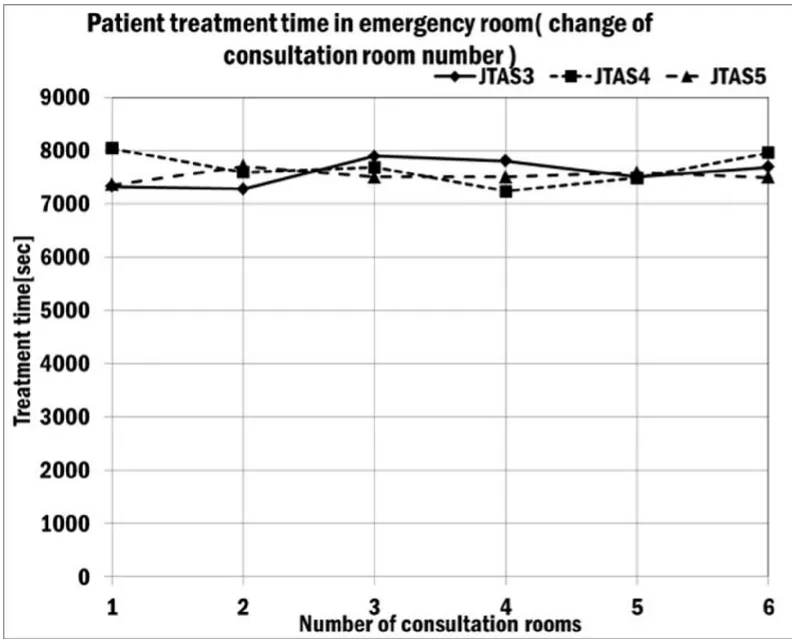
Figure 21: Patient treatment time in emergency time
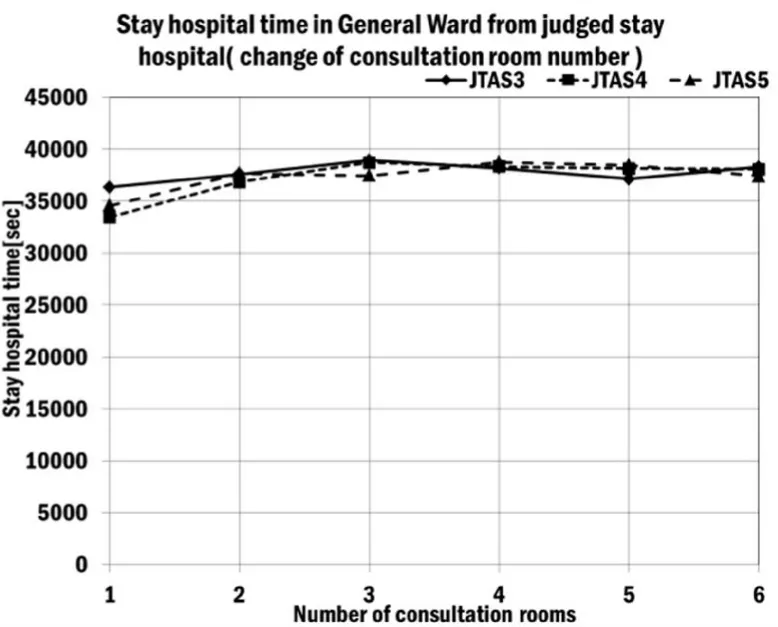
Figure 22: Time a patient stays in the General Ward
Fig. 22 shows the impact of the number of consultation rooms on the time a patient stays in the General Ward of the hospital. The time a patient stays in the hospital increases when we increase the number of consultation rooms. JTAS3, JTAS4, and JTAS5 represent the triage emergency levels three, four, and five. The result indicates that the number of patients ordered to stay in the hospital has an effect on the increase of the consultation rooms because the operating rate of the General Ward increases. The treatment time for the triage emergency levels 4, 5, and 3 increases in the given order when we have only one consultation room. This result indicates that JTAS4 judges more patients as low emergency than JTAS5 and that JTAS3 judges more patients as high emergency than JTAS5. This means that the triage emergency level has less effect on the time a patient needs to stay in hospital than the number of consultation rooms. Therefore,we assume that the effect of the triage emergency level on the JTAS is less significant than the effect of increasing the number of consultation rooms.
Fig. 23 shows the impact of the number of emergency rooms on a patient’s treatment time in the emergency room. JTAS3, JTAS4, and JTAS5 represent the triage emergency levels three, four, and five. The patient treatment time increases when we increase the number of emergency rooms. The result indicates that the number of patients assigned to emergency treatment has an effect on the increase of the emergency rooms because the operating rate of the emergency room rises. The emergency treatment time for the triage emergency levels 3, 5, and 4 increases in the given order when we have only one consultation room. This result indicates that JTAS4 judges more lowemergency patients than JTAS5 and that JTAS3 judges more patients as high emergency than JTAS5. This means that the triage emergency level has less effect on the treatment time in the emergency room than the number of emergency rooms. Therefore, we assume that the effect of the triage emergency level on the JTAS is less significant than the effect of increasing the number of emergency rooms.
Fig. 24 shows the impact of the number of emergency rooms on the waiting time of patients. As the graph shows, changing the number of emergency rooms does not affect the waiting time for the refined triage emergency levels. This result indicates that the doctor agents treat many of the patients in the consultation room because many of the patients visiting the hospital are judged as low emergency. The increase of the emergency rooms has no effect on the waiting time of the patients.
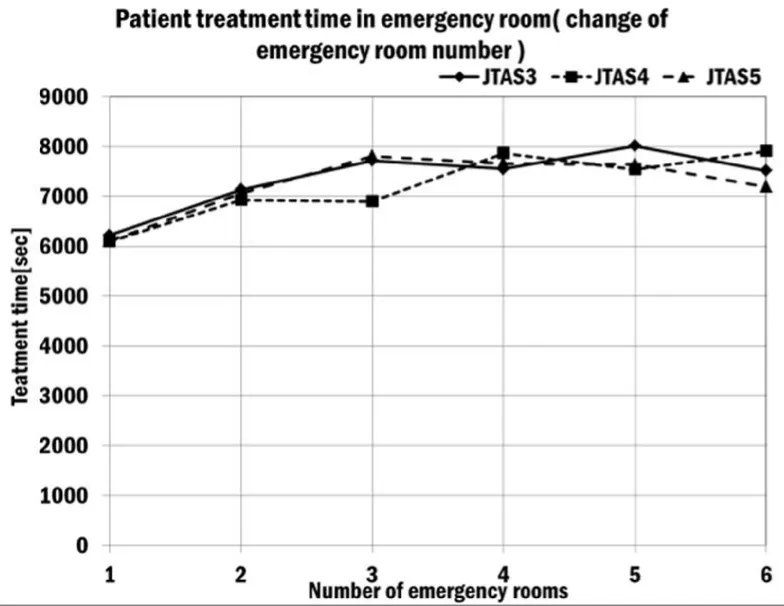
Figure 23: Patient treatment time
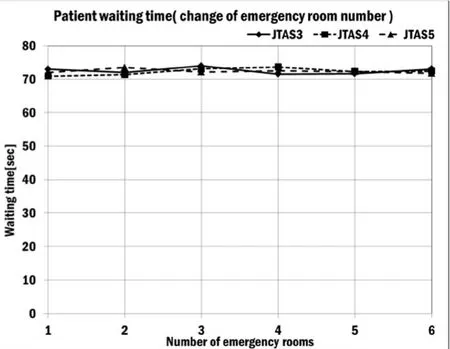
Figure 24: Patient waiting time
Changing the number of rooms has the following impacts. Increasing the number of rooms or refining the triage emergency level has no effect on a patient’s waiting time or survival probability. In addition, the treatment time in the emergency room and the treatment time in the consultation room stay roughly the same.
The treatment time in the operation room follows the same tendency as the treatment time in the consultation room. The number of days a patient stays in the General Ward of the hospital stays roughly the same when we increase the number of rooms and refine the triage emergency level.
Fig. 25 shows how many patients were assigned to each triage emergency level in one day based on data from the Seirei Hamamatsu Hospital. The graph shows five different emergency levels. Most patients were assigned to the Non-Urgency level,followed by the Less-Urgency level, followed by the Urgent level, and the fewest patients were assigned to the Emergency level.
Fig 26 shows the number of patients that had to stay at the hospital based on data from the Seirei Hamamatsu General Hospital. The graph indicates that Non-Urgency and Less-Urgency patients stayed in the hospital. According to Fig. 22 and Fig. 23, the rate of Less-Urgency patients staying at the hospital is high, while the rate of Non-Urgency patients is low. This result indicates that with the triage operation method, it is possible to assign primarily high-emergency patients to the emergency department.
The Urgency and Emergency patients do not stay in the hospital. This result indicates that the patients are either deceased, were transferred to another hospital, or have no injuries that require emergency treatment despite their assigned high- emergency level. According to the simulation result, we assume that the Urgency patients are not deceased, but were transferred to another hospital or have no injuries that require emergency treatment.
8 Discussion

Figure 25: Number of judged patients(with respect to each triage emergency level (Seirei Hamamatsu Hospital))
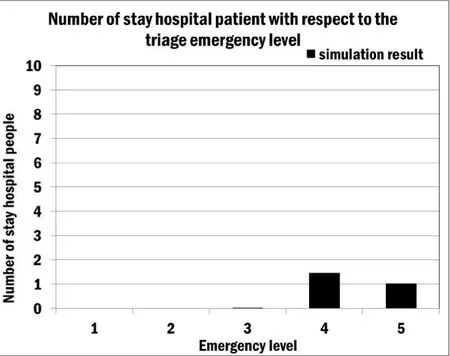
Figure 26: Number of patients staying In hospital(with respect to each triage emergency level (Seirei Hamamatsu Hospital))
In Section 7, we performed a simulation with data from the Seirei Hamamatsu Hospital. We did not use this hospital for our validation. To demonstrate the applicability of TRISim, we showed that it is possible to obtain various simulation results by changing the number of rooms that are relevant to the emergency department, doctors, nurses, and clinical engineers. In addition, we could study the triage operation method by changing the parameters. This indicates the applicability of TRISim because it is possible to study and analyze the simulation result not only with respect to the hospitals used in the validation but also other hospitals. To demonstrate the extensibility of TRISim, we showed that it is possible to reduce the waiting time of the patients and increase the operating rate of the consultation and emergency rooms. This indicates the expandability because TRISim enhances the performance of the hospital by changing the parameters.
In Section 7, we demonstrate that changing the emergency level of JTAS decreases the waiting time for patients and increases the operating rate of the consultation and emergency rooms. However, this effect holds for only one room and increasing the number of rooms is more effective than changing the emergency level [Ikeuchi (2012)].
When we have only one room, the waiting time is very long because the emergency department can examine only a few patients at a time. Therefore, we assume that the effect of changing the emergency level is obtained when unacceptable patients visit the hospital. In addition, in the case of a large-scale disaster, more than one hundred but less than one thousand patients visit the hospital [Junko (2012)]. In this case, decreasing the waiting time and increasing the number of consultation and emergency rooms has an impact on the emergency level.
Our study validated the triage data of the Tsukuba Medical Center; however, the model does not explain the Kurashiki Central Hospital triage data. We indicate three reasons to explain this case. First, we assume that the patients arriving at the hospital follow a different distribution than for the other hospitals. Because the distribution of the patients’ conditions visiting the emergency department is different for each area, we assume that the difference has an influence on the triage result for judging the emergency level. Second, the doctors and nurses employ a method for judging the triage emergency level that is different to the method employed at the other two hospitals. A patient who would be judged as Non-Urgency in the other two hospitals tends to be judged as a Less-Urgency patient. This result indicates that the Kurashiki Central Hospital establishes a relatively high-emergency level of patients. Third, our study validated the triage data of the Tsukuba Medical Center. However, the Kurashiki Central Hospital data is general triage data from the emergency department and is a special case.
Therefore, the validation result of the Tsukuba Medical Center does not explain the Kurashiki Central Hospital data.
9 Conclusion
We proposed a multi-agent simulation method and developed a system called TRISim that can be used by hospital managers who employ and assess the triage operation for their hospitals. The emergency hospital models and triage models were all constructed based on published data and the basic parameters were obtained from the reports of real hospitals.
In this study, we performed a statistical test with a goodness of fit test to validate whether the simulation results are consistent with the field data. We concluded that the simulation result is consistent with the real data because the simulation result did not reject the null hypothesis at a significance level of 5% with respect to the Tsukuba Medical Center. Therefore, TRISim assures the reliability of the triage simulation.
Furthermore, based on the results of our experiment, we analyzed the results by modifying various parameters of the agent models. The simulation results showed the relationship between the number of consultation rooms and the waiting time of patients,the change of the emergency level and the waiting time, the consultation treatment time and the time a patient stays in the hospital, and the number of emergency rooms and the emergency treatment time. In addition, we also presented the survival probability,treatment time, and number of days the patient must stay in the hospital.
In future, we will apply more characteristics for an updated version of TRISim. It is necessary to increase the fidelity of the models to enable the various studies of triage operation methods. In this study, we assumed that it was necessary to validate the behavior of doctors, nurses, clinical engineers, and patients. We will also extend the doctor, nurse, and clinical engineer agent models by incorporating a fatigue model,character traits (such as positive or negative), and the hospital shift. In addition, we will add the patient agent model to get worse gradually and suddenly change condition into TRISim. Moreover, we intend to apply TRISim to other hospitals.
Japanese Association for Acute Medicine; Journal of Japanese Association for Emergency Nursing (2012): Urgency Decision Support System JTAS 2012 Guidebook,Herusu Shuppan, (In Japanese).
Agency for Healthcare Research and Quality (2011): Emergency Severity Index (ESI)A Triage Tool for Emergency Department Care Version 4, Implementation Handbook 2012 Edition.
Santos, A.P.; Freitas, P.; Gil Martins, H.M. (2014): Manchester Triage System Version II and Resource Utilisation in the Emergency Department, Emergency Medicine Journal, vol. 31, pp. 148–152.
Murray, M.; Bullard, M.; Grafstein, E. (2004): Revisions to the Canadian Emergency Department Triage and Acuity Scale Implementation Guidelines, Canadian Journal of Emergency Medicine, vol. 6, pp. 421–427.
Kizawa, A. (2012): Establish Hospital Triage System, Emergency Care, vol. 25, no. 12,pp. 1144–1149. (In Japanese)
Lin, D.; Patrick, J.; Labeau, F. (2014): Estimating the Waiting Time of Multi-Priority Emergency Patients with Downstream Blocking, Health Care Management Science, vol.17, pp. 88–99.
Akcali, E.; Cote, M.J.; Lin, C. (2006): A Network Flow Approach to Optimizing Hospital Bed Capacity Decisions, Health Care Management Science, vol. 9, pp. 391–404.
Au-Yeung, S.W.M.; Harrison, P.G.; Knottenbelt, W.J. (2006): A Queueing Network Model of Patient Flow in an Accident and Emergency Department, 20th Annual European and Simulation Modelling Conference, pp. 60–67.
James, R.B.; Jeffery, K.C. (2011): A Queuing-Base Statistical Approximation of Hospital Emergency Department Boarding, Proceedings of the 41stInternational Conference on Computers & Industrial Engineering, pp. 122–127.
Vass, H.; Szabo, Z.K.; (2015): Application of Queuing Model to Patient Flow in Emergency Department. Case Study, Procedia Economics and Finance, vol. 32, pp. 479–487.
Paula, A.; Martin, C.R.; Sweeney, R. (2013): REDSim: A Spatial Agent-Based Simulation for Studying Emergency Departments, Proceedings of the 2013 Winter Simulation Conference, pp. 1431–1442.
Schaaf, M.; Funkat, G.; Kasch, O.; Josten, C; Winter, A. (2014): Analysis and Prediction of Effects of the Manchester Triage System on Patient Waiting Times in an Emergency Department by Means of Agent-Based Simulation, GMS Medizinische Informatik, Biometrie und Epidemiologie, vol. 10, no. 1, pp. 1–10.
Halim, S.; Annamalai, M.; Ahmad, M.S.; Ahmad, R. (2012): A Conceptualisation of an Agent-Oriented Triage Decision Support System, Knowledge Technology, vol. 295, pp.272–282.
Annamalai, M.; Khairani, N.A,; Rahmat, M.H. (2014): Agent-Oriented Simulation of Emergency Department Re-Triage Based on Allocated Time to Treatment, IEEE Conference on Biomedical Engineering and Sciences, pp. 397–402.
Taboada, M.; Cabrera, E.; Epelde, F.; Iglesias, M.L.; Luque, E. (2008): Using an Agent-Based Simulation for Predicting the Effects of Patients Derivation Policies in Emergency Departments, Procedia Computer Science, vol. 18, pp. 641–650.
Kanagarjah, A.K.; Lindsay, P.; Anne Miller (2008): An Exploration into the Uses of Agent-Based Modeling to Improve Quality of Health Care, Unifying Themes in Complex Systems, pp. 471–478.
Spencer S Jones; R Scott Evans (2008): An Agent Based Simulation Tool for Scheduling Emergency Department Physicians, AMIA 2008 Symposium Proceedings, pp.338–342.
Boyd, C.R.; Tolson, M.A.; Ccrn, R.N.; Wayne S.; Copes (1987): Evaluating Trauma Care: The TRISS Method., Journal of Trauma, pp. 370–378.
Siritongtaworn, P.; Opasanono, S. (2016): The Use of Trauma Score-Injury Severity Score (TRISS) at Siriraj Hospital: How Accurate Is It? Journal of the Medical Association of Thailand, vol. 92, no. 8, pp. 1016–1021.
Ministry of Health Labour and Welfare (2013): Patient Survey, (In Japanese).
Japan Trauma Care and Research (2014): Japan Trauma Data Bank Report 2014, pp.1–64.
Fujiki, N.; Sakamoto, Y.; Motomura, Y.; Nishida, Y.; Noguchi, S. (2009): The Statistical Learning and Evaluation of the Survival Prediction Model Using Bayesian Networks, The 23rd Annual Conference of the Japanese Society for Artificial Intelligence,(In Japanese).
Healey, C.; Turner M. Osler, Frederick B. Rogers; Mark A. Healey; Laurent G.Glance; Patrick D. Kilgo; Steven R. Shackford; J. Wayne Meredith (2003):Improving the Glasgow Coma Scale Score: Motor Score Alone Is a Better Predictor, The Journal of Trauma Injury, Infection, and Critical Care, vol. 54, no. 4, pp. 671–680.
Sasaki, Y. (2016a): Pulse and Blood Pressure, The Pharmaceuticals Monthly, vol. 58, no.5, pp. 27–31, (In Japanese).
Sasaki, Y. (2016b): Respiratory and SpO2, The Pharmaceuticals Monthly, vol. 58, no. 5,pp. 33–37, (In Japanese).
Shindo, A. (2016): Nurse’s Measurement Method of Vital Sign, The Pharmaceuticals Monthly, vol. 58, no. 5, pp. 43–48, (In Japanese).
Mutscher, M.; Nienaber, U.; Munzerberg, M.; Wolfl, C.; Schoechl, H.; Paffrath, T.;Bouillon, B.; Maegele, M. (2013): The Trauma Register DGU, The Shock Index Revisited – A Fast Guide to Transfusion Requirement? A Retrospective Analysis on 21853 Patients Derived from the Trauma Register DGU, Critical Care, pp. 1–9.
Ministry of Health Labour and Welfare (2013): Patient's Behavior Survey 2013,http://www.mhlw.go.jp/toukei/saikin/hw/jyuryo/11/dl/kakutei-sankou.xls, (accessed on February 3, 2017), (In Japanese).
Ministry of Health Labour and Welfare (2005): Examination with Respect to Operation Difficulty and Time, http://www.mhlw.go.jp/shingi/2005/09/dl/s0921-8e01.pdf,2005, (accessed on February 3, 2017), (In Japanese).
National Cancer Center Hospital East (2017):http://www.ncc.go.jp/jp/ncce/consultation/xsenkensa.html, (accessed on February 3,2017), (In Japanese).
Goto, M.; Tannji, N.; Ooki, Y.; Shibaoka, T. (2013): Analysis of the Waiting Time in Triage Out patients, Medical Journal of Mutual Aid Association, vol. 64, no. 1, pp. 44–49,(In Japanese).
Kyoto City Hospital (2014); Kyoto City Hospital Overview of Medical Care, 2014 http://www.kch-org.jp/document/results, (accessed on February 3, 2017), (In Japanese).
Kurashiki Central Hospital (2015): Kurashiki Central Hospital Emergency Statistical Data, http://www.kchnet.or.jp/for_medicalstaff/pdf/救急統(tǒng)計(jì)_2015年度.pdf, (accessed on February 3, 2017), (In Japanese).
Hyogo Prefectural Nishinomiya Hospital (2017):http://www.nishihosp.nishinomiya.hyogo.jp/index.html, (accessed on February 3, 2017),(In Japanese).
Nihon University Hospital (2017): http://www.nihon-u.ac.jp/hospital/outline/, (accessed on February 3, 2017), (In Japanese).
Kyourin University Hospital (2017):http://www.kyorin-u.ac.jp/hospital/introduction/hospital_summary/, (accessed on February 3, 2017), (In Japanese).
Seirei Hamamatsu Hospital (2016): Clinical Indicator 2016,http://www.seirei.or.jp/hamamatsu/hama/clinical_indicator/PDF/10.pdf, (accessed on February 3, 2017), (In Japanese).
Tsukuba Medical Center (2017):http://www.tmch.or.jp/hosp/section/nursing/introduction.html, (accessed on February 3,2017), (In Japanese).
Kurashiki Central Hospital Operation Department (2017):http://www.kchnet.or.jp/for_medicalstaff/cshujyutsu.aspx, (accessed on February 3,2017), (In Japanese).
Kurashiki Central Hospital ICU Department (2017):http://www.kchnet.or.jp/for_medicalstaff/cicu.aspx, (accessed on February 3, 2017), (In Japanese).
Kurashiki Central Hospital Radiation Technology Department (2017):http://www.kchnet.or.jp/for_medicalstaff/cshujyutsu.aspx, (accessed on February 3,2017), (In Japanese).
Seirei Hamamatsu Hospital Emergency Department (2017):http://www.seirei.or.jp/hamamatsu/department/center/emergency/index.html, (accessed on February 3, 2017), (In Japanese).
Seirei Hamamatsu Hospital Radiation Technology Department (2017):http://www.seirei.or.jp/hamamatsu/department/specialty/radiology/index.html, (accessed on February 3, 2017), (In Japanese).
Ikeuchi, J.; Yada, M.; Takei, E.; Higashihara, H. (2012): Requirements for Injured Transportation Between the Hospitals After a Big Earthquake ―Analysis of Injured Transportation after the Great Hanshin-Awaji Earthquake― Journal of Institute of Social Safety Science, vol. 19, pp. 1–8.
猜你喜歡
中外玩具制造(2022年4期)2022-04-08 02:01:56
中外玩具制造(2022年4期)2022-04-08 02:01:56
當(dāng)代陜西(2021年18期)2021-11-27 09:01:16
河北金融年鑒(2021年0期)2021-08-25 08:57:32
基層中醫(yī)藥(2020年10期)2020-11-27 01:59:00
支點(diǎn)(2020年7期)2020-07-20 06:39:16
中國(guó)寶玉石(2017年6期)2018-01-13 07:32:07
石油化工建設(shè)(2017年6期)2017-04-12 05:30:12
石油化工建設(shè)(2017年6期)2017-04-06 03:29:53
中國(guó)衛(wèi)生(2016年5期)2016-11-12 13:25:50
 Computer Modeling In Engineering&Sciences2017年2期
- Computer Modeling In Engineering&Sciences的其它文章
- Local and biglobal linear stability analysisof parallel shear flows
- Glass Fibre Reinforced Concrete Rebound Optimization
- Devanagari Handwriting Grading System Based on Curvature Features
- Deformation and failure analysis of river levee induced by coal mining and its influence factor
- Uniform Query Framework for Relational and NoSQL Databases
- Plane Vibrations in a Transversely Isotropic Infinite Hollow Cylinder Under Effect of the Rotation and Magnetic Field