
Effects of temporal variability on HBV model calibration
2015-01-16 01:21:12StevenReinldoRusliDoddiYudintoJintoLiu
Water Science and Engineering 2015年4期
Steven Reinldo Rusli*,Doddi Yudinto,Jin-to Liu
aCivil Engineering Department,Faculty of Engineering,Parahyangan Catholic University,Bandung 40141,Indonesia
bState Key Laboratory of Hydrology-Water Resources and Hydraulic Engineering,Hohai University,Nanjing 210098,PR China
Effects of temporal variability on HBV model calibration
Steven Reinaldo Ruslia,b,*,Doddi Yudiantoa,Jin-tao Liub
aCivil Engineering Department,Faculty of Engineering,Parahyangan Catholic University,Bandung 40141,Indonesia
bState Key Laboratory of Hydrology-Water Resources and Hydraulic Engineering,Hohai University,Nanjing 210098,PR China
This study aimed to investigate the effects of temporal variability on the optimization of the Hydrologiska Byr?ns Vattenbalansavedlning (HBV)model,as well as the calibration performance using manual optimization and average parameter values.By applying the HBV model to the Jiangwan Catchment,whose geological features include lots of cracks and gaps,simulations under various schemes were developed:short, medium-length,and long temporal calibrations.The results show that,with long temporal calibration,the objective function values of the Nash-Sutcliffe effciency coeffcient(NSE),relative error(RE),root mean square error(RMSE),and high fow ratio generally deliver a preferable simulation.AlthoughNSEandRMSEare relatively stable with different temporal scales,signifcant improvements toREand the high fow ratio are seen with longer temporal calibration.It is also noted that use of average parameter values does not lead to better simulation results compared with manual optimization.With medium-length temporal calibration,manual optimization delivers the best simulation results,withNSE,RE,RMSE,and the high fow ratio being 0.563 6,0.122 3,0.978 8,and 0.854 7,respectively;and calibration using average parameter values deliversNSE,RE,RMSE,and the high fow ratio of 0.481 1,0.467 6,1.021 0,and 2.784 0,respectively.Similar behavior is found with long temporal calibration,whenNSE,RE,RMSE,and the high fow ratio using manual optimization are 0.525 3,-0.069 2,1.058 0,and 0.980 0,respectively, as compared with 0.490 3,0.224 8,1.096 2,and 0.547 9,respectively,using average parameter values.This study shows that selection of longer periods of temporal calibration in hydrological analysis delivers better simulation in general for water balance analysis. ?2015 Hohai University.Production and hosting by Elsevier B.V.This is an open access article under the CC BY-NC-ND license(http:// creativecommons.org/licenses/by-nc-nd/4.0/).
HBV model;Model calibration;Jiangwan Catchment;Temporal variability
1.Introduction
Use of water balance models to predict upcoming low and high fow has been increasing,especially in relation to current hydrological issues,including imbalance of the water supply and demand(Xiong and Guo,1999),climate change(Guo et al.,2002;Booij,2005),dynamic variation of saturated areas(Bari and Smettem,2006),and land use change(Elfertand Bormann,2009).Through the law of conservation of mass,the relationship between water infow,outfow,and storage in a specifed catchment is mathematically derived by the water balance model,whose parameters represent the behaviors of the catchment.
The Hydrologiska Byr?ns Vattenbalansavedlning(HBV) model,which was developed by the Swedish Meteorological and Hydrological Institute(SMHI)in 1972,is a widely used water balance model.Its capability in conducting hydrological analysis related to the water balance is well known and it has been used in more than 30 countries(Bergstrom,1992).Das et al.(2008)have shown strong performance of the distributed HBV model.Several important strengths of the HBV model are its physically based parameters,which are useful due to the simplicity of linking them to physical attributes;the unexcessive number of free parameters as compared with othermodels(the HBV model has only eight parameters,while the Sacramento model,Xinanjiang model,Nedb?r-Afstr?mnings (NAM)model,and Pitman model have 21,15,15,and 16 parameters,respectively(Gan et al.,1997));simple data demands;user-friendliness;ease of operation;and high level of performance(Lindstrom et al.,1997).Singh(1995)has also shown the broad usage of the HBV model over a wide span of geographical and climatological conditions.Although the HBV model has generally been used in relatively more humid regions than Europe,where the HBV model was developed, such as the northern part of China,its applicability to more arid regions was also evaluated,including some successful applications in arid regions of Indonesia(Dance,2012;Sanata, 2013).
Commonly,the temporal scale selection for HBV model calibration is determined by the analysis requirements.For instance,to evaluate the effects of annual land use change and urban planning systems on the basin's hydrological characteristics,yearly calibration is usually chosen,followed by the observation of model parameter alteration(Dance,2012; Sanata,2013).On the other hand,to identify the general hydrological characteristics in order to further predict the longterm outfow,calibration usually utilizes a longer period of data.In practice,the requirements of a specifc project are the key to selecting the best temporal scale for HBV model calibration.
In this study,different representations of the temporal scale selection used to conduct HBV model calibration were evaluated and compared.Yearly calibration was conducted,along with longer-period calibration.Finally,a calibration for the entire data period was also conducted,using both manual optimization and average parameter values of the yearly calibration.The main purposes of this study were to identify the HBV model parameters in the Jiangwan Catchment,to evaluate model appropriateness with the actual catchment behavior through the manual calibration process,to evaluate the model performance,and to compare the suitability of the HBV model to the catchment at various temporal scales(not various data record lengths),based on the determined objective function values and simulated high fow.
2.Materials and methods
2.1.HBV model
The required data for the HBV model is generally easy to collect.In an area without a signifcant snow routine,precipitation and fow observation data are needed to calibrate the model and run the simulation.Climatological data used to calculate potential evapotranspiration are also necessary. However,under circumstances in which actual evapotranspiration measurement is available,analysis of potential evapotranspiration is not necessary.
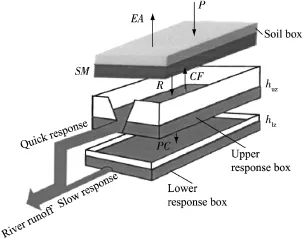
Fig.1.HBV model structure.
Without consideration of the snow routine process,the structure of the HBV model consists of three main box layers, as shown in Fig.1.It basically connects every possible water fow channel of the three boxes,from precipitation in the soil box to runoff estimation as the simulation output.The primary parameters in the HBV model expected to represent the actual catchment response are maximum soil moisture storage capacity(FC),evapotranspiration limitation(LP),the velocity of water fowing up through the soil due to capillarity force (CFLUX),the velocity of water fowing down due to the natural percolation process(PERC),the coeffcient for subsurfacedischarge(Kf),thecoeffcientforgroundwater discharge(K4),the power coeffcient for sub-surface discharge (α),and the power coeffcient for recharge and percolation(β). These parameters are strongly interlinked and they defne various variables inside the model.There are actually other parameters in the HBV model,such asMAXBAS,which has a stronger effect for larger catchment size as it is related to food lag time in snow routine calculation,which is usually insignifcant in small catchment.However,it can be neglected, since it is insignifcant in the Jiangwan Catchment(Zhang and Lindstrom,1997).
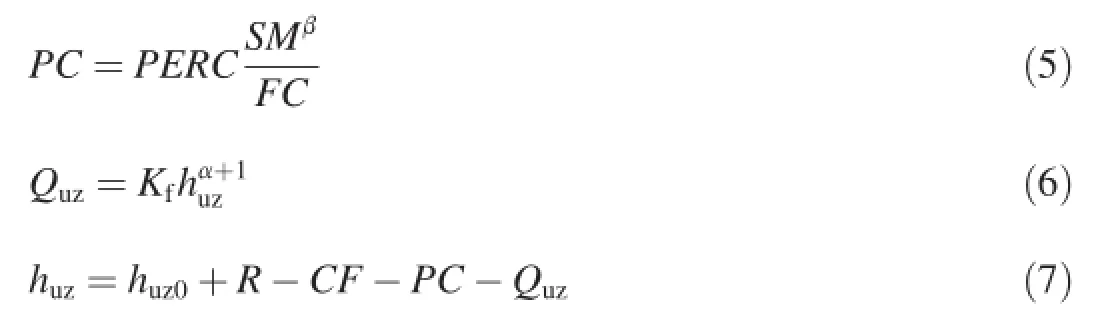
The soil box,which is the frst box in the model,represents the soil surface,where the precipitation falls and evapotranspiration occurs.ParametersFCandLPare inside the box,with variable recharge to the upper response box(R)and capillarity fux from the upper response box(CF)being the infowoutfow relationship with the upper response box.The soil box also has a free parameter,the initial soil moisture value(SM0), which is used to initiate the simulation.The variables in the soil box are calculated with the following equations:

whereEAis the actual evapotranspiration(mm),SMis the soil moisture storage(mm),EPis the potential evapotranspiration (mm),andPis the precipitation(mm).
The upper response box undergoes a similar processes,in which recharge(R)is an input from the soil box and capillarity fux(CF)is an output to the soil box.Moreover,with an initial water depth(huz0),the outfows from the upper response box are percolation(PC)that moves to the lower response box and sub-surface discharge(Quz),which is calculated as follows:
wherehuzis the water depth in the upper layer(mm).
The lower response box utilizes the same concept as the upper response box.The percolation comes as an input,withhlz0as the initial water depth in this layer.Groundwater dischargeQlzis an output.The sum ofQuzandQlzis further considered to be the total fow(Qt)at the basin outlet.The formulas involved in the lower response box are as follows:
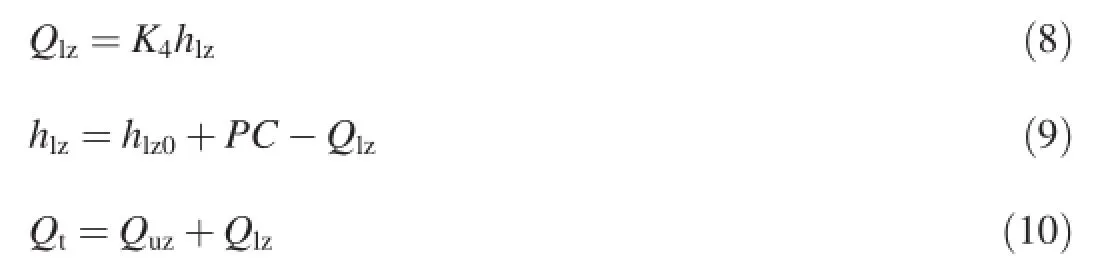
wherehlzis the water depth in the lower layer(mm).
2.2.Evaluation criteria
Calibration is conducted to better understand the correlation between model parameters and catchment response,by adjusting the parameter manually to achieve the best possible agreement between the calculated fow and observed fow.The objective functions used to appraise the adjustment are the Nash-Sutcliffe effciency coeffcient(NSE),relative error (RE),and root mean square error(RMSE),as defned by the following equations:
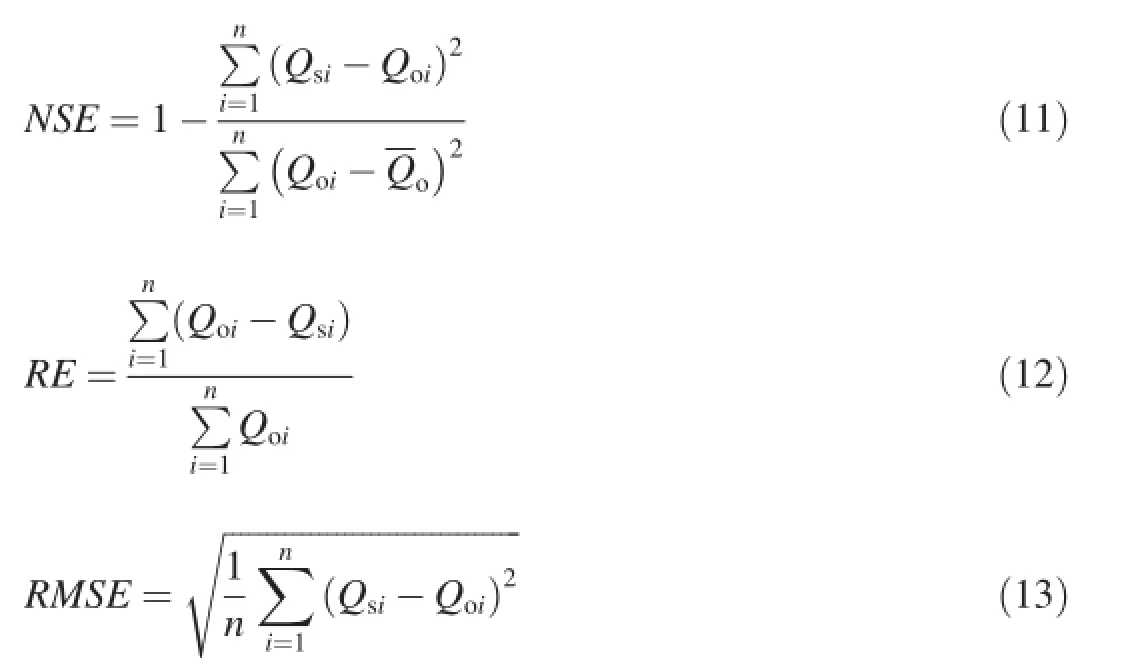
whereandQoare,respectively,the simulated fow, observed fow,and average observed fow.NSE,RE,andRMSEwere considered to be dimensionless in this study.With all these objective functions considered,it is expected that the value ofNSEbe as close as possible to 1.0,while,inversely, the values ofREandRMSEshould be as close as possible to zero.The value of the high fow ratio,which is the ratio of simulated highest fow to observed highest fow within a certain period,is also used to evaluate the model performance.
2.3.Study area
The Jiangwan Catchment,which is located in Zhejiang Province,in China,was selected as the study catchment as it has been an experimental catchment for important research projects since 1957.Its outlet is located at 119°50′E and 30°35′N(Liu et al.,2012),as shown in Fig.2.The area of the Jiangwan Catchment is approximately 20.9 km2.Considering its small area,it was classifed in this study as a small catchment with evenly distributed soil moisture in order to simplify hydrological modeling,although many models assume that the soil moisture storage capacity varies across the basin(Manfreda and Fiorentino,2008;Liu et al.,2009).
Located in a subtropical area with high humidity,an annual average temperature of 14.6°C,an annual average sunshine duration of 1 579 h,and an annual average wind speed of about 1.5 m/s,the Jiangwan Catchment has high potential evapotranspiration,measured at an average value of 805 mm. In general,the land cover is dominated by bamboo,accounting for almost 90%of the whole catchment terrain,with the rest covered by rice,tea,and other crops,as well as some small villages.Soil in the catchment has been found to be highly permeable,with a high soil moisture capacity.The main thing that should be emphasized here is the geological features of the Jiangwan Catchment,including gaps and fssures that allow water to fow and move from the surface layer to the sub-surface layer.Such geological features have the potential to amplify the signifcance of determination of hydrological model parameters(Zhao et al.,1980;Troch et al.,2002).
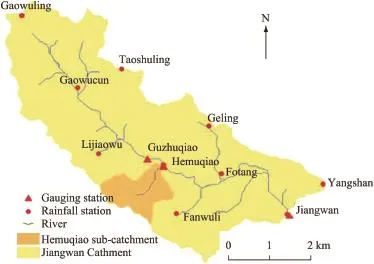
Fig.2.Jiangwan Catchment.
The hydro-meteorological data in the Jiangwan Catchment from 1957 to 1986 were recorded by the Zhejiang Provincial Hydrology Bureau.The quality of the data has gone through quality testing according toCode for Hydrologic DataCompilation(SL247-1999)of China before being released (Liu et al.,2012).The 30-year(from 1957 to 1986)data record includes precipitation data from ten rainfall stations and streamfow measurement at the outlet,at both quarter-hourly and daily time steps.Several heavy rainfall events and large foods occurred,such as the heaviest rainfall event,which occurred on September 12,1963(with 253.67 mm of rainfall) and the event that occurred on June 13,1984(with 209.8 mm of rainfall).However,the period with the heaviest fooding did not occur after the heaviest rainfall.The heaviest fooding measured in the Jiangwan Catchment occurred on October 5, 1961(with a food discharge of 47.9 m3/s),followed by the fooding that occurred on September 13,1963(with a food discharge of 43.2 m3/s).
2.4.Method description
In the short temporal calibration analysis,the data were divided year by year from 1957 to 1986 and independent calibration was conducted for each year.The total calibration was for a period of 29 years,with the removal of the year 1970 due to a missing data record.Calibration results from one year do not have any infuence on the results in another year;each year's calibration was restarted from the initial values as suggested by Liden and Harlin(2000)and displayed in Table 1.Afterward,the initial value of a parameter was adjusted within its lower and upper limits,and the variation of the objective function values was observed with the change of model parameters.The goal at the end of the calibration was to obtain the optimum values forNSE,RE,andRMSE.In addition,it was hoped that the calibration result would be visually acceptable.
Following the yearly calibration,longer-period calibration was conducted by dividing the data into two sets(1957-1969 and 1971-1986),because of unavailability of the observed data in 1970.Since the plotted data were long and condensed, visual evaluation of the calibration was not reliable.TheNSE,RE,andRMSEvalues became the primary basis for evaluation of the calibration process.Calibration can follow two approaches:use of average parameter values from the previous yearly calibration within the calibration period,or optimization of the parameter through manual calibration.When using the average parameter values,no adjustment was made;the calculated average parameter value was applied to the model and the result was evaluated.The purpose of doing this was toinvestigate the stability of the parameter:if the objective function values delivered were close to the average values from the yearly calibration,it could be said that the model was stable.On the other hand,manual calibration with a mediumlength temporal scale was conducted to optimize the simulation if the result using the average parameter value was unsatisfying.This concept is similar to that of the yearly calibration conducted by inputting the initial parameters and further adjusting them to obtain the optimum objective function values.Both analysis results were verifed using the other's period,a process referred to in this paper as medium temporal calibration.
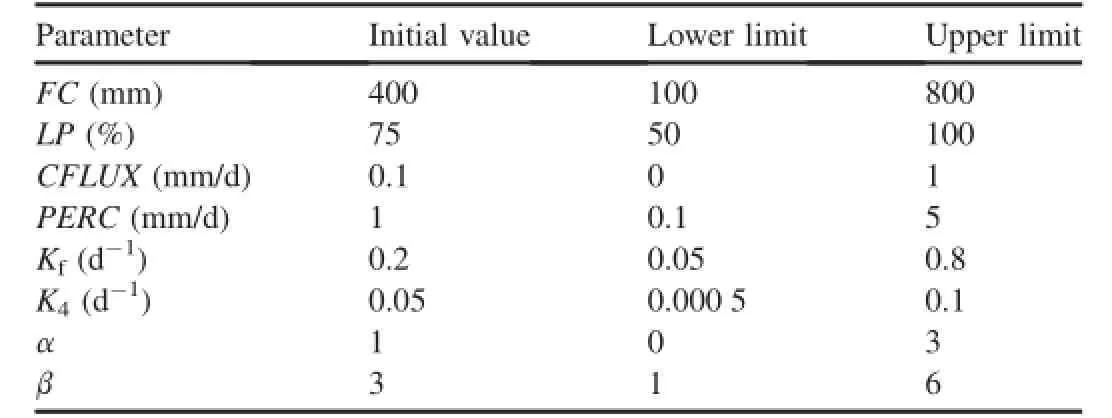
Table 1 Ranges of parameters for HBV model calibration(Liden and Harlin,2000).
In addition to partial data calibration,direct calibration of the entire 30 years was conducted.As in the process of medium temporal calibration,this calibration involved two trial methods,one using average parameter values from the yearly calibration and the other using manual optimization,in which the parameter was adjusted directly to achieve the optimum objective function values without any division of the data.All the data were used,without any removal.The unavailable observed fow data were considered to be zero values during this process,which actually decreased not only the degree of accuracy of the analysis but also the signifcance level. However,this assumption was unavoidable considering the data availability.Visual evaluation was almost impossible in a calibration with a 30-year temporal scale.Thus,objective function valuescreated an importantplatform forthe evaluation.
3.Results and discussion
3.1.Regional rainfall
As there are ten rainfall stations within the Jiangwan Catchment,regional rainfall analysis was conducted to obtain one representative daily rainfall data set.Using the Thiessen polygon method,each station was endowed a weight based on its infuence on the basin.The weight of each rainfall station is shown in Table 2.
3.2.Sensitivity analysis
With sensitivity analysis,manual calibration can be conducted more easily,since the effect of each parameter on the change of other parameters and the objective function value is identifed.In principal,the sensitivity analysis in this study involved two concepts:one-at-a-time(OAT)analysis and analysis of the interaction among parameters using the Sobolconcept.By plotting them in a graph,the effect of certain parameter changes could be visually traced.The OAT sensitivity analysis results and the sensitivity analysis results of interaction among parameters are shown in Fig.3 and Fig.4, The parameters with symbol*represent the relative values of the corresponding parameters respectively.
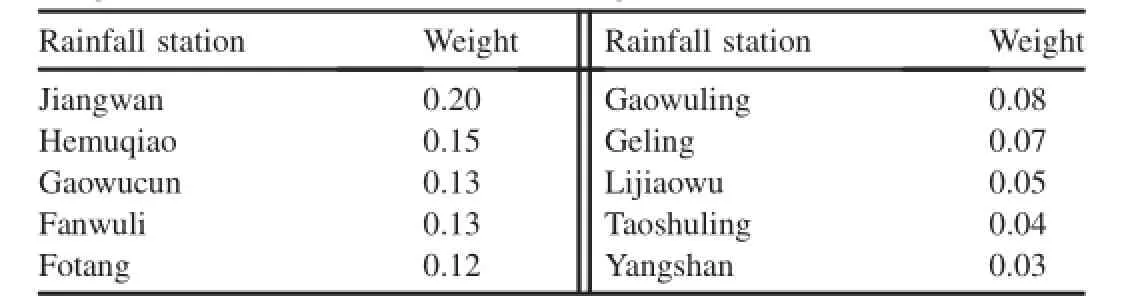
Table 2 Weight of each rainfall station within Jiangwan Catchment.
The analysis found unexpected objective function values, such as negativeNSEvalues.However,they were accepted,as the aim of sensitivity analysis is not to calibrate the parameter but to fnd the sensitive parameter in order to ease manual calibration process.The results indicate the inappropriateness of the initial parameter value used to simulate the response of the Jiangwan Catchment,which quantitatively delivers a signifcantly higher simulated fow compared with what was observed.In further calibration,such a poorNSEresult was not acceptable.

Fig.3.OAT sensitivity analysis results subject to different evaluation criteria.
The OAT sensitivity analysis shows that α andPERCare the most sensitive parameters to all objective function values. Besides these two parameters,all parameters exceptLPandCFLUXtend to have a moderate effect on the objective function values.Moreover,considering each parameter value's range and precision,α andKfwere concluded to be the most sensitive parameters in the analysis,along withPERC.It is worth noting that all the sensitive parameters are related to sub-surface fow.It can then be concluded that the result of sensitivity analysis is in accordance with the actual catchment geological features that cause the hydrological behavior of dominantsub-surfacefow.AlthoughKfseemsnotto contribute a major change to the objective function values,its wide range has a greater infuence.K4is also very sensitive over a small range close to zero.Similarly,FCis sensitive only within a narrow range of values,while the variation of β is limited.On the basis of this sensitivity analysis result,the calibration process then becomes less time-consuming.
The results of interaction among parameters in the sensitivity analysis show that there were in fact interactions among parameters.Sensitivity analysis was conducted particularly between parameters that were directly related in the formulas:FCtoLP,FCtoCFLUX,PERCto β,andKfto α.The results shown in Fig.4 indicate various interactions,from a slight one betweenFCandLPto a signifcant one betweenKfand α. Fig.4 shows the smaller interactions ofFCwithLPandFCwithCFLUXas compared with the interactions ofPERCwith β and ofKfwith α.Various values ofPERChighly infuence the change of β,while,inversely,various values of β also infuencePERCto a slighter degree.The most notable interaction is seen betweenKfand α,where slight changes in both small parameter relative values cause a huge change in one another.Overall parameter interactions are shown in Fig.5.
3.3.Performance evaluation and discussion
From the yearly calibration,it can be determined that the optimum model parameters change annually,while,in fact, human interference in the Jiangwan Catchment is very low. The initial hypothesis presumes stable model parameters,with consideration of the stability of the catchment land cover itself.Another hypothesis presumes a relatively small change in model parameters,as was typical before Merz and Bloschl (2004)proved the uncertain association between calibrated parameter values of different periods.Although it is known from the record that land use change due to human interference in the Jiangwan Catchment is less than 10%,Bronster et al.(2002)have shown that changes in land cover can infuence the hydrological regimes of catchments,which is another factor supporting the second hypothesis.However,the calibration results deliver different conclusions.The variation of each parameter for every year(1957 through 1986)is shown in Fig.6,within the values of their suggested upper and lower limits.Although the parameterFCis shown to vary between 150 mm and 600 mm,it is still stable over more than 20 years.Meanwhile,LP,noted before as one of the least sensitive parameters in this study,remains constant at 50%.A unique case is found in the parameterCFLUX,whose optimum value only contains two numbers,which are thesuggested lower and upper limit values(0 and 1).However, since the value 1 is found only in three calibrations,it can be said that the value forCFLUXis generally 0,indicating no capillarity fow.Quite similar behavior is also found in the parameterK4,which varies over a very small range between 0 and 0.000 5.However,a small change in this parameter causes a greater effect on the objective function value as compared with the effect caused byCFLUX.For this reason, the value ofK4in this study is more precise than those of other parameters,with precision of up to 10-5.It also exceeds the lower limit suggested by Liden and Harlin(2000),and numbers less than the lower limit provide a much better simulation.Various values forPERC,Kf,α,and β are found in more stochastic patterns throughout the analysis.

Fig.4.Sensitivity analysis results of interaction among parameters.
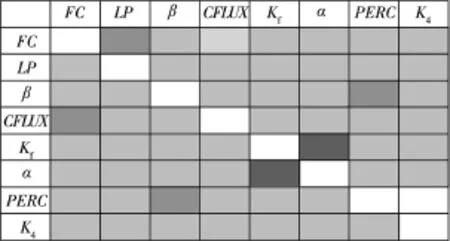
Fig.5.Interaction in parameter sensitivity analysis(a darker color indicates a higher interaction between parameters).
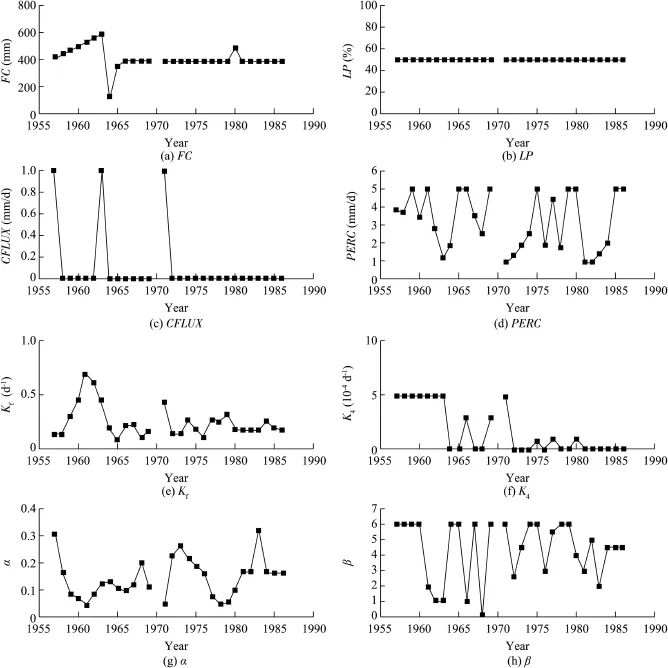
Fig.6.Variation of model parameters in short temporal calibration.
Such a model parameter variation phenomenon is shown through analysis to be caused by the unique geological features of the Jiangwan Catchment,as has been mentioned before.Since the land cover above the surface does not change much compared with the change of model parameters,the variation must be explained by the soil below the surface and the spatially distributed characteristics within the catchment boundary.The soil structure in the Jiangwan Catchment includes lots of gaps,cracks,and fssures,and tends to cause free water to fow from the surface to the sub-surface layer,as described by the variations ofKfand α.BothKfand α are related closely to the proportion of sub-surface fow,and from Figs.3 and 6 it can be seen that the values of these two parameters vary and,as the result of sensitivity analysis shows, their effects on the objective function values are greater than those of other parameters.Furthermore,it is useful to observe the pattern of these two parameters:when the value ofKfincreases over a certain period,the value of α generally decreases in that period,and vice versa.Deeper observation of the correlation between geological features and sub-surface parameters should be conducted in order to foster a better understanding.In addition,CFLUX,which indicates capillarity fow,is found generally to be zero,as confrmed by the actual physical conditions,wherein capillarity fow is hardly ever found in such geological features.The proportion of fow through groundwater(represented by thePERCandK4parameters)is also shown to be very small,and related to soil characteristics in Hemuqiao,which is a sub-catchment of the Jiangwan Catchment.It is known from feld tests that the infltration rate from 1.5 m below the ground surface tends to be very small,rated on average around 0.1-0.2 mm/min. Moreover,the varying depth of the hard soil layer causes the water fow pattern to differ spatially from one point to another. In relation to the actual physical condition of the Jiangwan Catchment,it can be said that the hydrological simulation using the HBV model can represent the catchment's behavior in line with the attributes of the catchment itself.
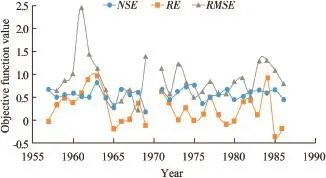
Fig.7.Variation of objective function values in short temporal calibration.
Furthermore,not only the model parameters,but also the objective function values ofNSE,RE,andRMSEvary every year,as displayed in Fig.7.On average,NSEis 0.566 4,REis 0.300 4,andRMSEis 0.892 9.In several calibrated years,the results are poor,withNSEvalues of 0.297 6 in 1965,0.189 3 in 1969,0.474 6 in 1972,0.381 0 in 1976,and 0.452 9 in 1980. PoorREvalues are found at 0.944 6 in 1962,0.991 9 in 1963, and0.923 4in1984,whilepoorRMSEvaluesarefoundin1961, 1962,and 1969,with respective values of 2.482 4,1.457 3,and 1.377 7.Mostly,these poor results occurred in years with high fow or with incomplete observed fow data series.In contrast, some very good results are also found,such asNSEvalues of 0.825 2in1963,0.742 3in1974,and0.747 9in1975,REvalues of-0.000 2in1957,-0.021 1in1966,and0.013 9in1967,andRMSEvalues of 0.351 9 in 1965 and 0.229 9 in 1968.Basically, in a year in which the fow was near average,without extreme high or low fow,the simulation succeeds in delivering similar patterns and magnitudes of runoff as a response to the rainfall. When subjected to high fow,some discrepancies between simulated and observed high fow are identifed in the short temporal(yearly)calibration,asshowninFig.8.Onaverage,the simulatedhighestfowinayearisonly0.779timestheobserved one.The most underestimated result is found in the 1969 simulation,with a simulated high fow of 6.68 m3/s,while the observed record shows a discharge of 18.7 m3/s.One of the overestimated results is found in the 1966 calibration,with a simulated fow of 6.5 m3/s,compared with an observed fow of 4.55 m3/s.The closest results of respective simulated and observed runoff are 14.3 m3/s and 14.5 m3/s in 1971,and 5.97m3/sand5.74m3/sin1976.Somegoodsimulationsarealso found in 1962 and 1984.
In the medium temporal calibration with respective periods of 13 years and 16 years,the objective function values resulting from the average parameter values are not satisfying. The values resulting from manual optimization give slightly better results compared with the averageNSE,RE,andRMSEvalues from the yearly calibration.In addition,the quality of the objective function values in the verifcation period is stable compared with the one in the calibration period.The results of each period are shown in Table 3.

Fig.8.Comparison of high fow simulation and observation in short temporal calibration.
In relation to high fow simulation,the delivery of a longer data period using average parameter values and manual optimization shows the most underestimated fows at 25.7 m3/s (0.537 times the observed fow of 47.9 m3/s)and 37.1 m3/s (0.774 times the observed fow of 47.9 m3/s).On average,the calibration using average parameter values delivers a fow ratio of 0.975,while the manual optimization result is 1.046. For detailed annual simulation using these methods,the high fow is shown in Fig.9.From allNSE,RE,andRMSEvalues and high fow simulation,the optimized parameter in the medium temporal calibration delivers a better simulation compared with that in the short temporal calibration.
The entire 30-year rainfall-runoff record was calibrated accordingtothesamepattern,resultinginanNSEof0.490 3,anREof 0.224 8,and anRMSEof 1.096 2 with the average parameter values,and anNSEof0.525 3,anREof-0.069 2,and anRMSEof 1.058 0 with manual optimization.TheNSEvalue results are not satisfying under this scheme.From the perspective of high fow simulation,the average fow ratios delivered with average parameter values and manual optimization are not satisfying: 0.547 9 and 0.671 2,respectively.Annual high fow simulation results utilizing the optimized parameter in long temporal calibration are shown in Fig.10.
In order to summarize all the simulations and analysis,the values of objective functions in each simulation scheme and scenarios with different methods of calibration and temporal scales,along with the high fow ratio,are presented in Table 4. The symbol*indicates a simulation using the average parameter values,while numbers without any symbol represent simulation using manual optimization.In regard to temporal scale selection,the value ofNSEis relatively constant at different temporal scales,while quite a signifcant improvement is found inREand the high fow ratio when using the medium temporal scale.Another fnding through comparison of these values is the unsuitability of using average parameter values to simulate rainfall-runoff relations.It can be seen thatusing average parameter values delivers simulation results that are hardly better than those delivered by manual optimization. Thus,calibration using average parameter values is not recommended.Although all the parameters through every year are available,simulation of the hydrological response at longer temporal scale requires calibration to be conducted without use of average parameter values,in order to ensure the quality of the simulation.
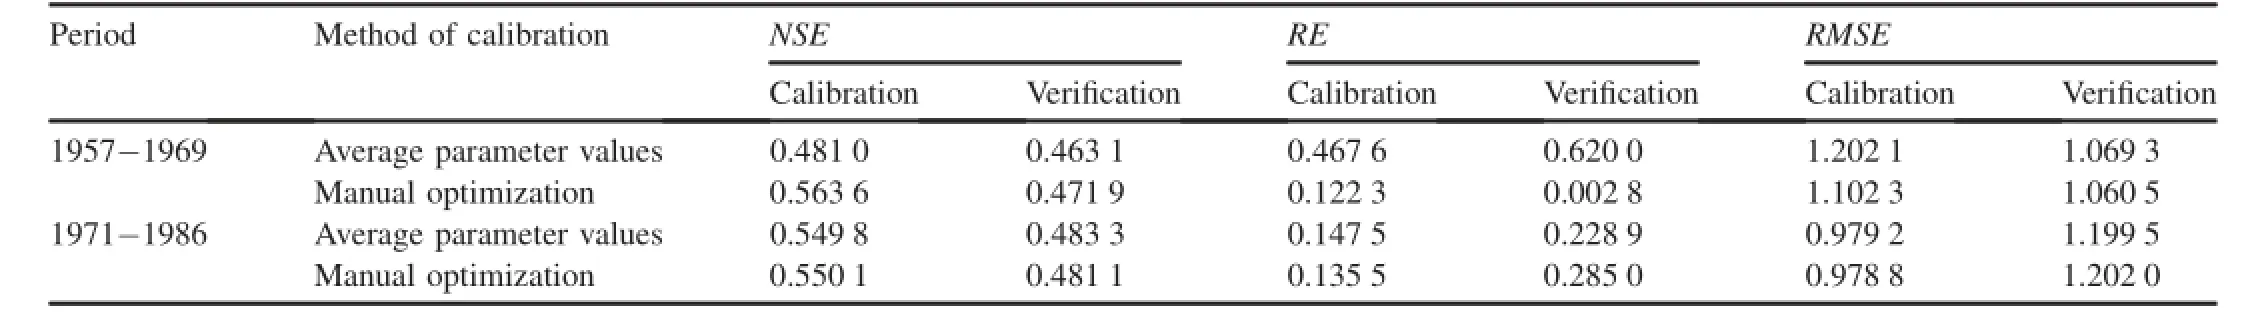
Table 3 HBV model simulation results in medium temporal calibration.
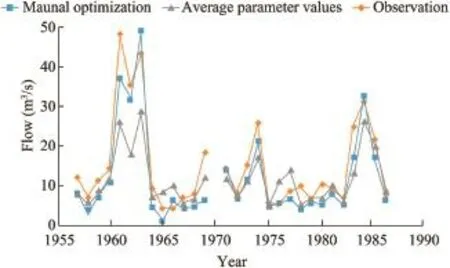
Fig.9.Comparison of high fow simulation and observation in medium temporal calibration.
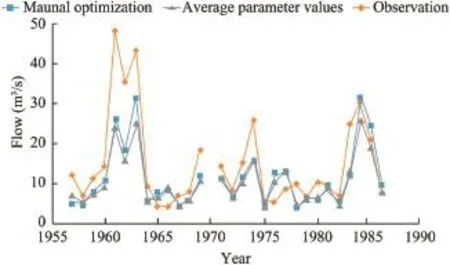
Fig.10.Comparison of high fow simulation and observation in long temporal calibration.
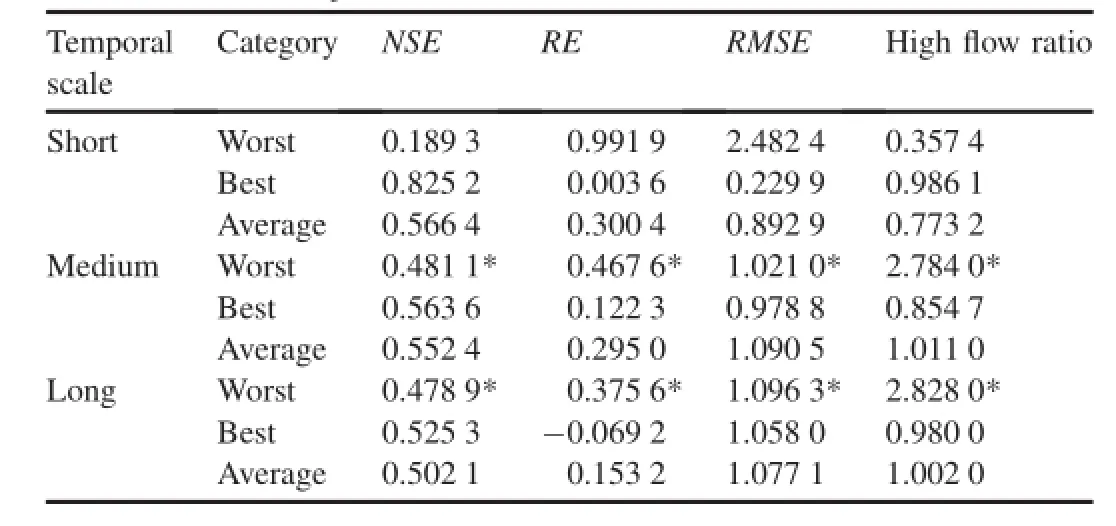
Table 4 Summarization of objective function values under various schemes.
4.Conclusions
This study evaluated the effects of various temporal scale selections in the HBV model simulation.Comparison of hydrological simulation using average parameter values from short temporal calibration and using manual optimization was also conducted.We can obtain the following conclusions:
(1)In Jiangwan Catchment hydrological modeling using the HBV model,Kf,α,K4,andPERCare the most sensitive parameters.This indicates that the land cover change in the Jiangwan Catchment is minimal,while,below the surface,the geological features include many gaps,since all the sensitive parameters are closely related to sub-surface parameters.
(2)From the short temporal(yearly)calibration,it is found that,despite the limited physical change in the Jiangwan Catchment,the values of the model parameters change every year,according to their own patterns and ranges.It is also found that,onaverage,thevaluesofNSE,RE,RMSE,andthehighfow ratio are 0.566 4,0.300 4,0.892 9,and 0.773 2,respectively.
(3)From the longer calibration periods,it is found that, in general,a better simulation is produced,as refected by thesignifcantimprovementofREfrom 0.300 4 to 0.295 0 with a medium temporal scale and,furthermore, to 0.153 2 with a long temporal scale.On the other hand,NSEandRMSEare quite stable,with different temporal calibrations.In terms of high fow estimation,better results are obtained in longer temporal calibrations.
(4)In general,the simulation results show appropriateness to the actual features of the Jiangwan Catchment.Various values ofKfand α are consistent with the geological features of the Jiangwan Catchment,which include faults and cracks. Variations ofPERCand a small value ofK4are refected by the trivial amount of infltration in the deep soil layer,and a small value ofCFLUXis indicated by limited capillary fow.
(5)Calibration using manual optimization for the longer temporal selection delivers a better simulation than calibration using average parameter values from the yearly calibrations,as shown fromNSE,RE,and the high fow ratio,butRMSEdelivers different results.
(6)Selection of longer periods of temporal variability in hydrological analysis delivers better simulation in general for water balance analysis,as expressed by the preferableNSE,RE,and high fow ratio values delivered with longer temporal variability.
Acknowledgements
We wish to express our gratitudes to Han-xiao Le and Li-li Zhu for their assistance in this work,especially in helping to translate cited worksand assisting in English-Chinese conversation.
Bari,M.A.,Smettem,K.R.J.,2006.A conceptual model of daily water balance following partial clearing from forest to pasture.Hydrol.Earth Sci.Syst. 10(3),321-337.http://dx.doi.org/10.5194/hess-10-321-2006.
Bergstrom,S.,1992.The HBV model:Its structure and applications.Swedish Meteorological and Hydrological Institute,Norrkoping.
Booij,M.J.,2005.Impact of climate change on river fooding assessed with different spatial model resolutions.J.Hydrol.303(1-4),176-198.http:// dx.doi.org/10.1016/j.jhydrol.2004.07.013.
Bronster,A.,Niehoff,D.,Burger,G.,2002.Effects of climate and land use change on storm runoff generation:Present knowledge and modelling capabilities.Hydrol.Process.16,509-529.http://dx.doi.org/10.1002/hyp.326.
Dance,N.,2012.Kajian Perubahan Karakteristik Hdirologi Daerah Aliran Sungai Cikapundung Hulu Menggunakan Model HBV96.B.S.Dissertation.Parahyangan Catholic University,Bandung(in Indonesian).
Das,T.,Bˊardossy,A.,Zehe,E.,He,Y.,2008.Comparison of conceptual model performance using different representations of spatial variability.J.Hydrol. 356(1-2),106-118.http://dx.doi.org/10.1016/j.jhydrol.2008.04.008.
Elfert,S.,Bormann,H.,2009.Simulatedimpact ofpast andpossiblefutureland usechangeson thehydrologicalresponseofthe NorthernGermanLowland,‘Hunte’Catchment.J.Hydrol.383(3),245-255.http://dx.doi.org/10.1016/ j.jhydrol.2009.12.040.
Gan,T.Y.,Dlamini,E.M.,Biftu,G.F.,1997.Effects of model complexity and structure,data quality and objective functions on hydrologic modelling.J. Hydrol.192(1-4),81-103.http://dx.doi.org/10.1016/S0022-1694(96) 03114-9.
Guo,S.L.,Wang,J.X.,Xiong,L.H.,Ying,A.W.,Li,D.F.,2002.A macro-scale andsemi-distributedmonthlywaterbalancemodeltopredictclimatechange impacts in China.J.Hydrol.268(1-4),1-15.http://dx.doi.org/10.1016/ S0022-1694(02)00075-6.
Liden,R.,Harlin,J.,2000.Analysis of conceptual rainfall-runoff modelling performance in different climates.J.Hydrol.238(3-4),231-247.http:// dx.doi.org/10.1016/S0022-1694(00)00330-9.
Lindstrom,L.,Johansson,B.,Persson,M.,Gardelin,M.,Bergstrom,S.,1997. Development and test of the distributed HBV-96 hydrological model.J. Hydrol.201(1-4),272-288.http://dx.doi.org/10.1016/S0022-1694(97) 00041-3.
Liu,J.T.,Chen,X.,Zhang,J.B.,Flury,M.,2009.CouplingtheXinanjiangmodel to a kinematic fow model based on digital drainage networks for food forecasting.Wiley Intersci.23(9),1337-1348.http://dx.doi.org/10.1002/ hyp.7255.
Liu,J.T.,Chen,X.,Wu,J.C.,Zhang,X.N.,Feng,D.Z.,Xu,C.-Y.,2012.Grid parameterization of a conceptual,distributed hydrological model through integration of a sub-grid topographic index:Necessity and practicability. Hydrolog.Sci.J.57(2),282-297.http://dx.doi.org/10.1080/02626667. 2011.645823.
Manfreda,S.,Fiorentino,M.,2008.A stochastic approach for the description of the water balance dynamics in a river basin.Hydrol.Earth Syst.Sci.12, 1189-1200.http://dx.doi.org/10.5194/hessd-5-723-2008.
Merz,R.,Bloschl,G.,2004.Regionalization of catchment model parameters.J. Hydrol.287(1),95-123.http://dx.doi.org/10.1016/j.jhydrol.2003.09.028.
Sanata,W.,2013.Analisis Neraca Air Harian DAS Cikapundung Hulu Menggunakan Model HBV96.B.S.Dissertation.Parahyangan Catholic University,Bandung(in Indonesian).
Singh,V.P.,1995.Computer Models of Watershed Hydrology.Water Resources Publications,Colorado.
Troch,P.,van Loon,E.,Hilberts,A.,2002.Analytical solutions to a hillslope storage kinematic wave equation for sub-surface fow.Adv.Water Resour. 25(6),637-649.http://dx.doi.org/10.1016/S0309-1708(02)00017-9.
Xiong,L.H.,Guo,S.L.,1999.A two-parameter monthly water balance model and its application.J.Hydrol.216(1),111-123.http://dx.doi.org/10.1016/ S0022-1694(98)00297-2.
Zhang,X.,Lindstrom,G.,1997.Development of an automatic calibration scheme for the HBV hydrological model.Hydrol.Process.11(2), 1671-1782.http://dx.doi.org/10.1002/(SICI)1099-1085(19971015)11:12<1671:AID-HYP497>3.0.CO;2-G.
Zhao,R.J.,Zuang,Y.L.,Fang,L.R.,Liu,X.R.,Zhang,Q.S.,1980.The Xinanjiang Model.Proceedings of the Oxford Symposium.IAHS.
Received 12 November 2014;accepted 22 September 2015
Available online 17 December 2015
This work was supported by the National Natural Science Foundation of China(Grant No.41271040),and the Special Fund of the State Key Laboratory of Hydrology-Water Resources and Hydraulic Engineering (Grant No.20145028012).
*Corresponding author.E-mail address:steven.reinaldo.rusli@gmail.com(Steven Reinaldo Rusli).
Peer review under responsibility of Hohai University.
http://dx.doi.org/10.1016/j.wse.2015.12.002
1674-2370/?2015 Hohai University.Production and hosting by Elsevier B.V.This is an open access article under the CC BY-NC-ND license(http:// creativecommons.org/licenses/by-nc-nd/4.0/).
 Water Science and Engineering2015年4期
- Water Science and Engineering的其它文章
- Observation and modeling of tide-and wind-induced surface currents in Galway Bay
- Deposited sediment settlement and consolidation mechanisms
- Seepage and stress analysis of anti-seepage structures constructed with different concrete materials in an RCC gravity dam
- Numerical simulation of fow past twin near-wall circular cylinders in tandem arrangement at low Reynolds number
- Analysis of effect of nicotine on microbial community structure in sediment using PCR-DGGE fngerprinting
- Impacts of water quality variation and rainfall runoff on Jinpen Reservoir, in Northwest China