
The spatial and temporal distribution and characteristics of inorganic ion concentrations of TSP in the Tarim Basin
2014-10-09 08:12:08YuTingZhongXinChunLiuZiAngFangQingHe
YuTing Zhong , XinChun Liu , ZiAng Fang , Qing He
1. Institute of Desert Meteorology, CMA, Urumqi, Xijiang 830002, China
2. Key Laboratory of Tree-ring Physical and Chemical Research of China Meteorological Administration/Xinjiang Laboratory of Tree Ring Ecology, Urumqi, Xijiang 830002, China
1 Introduction
Atmospheric aerosol is a multiple phase system including solid and liquid particles and the carrier gas(Wang, 1999), which is the main method of researching the atmospheric environment. Research shows that aerosols play an important role in global climate change,which not only directly influences the radiation balance through absorption and scattering of the sun’s shortwave radiation and the ground’s long wave radiation, but also can be used as a nuclear condensate. This process influences the physical process and optical properties of clouds, the formation and development of precipitation,and indirectly affects radiation balance (Zhang, 2007).Also, aerosol chemical composition not only reflect the local atmospheric environment, but also can be transmitted over a long distance and reflect atmosphere change in the global environment (Kang and Cong, 2006). Because of its small size and large surface area, aerosol particles are the reaction carrier of various compounds in the atmosphere, affect the atmosphere’s chemical composition and environment pollution level, and can transfer materials from air to the land surface through dry and wet deposition.
According to aerosol size (d) and the corresponding environmental effect, environmental air quality standards of China (GB 3095-1996) divide aerosol into Total Suspended Particulates (TSP: d<100 μm) and particulate matter (PM10: d<10 μm). In recent years, considering the effects on human health, aerosols can be sub-divided into lung particles (PM2.5: d<2.5 μm). TSP is the general name for all sorts of particles which are scattered in the atmosphere and is a general important pollution index of atmospheric quality assessment. TSP not only affects cloud formation and formulation of pollutant control countermeasures, but also enhances the intensity of urban island heat, and greatly influences atmospheric circulation and the hydrologic cycle (Menonet al., 2002; Jonssonet al., 2004). The study of TSP developed at the earliest due to relative easy observations, and is recently studied worldwide (Mouliet al., 2003; Taoet al., 2006; Liet al., 2008; Rastogi and Sarin, 2009; Shenet al., 2009).
Xinjiang Province is in a typical temperate zone with a continental arid climate. The ecological environment is relatively poor and suffers the harshest sandstorm weather in all of China. Due to the influence of the Taklimakan Desert, the Tarim Basin is a high-risk area of dust weather,with many regions experiencing annual sand-dust weather of over 100 days, and in particular the Hotan area can reach up to more than 200 days. While sand dust weather causes disasters to natural and anthropogenic environments through sand burial, wind erosion, cooling, land desertification and atmospheric pollution, dust aerosols can produce certain effects on the climate (Lianget al.,2008). There have been numerous studies on the characteristics of dust weather and its influence on the Tarim Basin (Liet al., 2008; Haimitiet al., 2010; Heet al.,2010; Luet al., 2010; Puet al., 2010), but little attention on the temporal and spatial distribution characteristics of TSP, especially ion concentration characteristics. In this paper, we collected TSP samples from four stations: Tazhong, Tikanli, Kashi, and Minfeng in 2009, analyzed the temporal and spatial distribution characteristics of TSP concentration, and studied chemical characteristics of water-soluble ions through the determination of main water-soluble ion concentration.
2 Research methods
2.1 Instruments
TSP samples were collected on glass fiber filters using a high-volume air sampler at a flow rate of 1.05 m3/min (Tianhong Intelligent Instrument Plant of Wuhan,China) at the four sites. This instrument drew the volume of gas (sampler entrance height is 1.5 m above the ground) through the weighed membrane for air suspended particles with a diameter of <100 μm. The sampling volume and membrane quality was determined after sampling, then TSP concentration was calculated. A Dionex ICS-3000 ion chromatograph was used to determine water-soluble inorganic ion concentrations of the collected TSP samples and blank. TSP mass loadings were determined gravimetrically using a Bs210s electronic balance with a sensitivity of 0.1 mg. A Millipore ultra-pure water system from the United States was used to produce ultra-pure water with a resistance rate of 18.2 MΩ/cm.
2.2 Reagent
According to a certain concentration proportion, we matched eight ion standard samples (F-, Cl-, SO42-, NO3-,Na+, K+, Mg2+, Ca2+) from the Chinese standard material standard sample information center, and NH4+single ion solution from the Shanghai Boyun Company to the standard mixed solution, producing a standard curve; the resistivity of ultra-pure water is 18.2 MΩ/cm; methane sulfonic acid solution is chromatography pure.
2.3 Sampling points layout
The China Meteorological Bureau’s sandstorm monitoring station network has been monitoring sandstorms since 2004. Xinjiang has four sandstorm monitoring stations in Urumqi, Hami, Tazhong and Hotan, respectively,and TSP observation project has been equipped in Hami,Tazhong and Hotan. According to dust frequency in the Tarim Basin, and in order to fully understand regional dust distribution and variation trends in the Tarim Basin,we added three new TSP monitoring points in April of 2007 in east (Tikanli), west (Kashi) and south (Minfeng)of the Tarim Basin.
2.4 Sample collection
TSP samples were collected from January 2009 to December 2009 with four sampling sites in Kashi, Minfeng, Tikanli and Tazhong. The TSP sampling membrane filter is glass fiber filter with an aperture of 0.45 μm. Before and after sampling, the blank and sample filter membrane was placed into a drying box, with a control drying temperature of 50±2 °C. The sample filter membrane was weighed after drying for 2–6 h at a constant temperature, then wrapped in baking aluminum foil,placed into a plastic bag and stored in a refrigerator at 4 °C until analysis. TSP samples were observed one time in a sandstorm period (spring) and collected one sample a day (when a sandstorm occurs and the instruments alarm is activated, the sampling membrane should be replaced timely, and all sampling membranes in one day should be combined, weighed and calculated). Except during the sandstorm event, TSP samples were collected twice in a period of ten days, which is 1, 6, 11, 16, 21 and 26, respectively for every month. TSP sampling time was 22 h from 08:30 to 06:30 of next day, and the calculation result was the daily average value.
2.5 Experimental analysis
Pretreatment: cut out about 1/4 sample film from the membrane and place into a 200 mL conical flask, fully immerse the film in 25 mL of ultra-pure water, then shake the flask in a ultrasonic extraction device for about 40 minutes, then add another 25 mL of ultra-pure water for ultrasonic extraction for another 40 minutes. Afterwards,transfer the extracted liquid into a 100 mL volumetric flask to retain a constant volume, and then filter the extracted liquid through a 0.45 mm microporous membrane filter into a sample bottle for future test.
The condition of ion chromatograph experiment: An AS11 analytical column (4×250 mm, Dionex), KOH eluent generator cartridge (EGC II KOH, Dionex) and 25 μL sample loop were employed for the determinations of anions, which included sulfate, nitrate, chloride and formate. The cations of interest, sodium, potassium, ammonium, magnesium and calcium, were determined by the same IC system with a CS12A analytical column (4×250 mm, Dionex), a 25 μL sample loop and MSA (EGC II MSA, Dionex) as the eluent.
3 Results and discussion
3.1 Characteristics of sand-dust weather in the study area
Through statistical analysis of dust weather data in Tazhong, Kashi, Tikanli and Minfeng in 2009 (Table 1),it can be seen that: Minfeng has the most annual sand-dust storm days of 31, followed by Tazhong with 10,Tikanli with 1, and Kashi with no sand-dust storms.Floating dust days in Tazhong are approximately equal to those in Minfeng, and Tikanli is the least; Tazhong has the highest dust weather days, followed by Kashi and Minfeng, and Tikanli is the least. The frequency and intensity of sand dust weather is the main factor effecting dust aerosol concentration in the desert area.

Table 1 Statistical results of sand-dust weather days during 2009 in Tazhong, Kashi, Tikanli and Minfeng
There were only 10 sand-dust storm days in Tazhong throughout the year, while floating dust and dust weather were more with a rising trend compared with previous years (Liuet al., 2011). This phenomenon is related to the expanding green belt around Tazhong station and large green belt areas beside the desert road and in the eastern and western slopes of the operation area in Tazhong. In addition, with intensified efforts of petroleum exploration in Tazhong, and increased anthropogenic activity and disturbance to the underlying surface, floating dust and dust times were increased and the sandstorm was inhibited.
The Hotan area, on the edge of the Taklimakan Desert,is one of the most serious affected regions for dust weather disasters. Minfeng, which is located in south of Taklimakan Desert, suffered from dust weather disasters throughout the year. Sand-dust storm days and dust days of Minfeng were 31 in 2009, and floating dust days reached 169 accounting for 46.3% for the entire year,concentrated mainly in spring and summer.
The number of sand-dust days for Kashi and Tikanli,located in the west and east edge of the Taklimakan Desert respectively, compared with Tazhong and Minfeng,was apparently less, which shows that sand-dust weather has a greater influence on the hinterland and south edge than the west and east edge of Taklimakan Desert.
3.2 Mass concentration distribution characteristics of TSP
Figure 1 shows the variation of monthly mean TSP concentrations in Tazhong, Tikanli, Kashi and Minfeng in 2009. Overall, this concentration shows the same tendency in the four observation points with peak values in April and May, low values in November and December,and the concentration rises gradually with increasing dust weather events from February to May. The sand-dust weather in the four observation points frequently occurred in March–September, with the highest occurrences in spring and the least in winter. Tazhong saw the highest number of sand-dust weather days, occurring almost every day from March to July, Minfeng was the second,and Tikanli was the least. Variation of monthly mean TSP concentrations and sand-dust weather had good consistency in the four observation points. TSP mass concentration of Tazhong is high overall, increasing from spring with a maximum value of 4,357.62 μg/m3in May,decreasing from June with a minimum value of 143.48 μg/m3in November. Minfeng is the second with a maximum value of 2,753.72 μg/m3in May and a minimum value of 269.58 μg/m3in December. The maximum value in Kashi is 1,364.52 μg/m3in April and the minimum value is 367 μg/m3in December. The maximum value in Tikanli is 1,398.93 μg/m3in August and the minimum value is 238.61 μg/m3in December. Distinguished from the other three stations, the maximum value of Tikanli appeared in August due to dust weather on August 11,and TSP mass concentration was far higher than that in sunny weather with a value of 4,263.39 μg/m3which greatly contributes to the monthly mean TSP concentration.
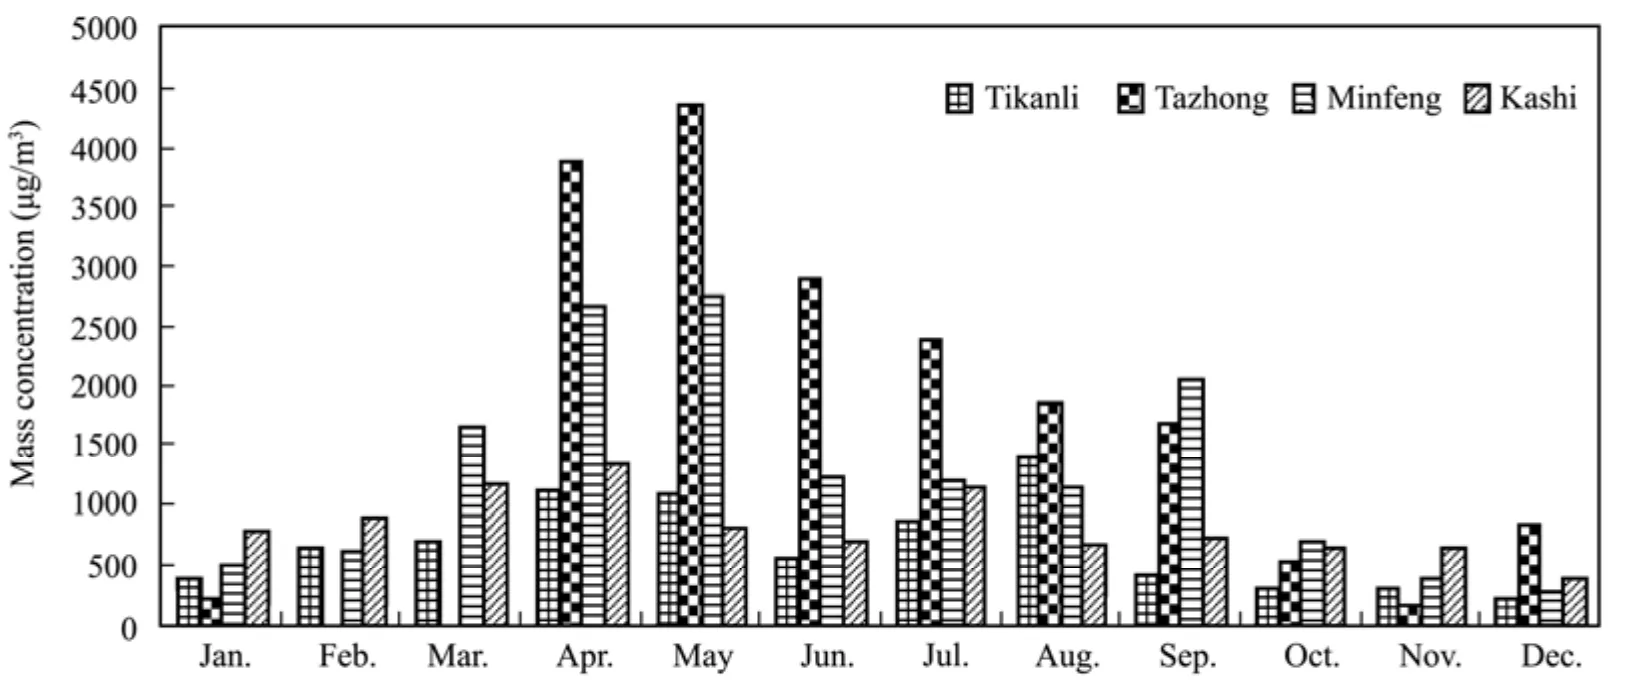
Figure 1 Variation of monthly mean TSP concentrations in Tazhong, Kashi, Tikanli and Minfeng in 2009
Figure 2 shows the variation of seasonal mean TSP concentrations in Tazhong, Kashi, Tikanli and Minfeng in 2009. Overall, the highest TSP mass concentration appeared in spring, followed by summer and autumn, and winter is the lowest. Dust weather days had the same changing trend, spring is the highest, followed by summer and autumn, and winter is the lowest. This shows that dust weather is the main factor influencing TSP mass concentration.
3.3 The characteristic of water-soluble ion concentration of TSP
3.3.1 The characteristic of water-soluble ion total concentration of TSP
Based on tested water-soluble inorganic ion composition of TSP samples in Tazhong, Tikanli, Kashi and Minfeng in 2009, this paper analyzed water-soluble inorganic ion distribution characteristics of atmospheric aerosol in the Tarim Basin. Figure 3 shows the variation of ion concentrations in Tazhong, Kashi, Tikanli and Minfeng in 2009, with marked high and low values of monthly mean concentration. Ion concentration is lower in January–February and October–December in each station because dust aerosols are less and heating intensity is weak in winter in the Tarim Basin. While high values of total ion concentrations of the four observation points were different, the maximum values of Tikanli and Minfeng is 179.3 μg/m3and 92.18 μg/m3, respectively in April; dust weather in Tikanli had the most frequent occurrence in April but that in Minfeng was in March. For Kashi, the maximum value is 53.29 μg/m3in July, and 259.7 μg/m3for Tazhong in September. The maximum value of Tazhong was several times higher than the other three stations due to the appearance dust weather on September 18 with a mass concentration of up to 4,070 μg/m3which is a major factor leading to significantly high total ion concentration. The variations of monthly average total ion concentrations and monthly average mass concentrations of TSP were not exactly the same.This shows that sand-dust weather is not the only reason which affects total ion concentration, and the difference of total ion concentration in each station needs further analysis.
Table 2 shows the total annual concentration of water-soluble inorganic ions of TSP in Tazhong, Kashi,Tikanli and Minfeng with the following sequence: Tazhong > Tikanli > Minfeng > Kashi. Ion concentrations of TSP samples are in the order of SO42-> Ca2+> Na+>Cl-> NO3-> Mg2+> K+> NH4+> F-in Tikanli, SO42->Ca2+> Cl-> Na+> NO3-> Mg2+> K+> NH4+> F-in Minfeng, SO42-> Ca2+> Cl-> Na+> NO3-> NH4+>Mg2+> K+> F-in Kashi, and SO42-> Cl-> Na+> Ca2+>NO3-> Mg2+> K+> NH4+> F-in Tazhong. It can be seen that the main water-soluble inorganic ions of TSP in the four stations are SO42-, Ca2+, Na+and Cl-. The sum concentration of the four ions (SO42-, Ca2+, Na+and Cl-)are 95%, 96%, 91% and 96% of total ion concentration in the four stations respectively, and the sum concentration of water-soluble secondary ions (SO42-, NO3-and NH4+)are 61%, 52%, 60% and 53% of total ion concentration respectively, while SO42-concentrations are 58%, 50%,54%, and 51% of total ion concentration respectively.Thus, secondary ions especially SO42-have a serious effect on the Tarim Basin. Ca2+concentrations are 13%,16%, 16%, and 11% of total ion concentration, Na+concentrations are 12%, 13%, 10%, and 12% of total ion concentration, Cl-concentrations are 12%, 16%, 11%,and 22% of total ion concentration, respectively, thus,sulfate salt, calcium salt, sodium and chloride ion are the main inorganic constituents of TSP in the Tarim Basin.

Figure 2 Variation of seasonal mean TSP concentrations in Tazhong, Kashi, Tikanli and Minfeng in 2009
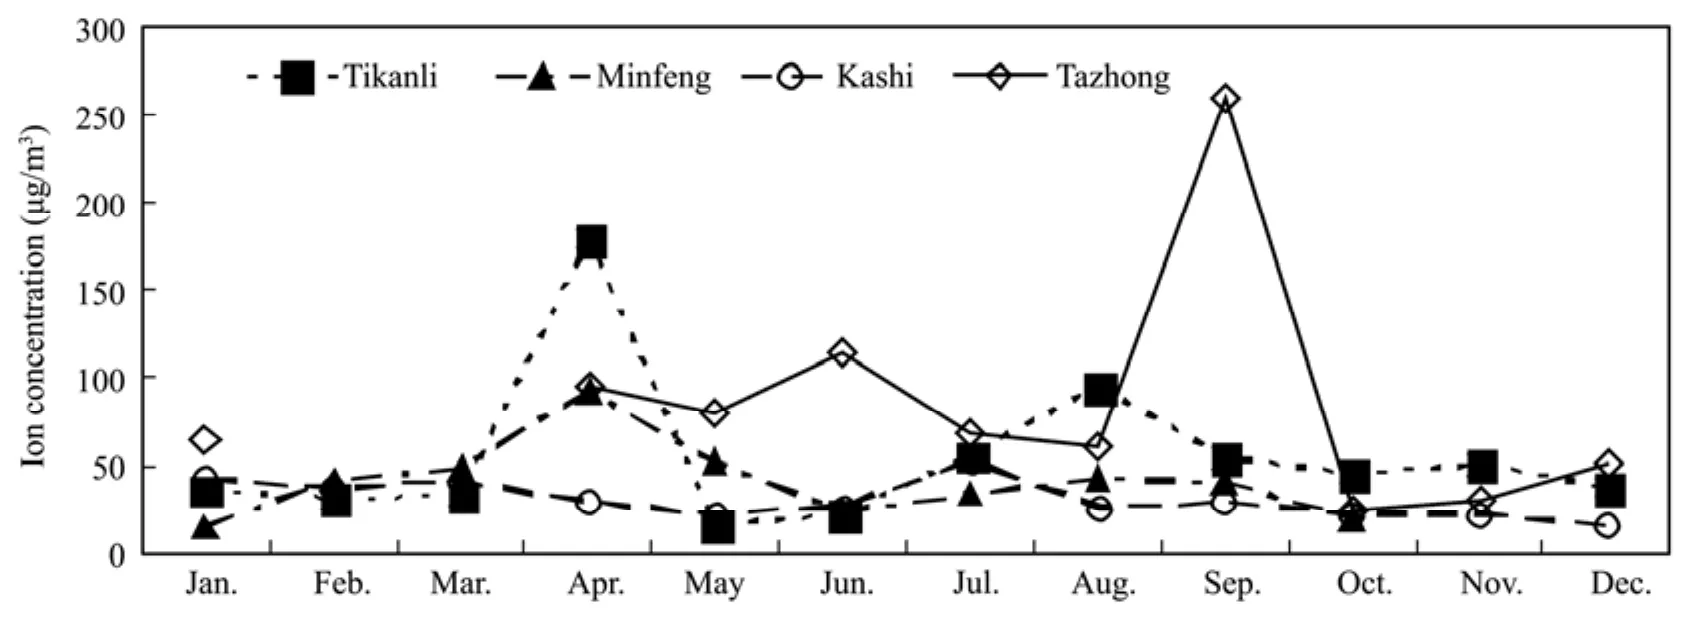
Figure 3 Variation of water-soluble inorganic ion total concentrations of TSP in Tazhong, Kashi, Tikanli and Minfeng in 2009

Table 2 Total annual concentration of water-soluble inorganic ions of TSP in Tazhong, Kashi, Tikanli and Minfeng
3.3.2 The variation characteristic of ion monthly concentration
Figure 4 shows variation of water-soluble inorganic ion monthly concentrations of TSP in Tazhong, Kashi,Tikanli and Minfeng in 2009. There were three ion concentration peaks in February, April and July respectively for Tazhong, while ion concentration of the other three stations show double-peak change with peaks for Tikanli and Minfeng in April and August, respectively, and for Kashi in July. We analyzed the monthly concentration characteristics of each ion below, but F-concentration was not discussed because of its low concentration.
Na+is one of the major cations of the four stations, its highest value is 26.53 μg/m3for Tikanli in April and the lowest value is 1.42 μg/m3for Kashi in September. The four stations had the same inverted "U" shape change trend, with the highest value in April. The dust weather in Tazhong had the most frequent occurrence and Na+annual concentration of Tazhong was the highest of the four stations. The Tarim Basin is far inland, which shows that soil and sand were the main source of Na+.

Figure 4 Variation of water-soluble inorganic ion monthly concentrations of TSP in Tazhong, Kashi, Tikanli and Minfeng in 2009
NH4+concentrations in the four stations were relatively low with the maximum value of 2.55 μg/m3for Kashi in July and the minimum value of 0.03 μg/m3for Tazhong in October. NH4+was not detected in Tazhong samples from April to August, in Kashi samples from March to May and from August to October, in Tikanli samples from April to October and in Minfeng samples from May to September. The high value of NH4+concentration is in January and December, while unlike the other three stations, the high value of Kashi appeared in July.Ammonia is the only alkaline gas in the atmosphere,which mainly comes from natural processes such as animal and plant activity emissions, decay of dead animals and plants and soil microbial emissions. Gaseous ammonia and secondary pollutants sulfuric acid and nitric acid from atmospheric chemical processes combine into ammonium sulfate and ammonium nitrate, and ammonia can react with gaseous hydrogen chloride to form ammonium chloride. During dust weather process, strong alkaline ion concentrations (Ca2+and Na+) increase, destroying the ammonium salt structure. Thus, NH4+is converted into NH3and released into the atmosphere and NH4+concentration decreased significantly.
Variation of K+concentration over time is not obvious with a maximum value of 2.10 μg/m3for Tazhong in September and a minimum value of 0.10 μg/m3for Kashi in March. Variation of Mg2+concentration over time is also not obvious, with the highest value of 2.16 μg/m3for Tikanli in August and the lowest value of 0.06 μg/m3for Kashi in December.
Ca2+proportion is the largest of the five types of cations and the high concentration value is concentrated in April–September with a maximum value of 29.98 μg/m3for Tazhong in September and a minimum value of 1.62 μg/m3for Minfeng in January. Ca2+is the soil dust identity element which comes from the soil. When dust weather occurs, Ca2+concentration increases significantly.Tazhong is located in the hinterland of the Taklimakan Desert, with perennial sand-dust storms, floating dust and dust weather, thus Ca2+concentration is significantly higher than in the other three stations. In addition, the other three stations located on the edge of the Taklimakan Desert have less perennial rainfall, low vegetation coverage and less winter snow which is also the reason why Ca2+ions become the main ingredient of cations.
The highest concentration of anions is SO42-, which has the same inverted "U" shape trend as Na+with a maximum value of 118.50 μg/m3for Tazhong in September and a minimum value of 7.31 μg/m3for Minfeng in October. SO2from human emissions is oxidized in the atmosphere and turned into sulfuric acid and sulfate which are the main source of SO42-. Coal combustion and industrial pollution are the major source of SO42-.Sulfate is the main component of Taklimakan Desert dust.When dust weather occurs, a large proportion of dust is diffused in the air, atmospheric sulfate increases and SO42-concentration increases accordingly.
Cl-is one of the main anions with a maximum value of 94.36 μg/m3for Tazhong in September and a minimum value of 0.77 μg/m3for Tikanli in June. The variation tendency of the four stations is substantially the same with a high value in April. Cl-is seconded only to SO42-,its general source is sea salt particles. The Tarim Basin is located far inland and its major source is dust aerosol. In addition, fossil fuel (such as coal) combustion can also release chloride which easily exists as fine particles in the atmosphere. This is an important reason why Cl-winter concentration is high in the Tarim Basin.
Seasonal variation of NO3-concentration is not obvious with a maximum value of 3.49 μg/m3for Tazhong in June and a minimum value of 0.36 μg/m3for Minfeng in January. Nitrogen oxides which are initial sources of NO3-in atmospheric particles are mainly produced by vehicle exhaust. Because of the effumability of nitric acid,the formation of atmospheric particles is sensitive to factors of temperature and relative humidity, and it is difficult to comprehend atmospheric chemistry and physics regularity of NO3-.
3.3.3 The variation characteristic of ion seasonal concentration
Figure 5 shows the variation of water-soluble inorganic ion seasonal concentrations of TSP in Tazhong,Kashi, Tikanli and Minfeng in 2009. It can be seen that high values of Na+concentration are concentrated in spring for the four stations with the highest value in Tazhong and the low values are concentrated in autumn and winter, which also proves that the main source of Na+is local dust. NH4+concentration is low in spring and summer and high in autumn and winter. The reason is that dust weather occured more in spring and summer, thus NH4+can be changed into NH3easily and released into the atmosphere, while in autumn and winter, NH4+and secondary pollutants (sulfuric acid and nitric acid) can be combined to form salts. K+and Mg2+concentrations had no obvious seasonal differences in the four stations and are relatively low. Seasonal variation of Ca2+concentration is large in spring and summer and small in autumn and winter with the lowest value in winter. Unlike the other three stations, Ca2+concentration of Tazhong is higher in autumn, which had a great relationship with the September 18 sample as previously mentioned.

Figure 5 Variation of water-soluble inorganic ion seasonal concentrations of TSP in Tazhong, Kashi, Tikanli and Minfeng in 2009
Seasonal variation of Cl-concentration is obvious in the four stations with the highest value in spring and a lower value in the other three seasons. In accordance with Ca2+, Cl-concentration of Tazhong is abnormally high in autumn which is also due to the September 18 sample.This shows that Cl-and Ca2+have the same source—dust aerosol. Seasonal variation of SO42-concentration in the four stations is not very obvious, because during non-heating periods dust weather increases such that SO42-concentrations become high, while during heating periods dust weather decreases significantly, and coal combustion becomes the main source of SO42-, resulting in high SO42-concentration in the four stations perennially. NO3-concentration of Tazhong is the highest of the four stations due to expanding oil exploration, increasing machinery and vehicle use, industrial pollution and increasing emission. There is no consistency with seasonal variation of NO3-concentration and dust weather days of the other three stations, which explains why dust weather had little effect on NO3-concentration.
3.4 Balance analysis of water soluble ions
Compositions such as HCO3-/CO32-and organic acids of the four stations’ samples were not tested, but the nine ions detected had a good overall correlation. Figure 6 shows a balance analysis between cations and anions of TSP in Tazhong, Kashi, Tikanli and Minfeng in 2009.Correlation coefficients of Tikanli, Minfeng, Kashi and Tazhong are 0.99, 0.99, 0.25 and 0.91, respectively. The three stations had a good correlation except Kashi, indicating that the measured data was effective. Correlation coefficient of Kashi is low, possibly due to the relatively high concentration of non-detected ions except the nine ions in TSP. In addition, the average anionic concentration is 2.57, 2.12, 2.15 and 3.02 times the average cationic concentration, indicating that cations and anions of the four stations were unbalanced because of non-detected high concentration cations such as H+.
Secondary aerosols SO42-and NO3-are the main anions in atmospheric aerosol, which reflect the impact of anthropogenic activity on the atmospheric environment.SO42-mainly comes from coal combustion and the emission source position fixes relatively, while NO3-mainly comes from oil and gas combustion and the emission sources are mobile motor vehicles. Therefore,SO42-/NO3-ratio in aerosols reflects the relative importance of stationary and mobile sources (Yeet al., 2003;Wanget al., 2005; Shenet al., 2007). According to S and N contents in coal, gasoline and diesel fuel, it is assumed that S and N are completely converted into SO42-and NO3-, respectively. SO42-/NO3-ratio, coming from coal combustion, is about 2.58 (charge concentration ratio)and SO42-/NO3-ratio, coming from gasoline and diesel combustion, is about 0.10–0.16. In these samples,SO42-/NO3-ratio in Tazhong is 3.89–28.69 with an average value of 13.54, SO42-/NO3-ratio in Kashi is 5.05–23.27 with an average value of 10.29, SO42-/NO3-ratio in Tikanli is 5.56–36.58 with an average value of 19.76 and SO42-/NO3-ratio in Minfeng is 5.58–24.95 with an average value of 16.56. This shows that the impact of fixed emission sources in the four regions on the atmosphere is far greater than that of mobile emission sources.

Figure 6 Balance analysis between cations and anions of TSP in Tazhong, Kashi, Tikanli and Minfeng in 2009
4 Conclusions
Based on TSP observations of Tazhong, Tikanli, Kashi and Minfeng in 2009 combined with analysis of water-soluble inorganic ions, the conclusions are as follows:
1) Monthly average concentrations of TSP shows the same trend in Tazhong, Tikanli, Kashi and Minfeng with peak values in April–May and low values in November–December. TSP mass concentration increases with a gradual increase of dust weather from February to May.As for the quarter average mass concentration trends,spring is the highest, followed by summer and autumn,with winter as the lowest.
2) Total annual concentration of water-soluble inorganic ions in TSP is as follows: Tazhong > Tikanli >Minfeng > Kashi. Ion concentrations of TSP samples are in the order of: SO42-> Ca2+> Na+> Cl-> NO3->Mg2+> K+> NH4+> F-in Tikanli, SO42-> Ca2+> Cl->Na+> NO3-> Mg2+> K+> NH4+> F-in Minfeng,SO42-> Ca2+> Cl-> Na+> NO3-> NH4+> Mg2+> K+>F-in Kashi, and SO42-> Cl-> Na+> Ca2+> NO3->Mg2+> K+> NH4+> F-in Tazhong. SO42-concentrations are 58%, 50%, 54%, and 51% of total ion concentration,respectively. Ca2+concentrations are 13%, 16%, 16%,and 11% of total ion concentration, respectively. Na+concentrations are 12%, 13%, 10%, and 12% of total ion concentration, respectively. Cl-concentrations are 12%,16%, 11%, and 22% of total ion concentration, respectively in the four stations. Thus, sulfate, calcium salt, sodium and chloride ions are the main inorganic constituents of TSP in the Tarim Basin.
3) Correlation coefficients of Tikanli, Minfeng, Kashi and Tazhong are 0.99, 0.99, 0.25 and 0.91, respectively.The three stations had a good correlation except Kashi.The average anionic concentration is 2.57, 2.12, 2.15 and 3.02 times that of average cationic concentration, indicating that cations and anions of the four stations did not balance.
4) In these samples, the change range of SO42-/NO3-ratio in Tazhong is 3.89–28.69 with an average value of 13.54, the change range of SO42-/NO3-ratio in Kashi is 5.05–23.27 with an average value of 10.29, the change range of SO42-/NO3-ratio in Tikanli is 5.56–36.58 with an average value of 19.76 and the change range of SO42-/NO3-ratio in Minfeng is 5.58–24.95 with an average value of 16.56. This shows that the impact of fixed emission sources in the four regions on the atmosphere is far greater than mobile emission sources.
This project was supported by Central Nonprofit Research Institutes Fundamental Research Funds for Project(No. IDM201003), Natural Science Foundation of China(Nos. 41175017, 41175140) and China Desert Meteorological Science Research Funds (Sqj2009014). We also thank anonymous reviewers for English improvements.
Haimiti Y, Leng ZX, Gao QZ, 2010. Change of average air temperature and precipitation at Yutian Oasis in the southern part of Tarim Basin during 1960–2007. Journal of Desert Research, 30(3): 654–659.
He Q, Liu Q, Yang XH,et al., 2010. Profiles of atmosphere boundary layer ozone in winter over hinterland of Taklimakan Desert. Journal of Desert Research, 30(4): 909–916.
Jonsson P, Bennet C, Eliasson I,et al., 2004. Suspended particulate matter and its relations to the urban climate in Dares Salaam, Tanzania. Atmospheric Environment, 38(25): 4175–4181.
Kang SC, Cong ZY, 2006. Progress in study on precipitation and aerosol chemistry in the Tibetan Plateau. Journal of Glaciology and Geocryology, 28(3): 371–379.
Li JC, Dong ZB, Wang XM,et al., 2008. Seasonal distribution and causes of dust events in Tarim Basin. Journal of Desert Research,28(1): 142–148.
Li YY, Xiao HY, Liu XY,et al., 2008. The chemical characteristics and seasonal variation of water-soluble inorganic ions in TSP in Guiyang. Bulletin of Mineralogy, Petrology and Geochemistry, 27(1):493–494.
Liang Y, Liu XC, He Q,et al., 2008. Analysis on total dust fall during spring and summer in Xinjiang. Journal of Desert Research, 28(5):992–994.
Liu XC, Zhong YT, He Q, 2011. Spatial and temporal characteristics and influencing factors of PM10in the hinterland of Taklimakan Desert and the surrounding areas. Journal of Desert Research, 31(2):323–330.
Lu H, Wei WS, Liu MZ,et al., 2010. Aerosol scattering properties in the hinterland of Taklimakan Desert. Journal of Desert Research,30(3): 660–667.
Menon S, Hansen J, Nazarenko L,et al., 2002. Climate effects of black carbon aerosols in China and India. Science, 297: 2250–2253.
Mouli CP, Mohan VS, Reddy JS, 2003. A study on major inorganic ion composition of atmospheric aerosols at Tirupati. Journal of Hazardous Materials, B96: 217–228.
Pu ZC, Zhang SQ, Li JL,et al., 2010. Climate change of area around Taklimakan desert during 1961–2007. Journal of Desert Research,30(2): 413–421.
Rastogi N, Sarin MM, 2009. Quantitative chemical composition and characteristics of aerosols over western India: one-year record of temporal variability. Atmospheric Environment, 43: 3481–3488.
Shen ZX, Huo ZQ, Han YM,et al., 2009. Chemical composition of water-soluble ions in aerosols over Xi’an in heating and non–heating seasons. Plateau Meteorology, 28(1): 151–158.
Shen ZX, Li LZ, Du N,et al., 2007. Mass concentration and water-soluble ions in spring aerosol (PM2.5) at Xi’an. Ecology and Environment, 16(4): 1193–1198.
Tao J, Chen GC, Zhong CQ, 2006. Chemical characteristics of water-soluble components in TSP over Chongqing. Environmental Monitoring in China, 22(6): 71–74.
Wang MX, 1999. Atmospheric Chemistry. China Meteorological Press,Beijing, pp. 166–167.
Wang Y, Zhuang GS, Tang AH,et al., 2005. The ion chemistry and the source of PM2.5 aerosol in Beijing. Atmospheric Environment, 39:3771–3784.
Ye BM, Ji XL, Yang HZ,et al., 2003. Concentration and chemical composition of PM2.5 in Shanghai for a 1-year period. Atmospheric Environment, 37: 499–510.
Zhang XY, 2007. The research of atmospheric aerosol and its climate effect in China. Advance in Earth Sciences, 22(1): 12–16.
 Sciences in Cold and Arid Regions2014年2期
- Sciences in Cold and Arid Regions的其它文章
- The atmospheric circulation patterns influencing the frequency of spring sand-dust storms in the Tarim Basin
- Ecological adaptation of Reaumuria soongorica root system architecture to arid environments
- Earthquakes as a potential contributing factor to climate change at multi-decadal scale
- Role of blowing snow in snow processes in Qilian Mountainous region
- Greenland Ice Sheet surface melt: A review
- A new MODIS daily cloud free snow cover mapping algorithm on the Tibetan Plateau