
Towards full predictions of temperature dynamics in McNary Dam forebay using OpenFOAM
2013-06-22 13:25:24YuShiWANGMarcelaPOLITANORyanLAUGHERY
Water Science and Engineering 2013年3期
Yu-Shi WANG, Marcela POLITANO*, Ryan LAUGHERY
1. IIHR-Hydroscience and Engineering, The University of Iowa, Iowa City, IA 52242, USA 2. U.S. Army Corps of Engineers, Walla Walla District, Walla Walla, WA 99362, USA
Towards full predictions of temperature dynamics in McNary Dam forebay using OpenFOAM
Yu-Shi WANG1, Marcela POLITANO*1, Ryan LAUGHERY2
1. IIHR-Hydroscience and Engineering, The University of Iowa, Iowa City, IA 52242, USA 2. U.S. Army Corps of Engineers, Walla Walla District, Walla Walla, WA 99362, USA
Hydroelectric facilities impact water temperature; low velocities in a reservoir increase residence time and enhance heat exchange in surface layers. In this study, an unsteady three-dimensional model was developed to predict the temperature dynamics in the McNary Dam forebay. The model is based on the open-source code OpenFOAM. RANS equations with the Boussinesq approximation were used to solve the flow field. A realizablek-εmodel that accounts for the production of wind turbulence was developed. Solar radiation and convective heat transfer at the free surface were included. The result of the model was compared with the field data collected on August 18, 2004. Changes in diurnal stratification were adequately predicted by the model. Observed vertical and lateral temperature distributions were accurately captured. Results indicate that the model can be used as a numerical tool to assess structural and operational alternatives to reduce the forebay temperature.
three-dimensional numerical simulation; water temperature; reservoir; thermal dynamics; OpenFOAM;McNary Dam forebay
1 Introduction
Hydropower, the most widely used form of renewable energy around the world, has been rapidly growing in prevalence over the past several decades. Hydropower is characterized by low costs, flexibility in power production, and reliability. According to the U.S. Department of Energy (DOE), about 40% of U.S. hydropower is derived from the Columbia River Basin, and up to 70% of the electricity supply in the Pacific Northwest region is generated from hydropower.
In spite of all these benefits, hydropower also has negative impacts on the local environment and ecosystem due to the modification of rivers from free flow streams to impounded reaches. The construction of large dams and reservoirs, required for the operation of hydroelectric power stations, changes the natural flow conditions, pool elevation, and channel morphology, and blocks spatial connections and historic fish migration pathways in rivers.
One negative impact of hydropower is the elevated water temperature in the reservoirupstream of a dam during summer, which disrupts the natural temperature dynamics. Temperature models using a one-dimensional approach have been constructed over the last few decades. Stefan and Ford (1975) developed a deterministic, process-oriented, unsteady, one-dimensional lake water quality model. The model uses a one-dimensional vertical transport equation to predict temperature as a function of depth and time. The authors successfully applied the model to several lakes (Stefan et al. 1980; Ford and Stefan 1980). A later study by Hondzo and Stefan (1993) generalized the temperature model for a wide range of lakes and meteorological conditions. The surface wind mixing, vertical turbulent diffusion, convective heat transfer, and heat flux from solar radiation were incorporated into the model by regression analysis of field data. Kirillin (2010) coupled a global climate model with a one-dimensional lake temperature model to evaluate the impact of global warming on lakes. The model revealed relationships between daily or monthly mean air and water temperatures. This one-dimensional approach fails when the horizontal advective term cannot be neglected. Another commonly used one-dimensional approach assumes a well-mixed temperature for any cross-section. Gooseff et al. (2005) used this approach to evaluate the effects of climate change on water temperature in the lower Madison River. However, this approach cannot be used to predict thermal stratification in a reservoir.
Multi-dimensional models accounting for the temperature distribution in both vertical and longitudinal directions have been extensively applied in many studies. Lei and Patterson (2002) used two-dimensional Navier-Stokes and energy equations with the Boussinesq approximation to study the natural convection in a reservoir sidearm subject to solar radiation. Bednarz et al. (2009) used a similar approach to investigate the transient flow response to periodic temperature changes at the water surface in a reservoir model. Their two-dimensional reservoir model consisted of a sloping bottom region and a uniform water depth region. The unsteady flow pattern and stable stratification obtained in the numerical simulations were validated with experiments (Bednarz et al. 2008). Fan et al. (2009) used a three-dimensional model to simulate the lateral and vertical water temperature distributions in the Fenhe Reservoir. The parameters of the model were calibrated with field data, and the simulation results were consistent with measurements. Liu and Chen (2012) used the three-dimensional circulation model developed by Zhang and Baptista (2008) to simulate the water temperature dynamics at a buoy station of Yuan-Yang Lake in north-central Taiwan. Water temperatures measured at different depths were used to calibrate and validate the model. Temporal and spatial distributions were satisfactorily predicted by the model.
A fully three-dimensional model, assuming a non-hydrostatic approach was used to predict the hydrodynamics and temperature distribution at McNary Dam (Politano et al. 2008). The authors used the commercial code Fluent. The heat flux and solar radiation were included by using the user-defined functions (UDFs). The heat convection at the water-air interface was incorporated into the model to consider the air temperature and effects of the wind. Good agreement between the numerical results and field data measured on August 18, 2004 wasobtained except near the water surface. This model improved the prediction of temperature in large-scale flows.
In this study, a three-dimensional numerical model was developed extending the approach of Politano et al. (2008) using the open-source code OpenFOAM. The model aims to more accurately simulate the temperature dynamics and distribution, particularly near the water surface. The effect of wind shear stress on the temperature distribution was negligible (Politano et al. 2006) and therefore was not considered in this study. Turbulence caused by wind was added to the realizablek-εmodel to account for the temperature mixing near the free surface. Simulation results were compared with the field data from August 18, 2004 and numerical results from Politano et al. (2008).
2 Study area and data collection
2.1 McNary Dam
McNary Dam, one of the largest hydroelectric power facilities in the Pacific Northwest Region, is a concrete gravity dam that spans the main stream of the Columbia River. It is about 2.25 km long and 56 m above the streambed, and located at river kilometer (rkm) 470 upriver from the mouth of the Columbia at Astoria, Oregon. The project is operated by the U.S. Army Corps of Engineers (USACE), Walla Walla District. Fig. 1 shows an aerial Google Earth photo of McNary Dam. Construction of McNary Dam began in 1947 and was completed with all powerhouse units operating in 1957. The dam comprises twenty-two spillway bays and a powerhouse that contains fourteen 70 MW generator units.
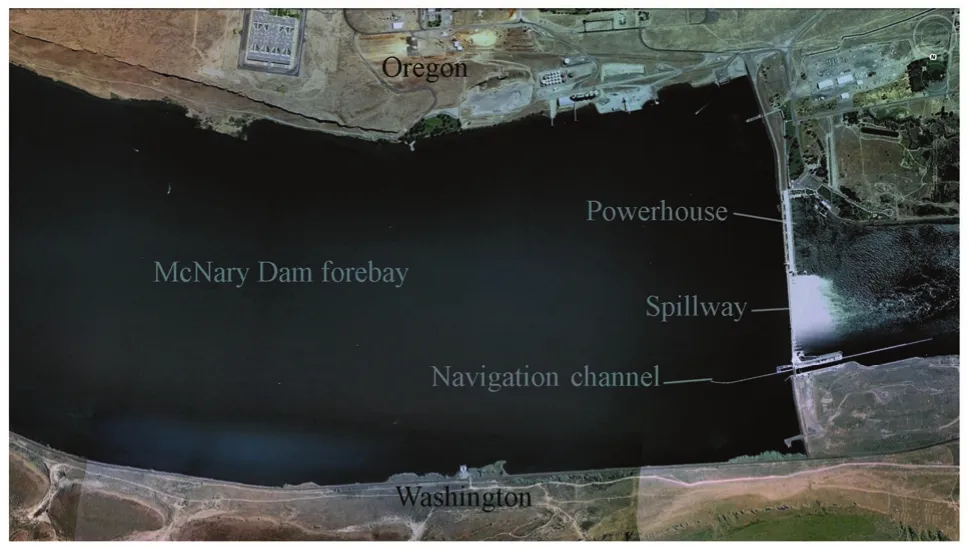
Fig. 1 Aerial view of McNary Dam forebay (source: Google Earth)
2.2 Data collection and simulation conditions
Fig. 2 shows data collection stations along with bathymetric information in the study domain. Water temperature was measured at 46 stations along six transects (T1-T6) every 15 minutes during the summer of 2004 by USACE. The model extended about 4 100 m upstream of the dam to minimize the influence of the boundary condition. Weather conditions including the air temperature, longwave radiation, incident shortwave radiation, and wind magnitude were collected every 10 minutes by the Walla Walla District/OA Systems Weather Station.
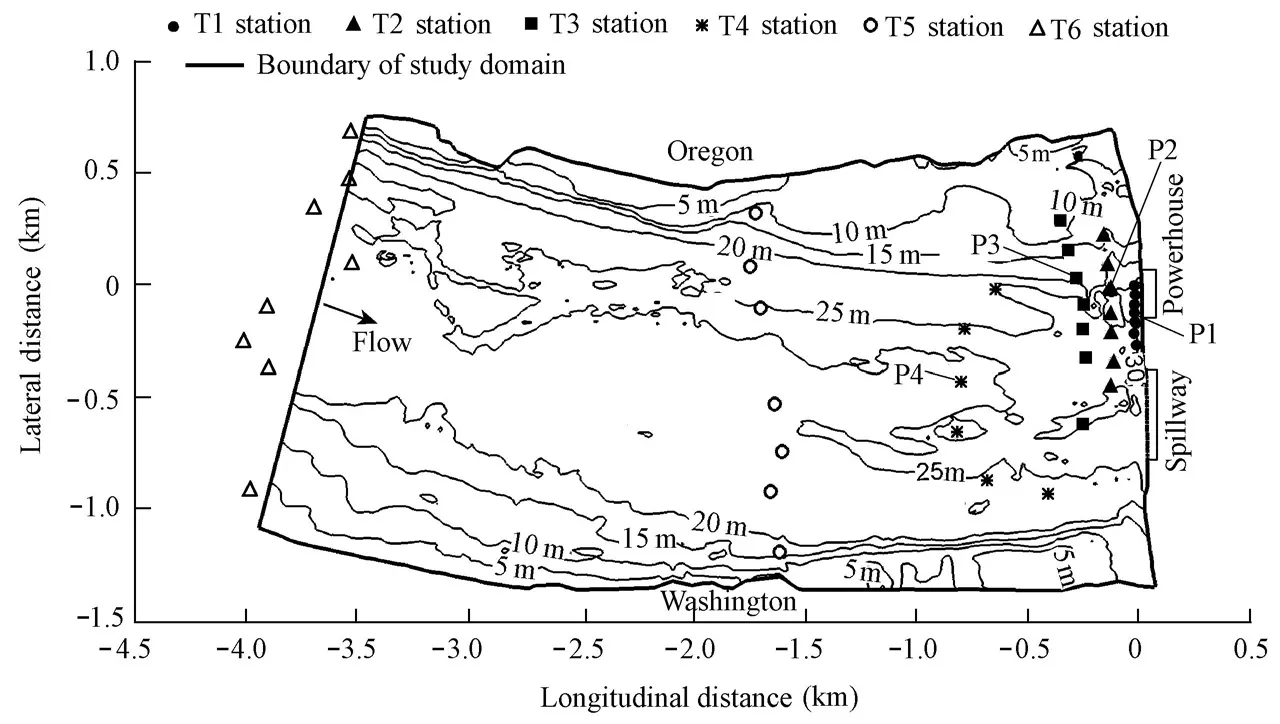
Fig. 2 McNary Reservoir bathymetry and data collection sites
In this study, atmospheric and operational conditions on August 18, 2004 were used to simulate the flow field and temperature dynamics in the McNary Dam forebay. Hourly water temperature data collected at T6 were used as the inlet temperature condition. Temperature measurements at T6 were interpolated and imposed at the inflow boundary. Fig. 3 shows the inlet temperature contours along the vertical profile at 6:00 am, 12:00 am, 6:00 pm, and 12:00 pm. The average river flow on August 18, 2004 was 4 380 m3/s. The measured air temperature and incident radiation are shown in Fig. 4. The incident radiationS0was calculated as the difference between the measured incoming and reflected solar radiation. Data collected between 9:00 am and 5:00 pm were distributed in a scattered way due to the effects of the reflection and absorption of clouds.
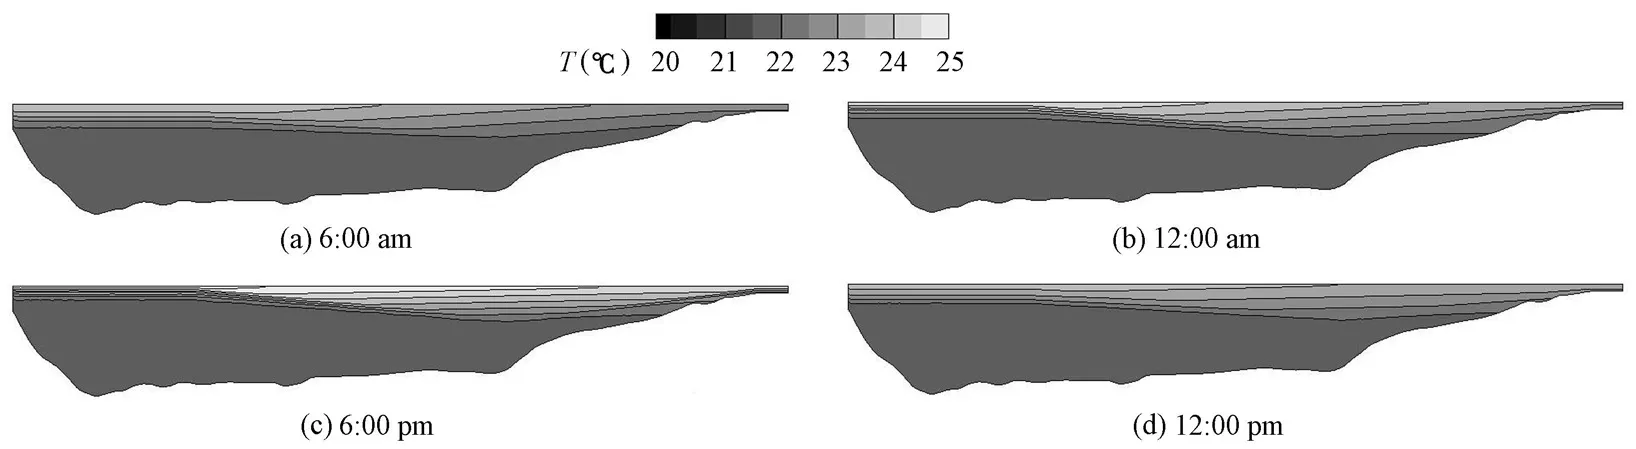
Fig. 3 Inlet boundary temperature contours along vertical profile on August 18, 2004
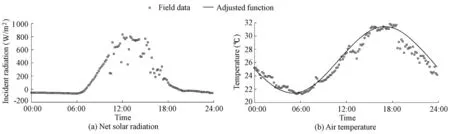
Fig. 4 Atmospheric conditions on August 18, 2004
3 Mathematical models
3.1 RANS equations
The river hydrodynamics were solved with the incompressible RANS equations with the Boussinesq approximation:
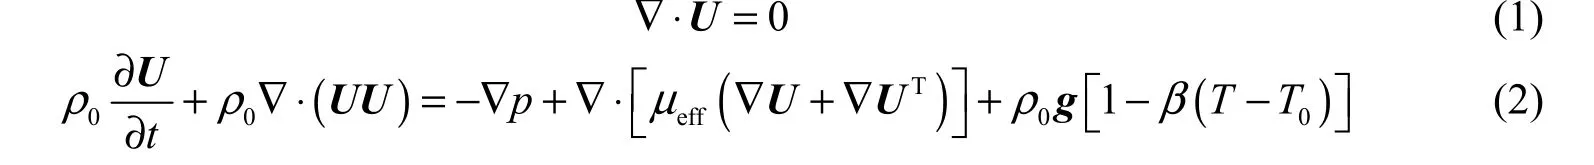
whereUis the velocity;tis time;pis the pressure;Tis the water temperature;gis the acceleration due to gravity;βis the thermal expansion coefficient;ρ0is the water density at the reference temperatureT0=25℃; andμeffis the effective viscosity, andμeff=μ+μt, withμandμtdenoting the molecular and turbulent viscosity, respectively.
Studies have shown that the realizablek-εmodel provides better results than standard or other traditionalk-εmodels in many cases involving complex secondary flow features (Shih et al. 1995). In this model, the turbulent kinetic energykand the turbulent dissipation rateεare obtained from
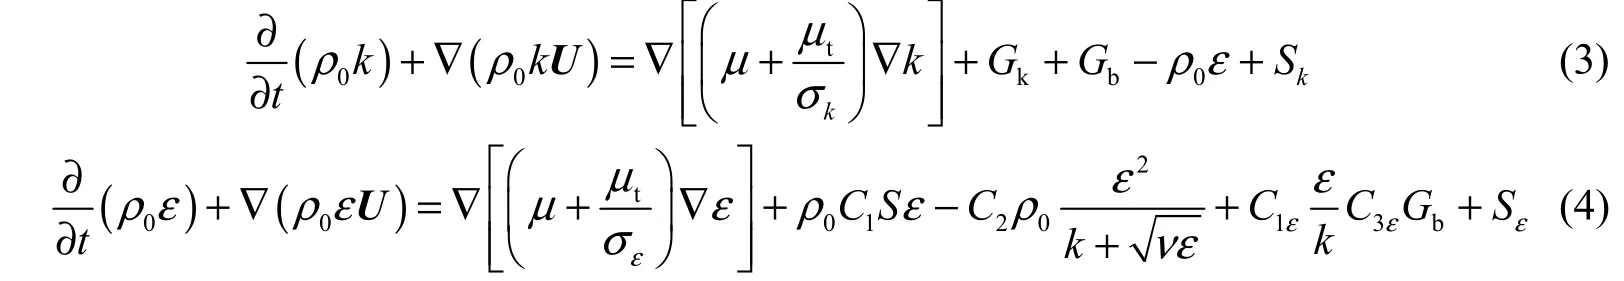
whereGkandGbare the productions of turbulent kinetic energy by the mean velocity gradient and buoyancy, respectively;νis the turbulent kinematic viscosity;
wherevanduare the velocity components parallel and perpendicular to the gravity, respectively;σk=1.0 andσε=1.2 are the turbulent Prandtl numbers forkandε, respectively; the coefficientis evaluated aswith,, andthek-εmodel constants areC=1.44 andC=1.9;1ε2andSkandSεare the source terms forkandε, respectively. The turbulent viscosity is given by
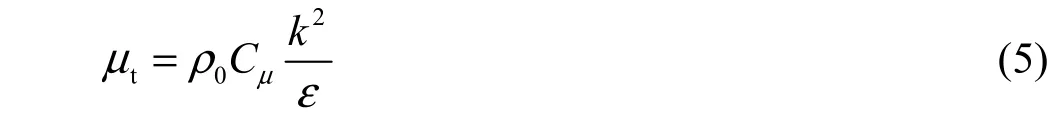
with the coefficientCμcalculated from
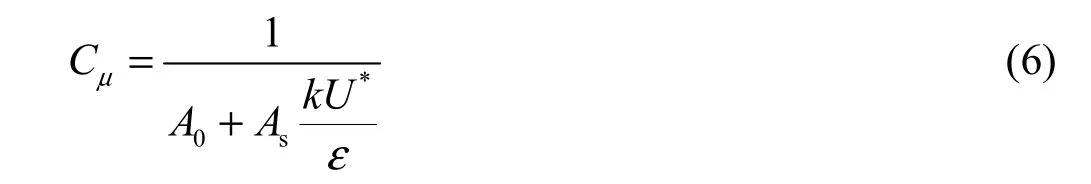
whereU*is defined as, withbeing the mean rate-of-rotation tensor.
The production of turbulent kinetic energy by the mean velocity gradient is evaluated with the Boussinesq hypothesis:

The buoyancy-induced production of bothkandεis given by
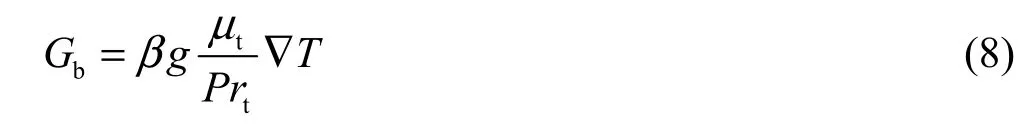
wherePrt=0.85 is the turbulent Prandtl number for energy. This term tends to suppress the turbulence if stratification is established, as in the case of this study.
3.2 Wind-induced turbulence
In a reservoir, the turbulence production due to wind can be important. Studies have shown that the vertical velocity profile near the free surface follows the law-of-the-wall, and the classical logarithmic-layer characteristic can be applied (Craig and Banner 1994). The effects of wind onkandεcan be included as source terms in Eqs. (3) and (4) following Wüest and Lorke (2003):
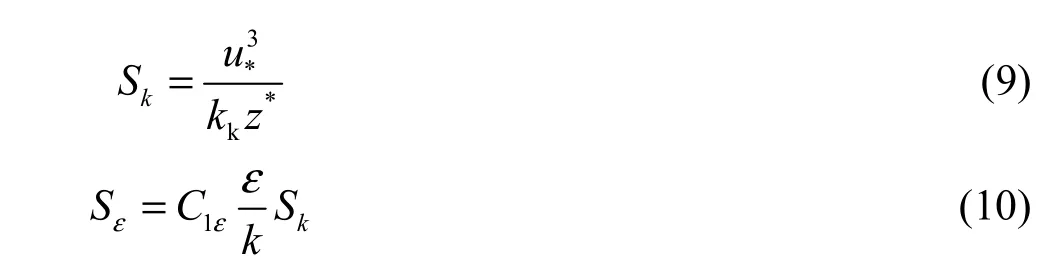
wherekkis the Von Kármán constant, andz*is the vertical distance from the free surface. The friction velocityis given as, with, whereis the air density,Dwis the wind drag coefficient, andUwis the wind speed.
3.3 Energy equation
The water temperatureTcan be calculated from the energy conservation equation:

whereCpis the specific heat; andαeffis the effective thermal conductivity, whereαeff=α+αt, withαandαtbeing the molecular and turbulent thermal conductivity, respectively. Pressure work and the energy source due to viscous dissipation and kinetic energy are neglected. Modeling the temperature dynamics in a reservoir requires the incorporation of shortwave and longwave radiations and heat convection at the free surface.Sradis the temperature source due to the solar radiation, which can be calculated following Beer’s law as

whereS0is the incident radiation, and?is the absorption coefficient or attenuationcoefficient that describes the reduction of the solar radiation intensity through water. A typical range for?in a reservoir is from 0.02 to 2 m–1(Smith and Baker 1981). Politano et al. (2006) performed a sensitivity study of this parameter and demonstrated that a value of 0.5?=m–1matched the field data. In this study, 0.5?=m–1was used.
4 Numerical simulation
4.1 Computational grid
The McNary Dam forebay was meshed with multi-block grids containing only hexahedral elements using the commercial grid generator Gridgen. The main features of the dam, including the powerhouse units, spillway bays, fish collection facilities, and a navigation lock were created with approximately 1.7 million grid points (Fig. 5). Nodes were clustered near the free surface to resolve the flow field and capture temperature distribution in the most dynamic zone. The grids at the bottom were created following the measured bathymetric data. Fig. 5(d) shows the grids for the inflow section (section A), middle section of the domain (section B), and the section near the structures (section C). The adequacy of the grids was tested by comparing results obtained with the original grid and a fine grid refined 20.5times in all directions, and the temperature profiles obtained with these grids were almost identical (Wang et al. 2013).
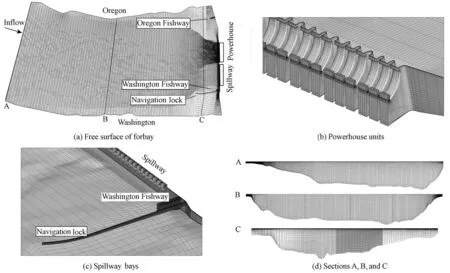
Fig. 5 Numerical grids of McNary Dam forebay and nearby dam structures
4.2 Boundary conditions
Free surface: The water surface was modeled with a rigid-lid approach, assuming a flat surface with zero shear stress. Water surface elevation was obtained from field data providedby USACE. The heat fluxqat the free surface was modeled as a linear function of the difference between water and air temperatures (Edinger et al. 1968):

whereTais the air temperature, andhis the heat transfer coefficient calculated as in Ahsan and Blumberg (1999):

whereCis the Bowen coefficient, andC=0.62mb/℃, which relates the wind effect on sensible heat flux to that on latent heat flux. In this study an average measured wind speed of 1.74 m/s was used. The measured air temperatureTawas fitted as
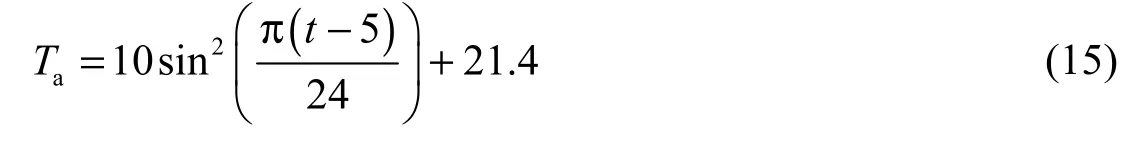
wheretis the time in hours. Fig. 4 shows the function used to adjust the air temperature on August 18, 2004. The heat flux at the free surface, given by Eqs. (13) through (15), was implemented in OpenFOAM using the library groovyBC developed for mixed boundary conditions.
Walls and forebay bed: A non-slip condition and zero heat flux were used for all walls, river banks, and the river bed. The standard wall functions were used.
Outflows: The powerhouse, spillway, and fishways were modeled as outlets with specified outflow discharges. Zero temperature gradients were imposed on the outflows.
Inflow: A given total river flow and measured temperature were specified at the upstream inflow section. The velocity was assumed to be uniformly distributed. The turbulent variables were assumed to be zero at the upstream end.
4.3 Numerical method
The mathematical model described in section 3 was implemented in the control-volume open-source code OpenFOAM. OpenFOAM uses a co-located methodology. The PIMPLE algorithm, which is a mixture of the PISO (pressure implicit with splitting of operators) and SIMPLE (semi-implicit method for pressure-linked equations) algorithms, was used to couple pressure and velocity. The Euler blended Crank-Nicholson method was used to discretize the temporal term. This is a first-order, bounded implicit method. The convective terms were discretized using Gauss upwind, which refers to the standard finite volume discretization of Gaussian integration. The Lapacian terms used Gauss linear corrected interpolation to calculate values from cell centers to face centers. Due to the transient nature of the problem, an adaptive time-stepping technique based on the Courant number was employed. A maximum Courant number of 0.5 was adopted in this study. Numerical tests using Courant numbers of 1 and 1.5 were also performed by Wang et al. (2013). Temperature profiles for these Courant numbers were almost identical. However, the model has been proved to be more unstable as the Courant number increases.
5 Numerical results
The unsteady atmospheric conditions observed on August 18, 2004 were applied repeatedly over many diurnal cycles, and the model was run from a constant initial uniform temperature of 22℃ until a periodic solution was obtained. The daily flow pattern and temperature dynamics in the McNary Dam forebay on August 18, 2004 were then analyzed. The flow field in the forebay was unsteady and highly three-dimensional due to the influence of the dam structures, reservoir bathymetry, and dynamic atmospheric conditions. The flow was coupled with energy, and therefore changes in temperature resulted in an unsteady velocity distribution. The predicted velocity vectors in a horizontal slice 1 m beneath the free surface and near the river bed (20 m below the water surface) at 6:00 am, 12:00 am, 6:00 pm, and 12:00 pm are shown in Figs. 6 and 7, respectively. Since the spillway was not operating on the simulation day, a high velocity zone near the powerhouse region was observed. The influence zone of powerhouse intakes was noticed as far as 1 km upstream of the structures. The predicted vertical velocity profile was not uniformly distributed. Near the free surface, the flow curved toward the powerhouse and away from the Washington shore. On the other hand, the flow near the bottom tended to follow the bathymetry. Eddies with low velocity were created near the navigation lock due to both the structure and relatively shallow water close to the bank. This phenomenon decreases the temperature mixing of this region with the main channel and increases the residence time in this region.
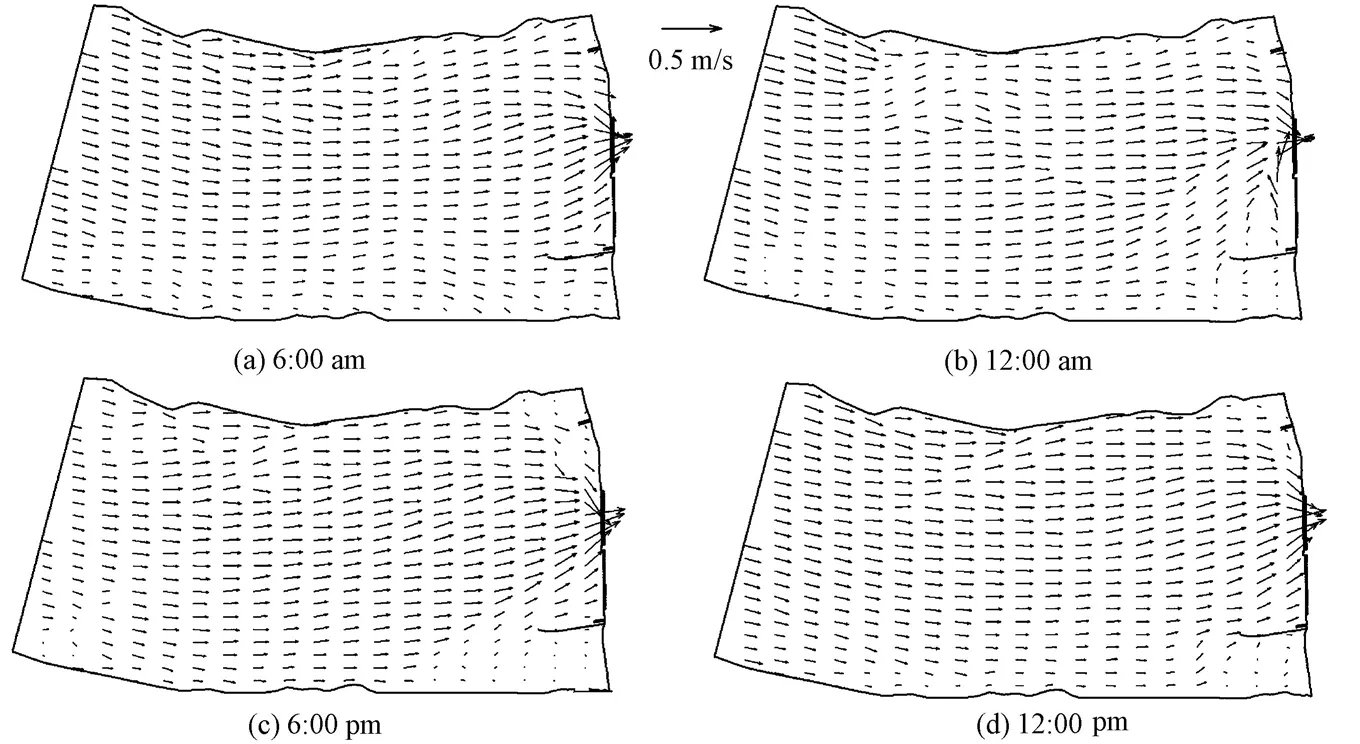
Fig. 6 Velocity distributions 1 m beneath free surface
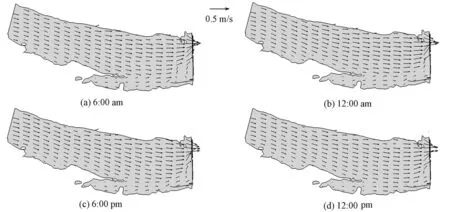
Fig. 7 Velocity distributions near river bed
The spatial and temporal temperature cycles were a consequence of both convective heat transfer from the river upstream and periodic heating/cooling of the atmosphere (Fig. 4). Positive heat flux during the day warmed the water body. Longwave radiation along with a lower air temperature cooled the surface layer after sunset. Fig. 8 shows the predicted temperatures near the water surface at different times. The lowest and highest predicted temperatures were obtained at around 7:00 am and 5:00 pm, respectively. As a result of the nonuniform vertical velocity field (Figs. 6 and 7), warm surface water was transported towards the Oregon side, while cool water at the bottom accumulated near the Washington shore. An overall higher temperature was predicted near the Oregon side of the reservoir, which is consistent with field observations. The predicted temperature around the navigation lock was about 1 to 2℃ lower than the temperature of water through the powerhouse. This low temperature zone is of great benefit to the Washington Fishway. Shallow water along with strong mixing predicted by the model raises the temperature near the Oregon Fishway.
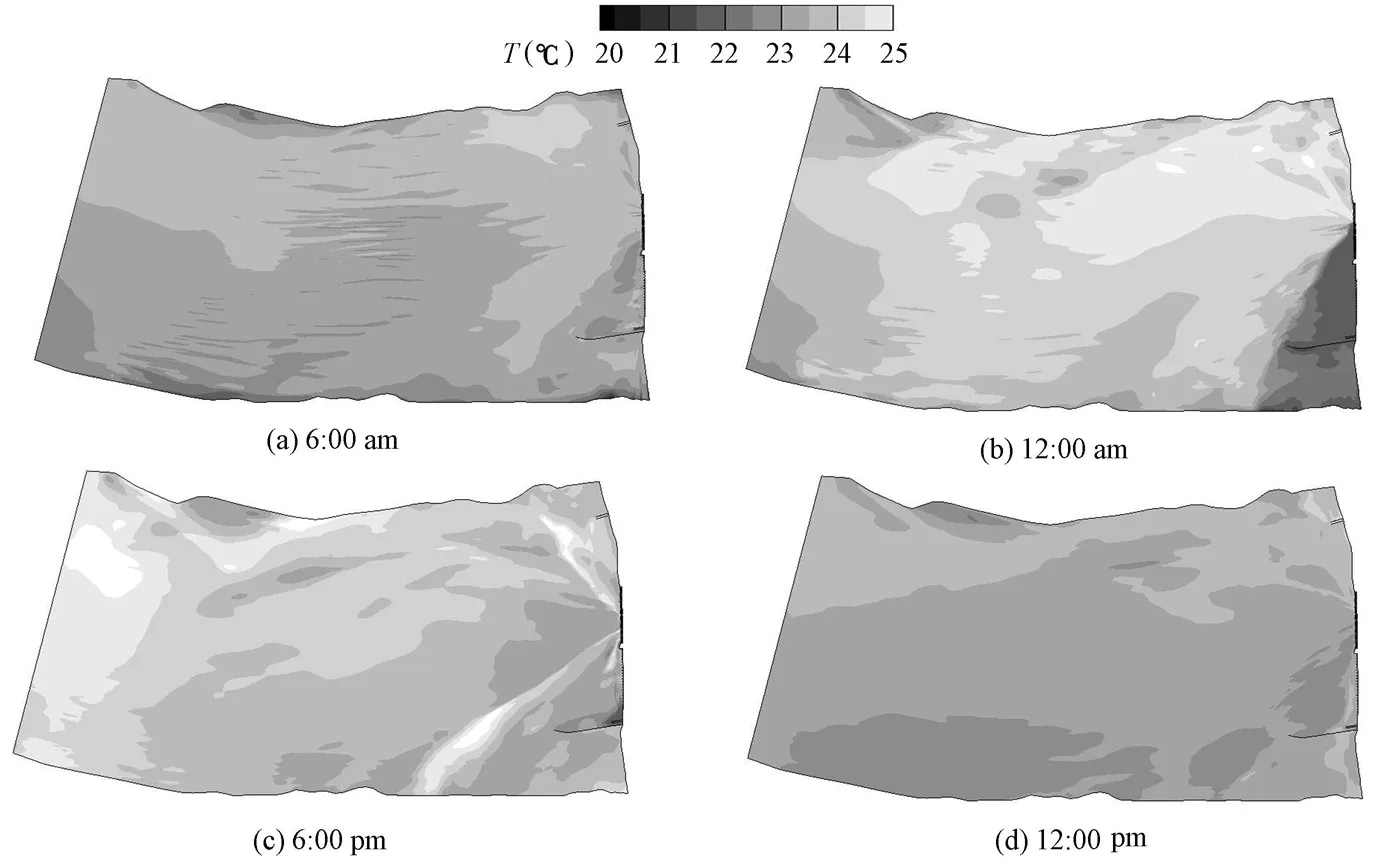
Fig. 8 Temperature contours 1 m beneath free surface
Fig. 9 shows the predicted flow field and temperature distribution through unit 7 of the powerhouse at 6:00 am, 12:00 am, 6:00 pm, and 12:00 pm. A daily thermocline cycle was predicted by the model. The almost uniform vertical velocity in the McNary Dam forebay gradually accelerated at the powerhouse intake. Turbine units draw some warm water from the free surface, increasing the temperature in the units with the potential of imposing additionalstress to fish traveling towards the gate wells. After sunrise, warm superficial water heated by shortwave radiation and air convection was entrained into the powerhouse units.
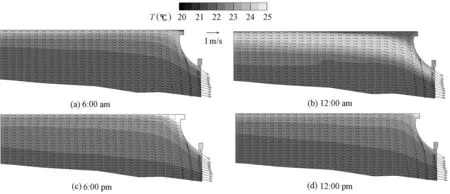
Fig. 9 Vertical profiles of flow field and temperature distribution through powerhouse unit 7
Temperature dynamics in the simulation domain were compared with the field measurements from four stations, P1, P2, P3, and P4 (Fig. 2), to demonstrate the capability of the model to represent the temperature dynamics in the forebay. These stations were located in the main stream, where the temperature distribution was strongly affected by flow convection. The model was validated by determining the degree to which predictions provided an accurate representation of the forebay dynamics from the perspective of the intended use of the model. It is important to note that the validity of a model is confined within the area of study and restrained by inputs and parameters used. This fact limits the use of the model to this dam, and therefore its application to any other dam would require validation again.
Figs. 10 and 11 show the vertical temperature profiles at 6-hour intervals predicted by the model for stations P1, P2, P3, and P4, along with the field data and simulation results presented by Politano et al. (2008). Good agreement between predicted and measured data was obtained with both models. Differences between numerical and field data were within 0.5℃in the hypolimnion. Below 15 m from the water surface, an undisturbed profile was predicted for all stations. This region presents the typical characteristics of the hypolimnion.
The water temperature in the top layer, known as epilimnion, was more sensitive to the meteorological conditions. Higher temperatures were predicted by the model in the superficial layer of the McNary Reservoir than the measured data. A strong temperature gradient in the first 5 m beneath the free surface was predicted by both models. The general trends and daily temperature fluctuation were reproduced by the models. However, the temperature gradient was overestimated in this layer relative to the field measurements. With incorporation of the wind-induced turbulent diffusion and cloud albedo, thermal energy was more uniformly distributed, and physical processes were better represented by the model presented in this paper. Differences between numerical and field data were less than 1℃ in the epilimnion for all the four stations. In most cases, the predicted temperature profiles near the free surface withthe present model are closer to the measured data than those obtained by Politano et al. (2008). However, the errors in the measurements near the free surface can be large due to difficulties in data acquisition under a strong vertical temperature gradient. In the transition zone between epilimnion and hypolimnion, the temperature gradient becomes less important. Results from both models fit well with the field data, and the overall agreement is satisfactory at all stations.
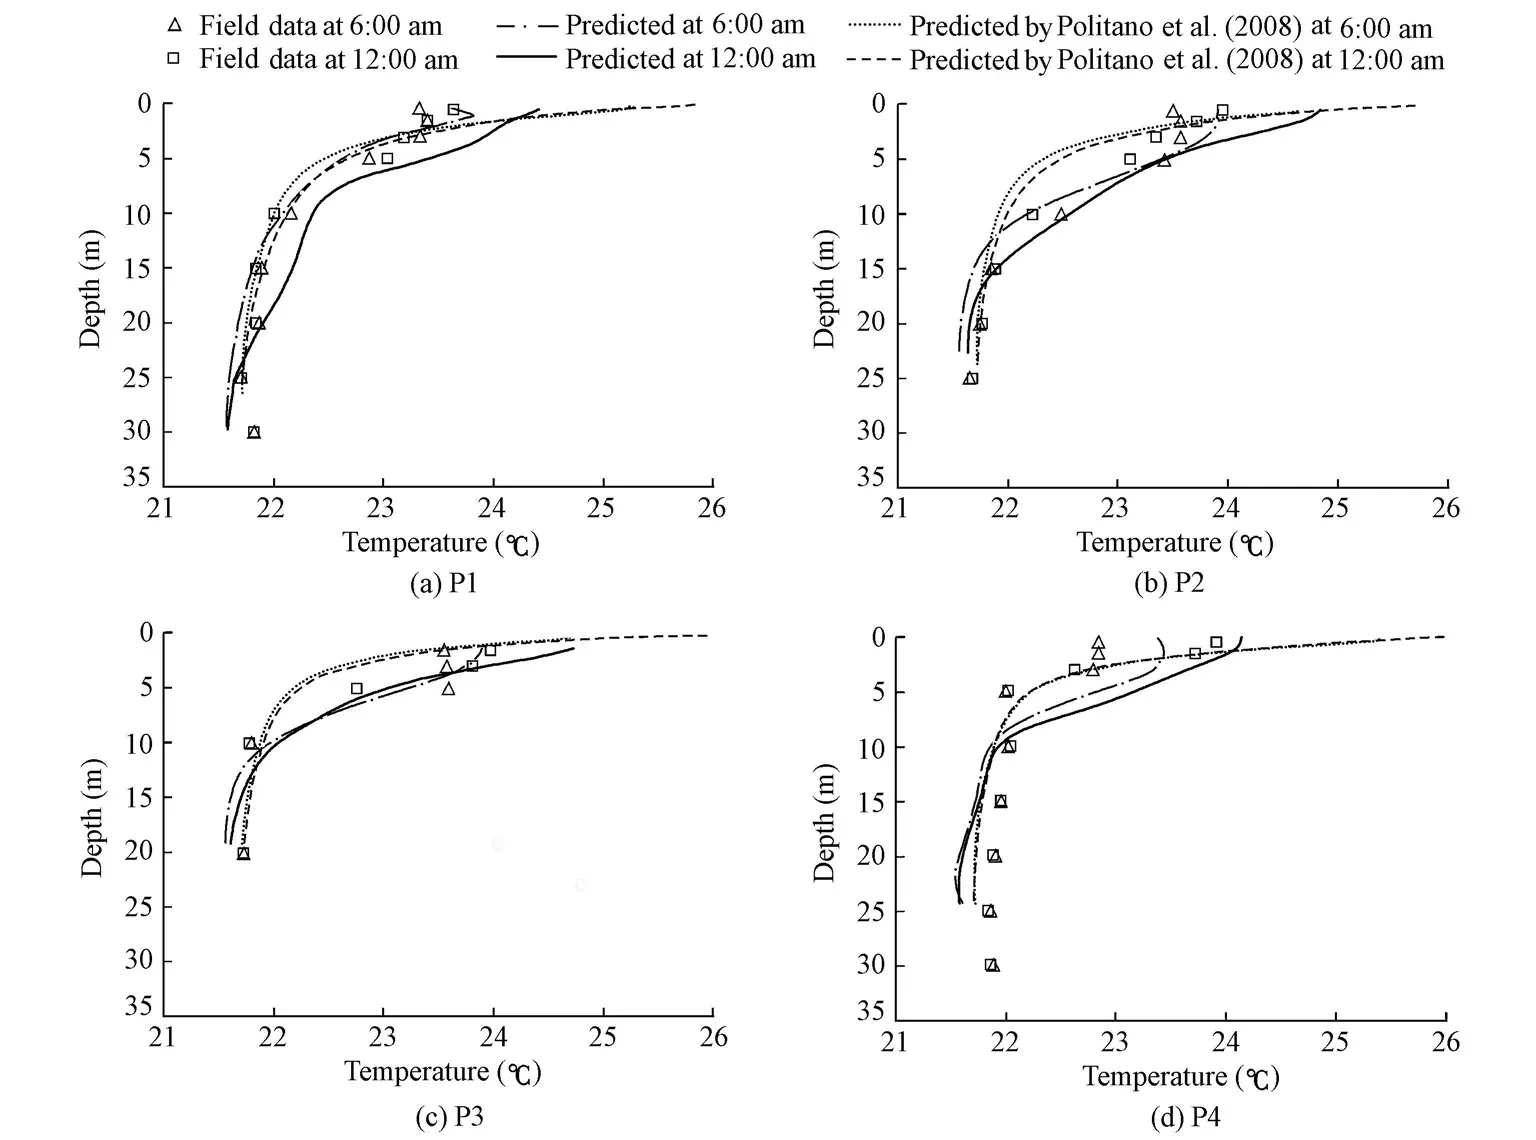
Fig. 10 Temperature profiles at 6:00 am and 12:00 am for stations P1, P2, P3, and P4
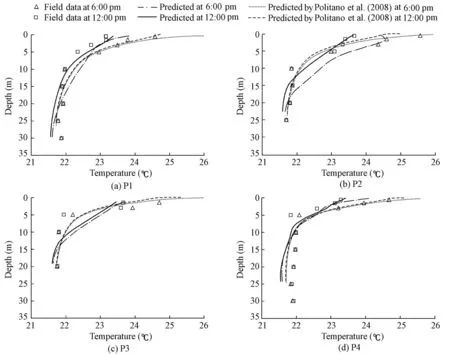
Fig. 11 Temperature profiles at 6:00 pm and 12:00 pm for stations P1, P2, P3, and P4
6 Conclusions
An unsteady three-dimensional numerical model was developed to study the hydrodynamics and temperature dynamics in the McNary Dam forebay. The model is based on the open-source code OpenFOAM, and solves the incompressible RANS equations with the Boussinesq approximation. The turbulence was modeled with a realizable -kεmodel with wall functions. Solar radiation and convective heat transfer at the free surface were incorporated into the model. Wind-induced turbulence was modeled by assuming a logarithmic boundary layer beneath the free surface. Simulation results were compared with field data and numerical results from a previous numerical study for a typical summer day. The main conclusions are as follows:
(1) The model captures the observed spatial and temporal temperature fluctuation.
(2) The flow pattern in the forebay is highly three-dimensional and coupled with temperature.
(3) The incorporation of wind-induced turbulence improves the temperature predictions in the epilimnion.
(4) The presented computational fluid dynamics model can be used to evaluate potential dam operational conditions or structural modifications.
Ahsan, A. Q., and Blumberg, A. F. 1999. Three-dimensional hydrothermal model of Onondaga Lake, New York.Journal of Hydraulic Engineering, 125(9), 912-923. [doi:10.1061/(ASCE)0733-9429(1999)125:9 (912)]
Bednarz, T. P., Lei, C. W., and Patterson, J. C. 2008. An experimental study of unsteady natural convection in a reservoir model cooled from the water surface.Experimental Thermal and Fluid Science, 32(3), 844-856. [doi:10.1016/j.expthermflusci.2007.10.007]
Bednarz, T. P., Lei, C. W., and Patterson, J. C. 2009. Unsteady natural convection induced by diurnal temperature changes in a reservoir with slowly varying bottom topography.International Journal of Thermal Sciences, 48(10), 1932-1942. [doi:10.1016/j.ijthermalsci.2009.02.011]
Craig, P. B., and Banner, M. L. 1994. Modelling wave-enhanced turbulence in the ocean surface layer.Journal of Physical Oceanography, 24(12), 2546-2559. [doi:10.1175/1520-0485(1994)024<2546:MWETIT>2.0.CO;2]
Edinger, J. E., Duttweiler, D. W., and Geyer, J. C. 1968. The response of water temperatures to meteorological conditions.Water Resources Research, 4(5), 1137-1143. [doi:10.1029/WR004i005p01137]
Fan, S. F., Feng, M. Q., and Liu, Z. 2009. Simulation of water temperature distribution in Fenhe Reservoir.Water Science and Engineering, 2(2), 32-42. [doi:10.3882/j.issn.1674-2370.2009.02.004]
Ford, D. E., and Stefan, H. 1980. Stratification variability in three morphometrically different lakes under identical meteorological forcing.Journal of American Water Resources Association, 16(2), 243-247.[doi:10.1111/j.1752-1688.1980.tb02385.x]
Gooseff, M. N., Strzepek, K., and Chapra, S. C. 2005. Modeling the potential effects of climate change on water temperature downstream of a shallow reservoir, Lower Madison River, MT.Climate Change, 68(3), 331-353. [doi:10.1007/s10584-005-9076-0]
Hondzo, M., and Stefan, H. G. 1993. Lake water temperature simulation model.Journal of Hydraulic Engineering, 119(11), 1251-1273. [doi:10.1061/(ASCE)0733-9429(1993)119:11(1251)]
Kirillin, G. 2010. Modeling the impact of global warming on water temperature and seasonal mixing regimes in small temperate lakes.Boreal Environment Research, 15(2), 279-293.
Lei, C. W., and Patterson, J. C. 2002. Natural convection in a reservoir sidearm subject to solar radiation: A two-dimensional simulation.Numerical Heat Transfer, 42(1-2), 13-32. [doi:10.1080/ 10407780290059404]
Liu, W. C., and Chen, W. B. 2012. Prediction of water temperature in a subtropical subalpine lake using an artificial neural network and three-dimensional circulation models.Computers and Geosciences, 45, 13-25. [doi:10.1016/j.cageo.2012.03.010]
Politano, M., Haque, M. D. M., Constantinescu, S. G., and Weber, L. 2006. A three-dimensional thermal model for McNary Dam.World Environmental and Water Resource Congress 2006. ASCE. [doi:10.1061/ 40856(200)77]
Politano, M., Haque, M. D. M., and Weber, L. J. 2008. A numerical study of the temperature dynamics at McNary Dam.Ecological Modelling, 212(3-4), 408-421. [doi:10.1016/j.ecolmodel.2007.10.040]
Shih, T. H., Liou, W. W., Shabbir, A., Yang, Z., and Zhu, J. 1995. A new eddy-viscosity model for high Reynolds number turbulent flows.Computers and Fluids, 24(3), 227-238. [doi:10.1016/0045-7930(94) 00032-T]
Smith, R. C., and Baker, K. S. 1981. Optical properties of the clearest natural waters.Applied Optics, 20(2), 177-184. [doi:10.1364/AO.20.000177]
Stefan, H., and Ford, D. E. 1975. Temperature dynamics in dimictic lakes.Journal of Hydraulics Division, 101(1), 97-114.
Stefan, H. G., Hanson, M. J., Ford, D. E., and Dhamotharan, S. 1980. Stratification and water quality prediction in shallow lakes and reservoirs.Proceedings of Second International Symposium on Stratified Flows, 1033-1043. Trondheim: International Association for Hydraulic Research.
Wang, Y., Politano, M., and Laughery, R. 2013. Simulation of the temperature dynamics in McNary Dam using OpenFOAM.Proceedings of HydroVision International Conference. Denver: HydroVision International.
Wüest, A., and Lorke, A. 2003. Small-scale hydrodynamics in lakes.Annual Review of Fluid Mechanics, 35, 373-412. [doi:10.1146/annurev.fluid.35.101101.161220]
Zhang, Y. L., and Baptista, A. M. 2008. SELFE: A semi-implicit Eulerian-Lagrangian finite-element model for cross-scale ocean circulation.Ocean Modelling, 21(3-4), 71-96. [doi:10.1016/j.ocemod.2007.11.005]
(Edited by Ye SHI)
This work was supported by Hydro Research Foundation (Grant No. DE-EE0002668).
*Corresponding author (e-mail:marcela-politano@uiowa.edu)
Jan. 10, 2013; accepted May 9, 2013
 Water Science and Engineering2013年3期
- Water Science and Engineering的其它文章
- Impact of consolidation pressure on contaminant migration in clay liner
- Application of modified k-ω model to predicting cavitating flow in centrifugal pump
- Variability in salt flux and water circulation in Ota River Estuary, Japan
- Synthesis and characterization of carboxymethyl cellulose/organic montmorillonite nanocomposites and its adsorption behavior for Congo Red dye
- Effectiveness of inhibitors in increasing chloride threshold value for steel corrosion
- Optimized operation of cascade reservoirs on Wujiang River during 2009-2010 drought in southwest China