
A Novel Systematic Method of Quality Monitoring and Prediction Based on FDA and Kernel Regression*
2009-05-14 03:04:44ZHANGXi張曦MASile馬思樂YANWeiwu閻威武ZHAOXu趙旭andSHAOHuihe邵惠鶴
關(guān)鍵詞:威武
ZHANG Xi (張曦), MA Sile (馬思樂), YAN Weiwu (閻威武), ZHAO Xu (趙旭) and SHAO Huihe (邵惠鶴)
?
A Novel Systematic Method of Quality Monitoring and Prediction Based on FDA and Kernel Regression*
ZHANG Xi (張曦)1,2, MA Sile (馬思樂)3,**, YAN Weiwu (閻威武)2, ZHAO Xu (趙旭)2and SHAO Huihe (邵惠鶴)2
1Guangdong Electric Power Research Institute, Guangzhou 510600, China2Department of Automation, Shanghai Jiao Tong University, Shanghai 200240, China3School of Control Science and Engineering, Shandong University, Jinan 250061, China
A novel systematic quality monitoring and prediction method based on Fisher discriminant analysis (FDA) and kernel regression is proposed. The FDA method is first used for quality monitoring. If the process is under normal condition, then kernel regression is further used for quality prediction and estimation. If faults have occurred, the contribution plot in the fault feature direction is used for fault diagnosis. The proposed method can effectively detect the fault and has better ability to predict the response variables than principle component regression (PCR) and partial least squares (PLS). Application results to the industrial fluid catalytic cracking unit (FCCU) show the effectiveness of the proposed method.
quality monitoring, quality prediction, Fisher discriminant analysis, kernel regression, fluid catalytic cracking unit
1 Introduction
It is difficult to measure online some important variables in chemical or biological process due to the limitation of the techniques. These variables are normally determined by offline analyses and calculation or online quality analyzer. Mostly, analysis and online analyzer suffer from long measurement delays or high investment and maintenance. Online estimation (soft sensing) techniques, which are developed recently, are now widely used. It predicts the product quality using the online measurable variables, which are correlated to the primary variable.
Early work on online estimation assumed that a process model was available. Joseph and Brosilow [1]reported an inferential model developed using a Kalmanfilter [2]. In case the process mechanisms were not well understood, empirical models, such as neural network [3, 4], and multivariate statistical methods, such as principal component analysis (PCA) and partial least squares (PLS), were used to derive a regression model [2, 5-7]. In particular, PLS and its variations have been used to solve many practical regression problems in chemical engineering [6, 8]. Other methods include regression based on model [9] and hybrid methods also have been developed [10, 11]. Clustering has also been used for estimating a variable for which there is no online measurement in a distillation column [12].
However, online process measurements are often contaminated with data points that deviate significantly from the true values due to instrument failure or changes in operating conditions. So, gross error detection is important in quality estimation. Several statistical methods have been presented, such as Global Test (GT) [13], the Nodal Test (NT) [13, 14], the Measurement Test (MT) [15], and the Generalized Likelihood Ratio (GLR) test to detect gross errors. The above-mentioned methods for errors detection must know the mathematical model of process and make necessary statistical assumption. For complex industrial processes, it is difficult to achieve an accurate mathematical model. These limit application of methods based on statistical test. Fisher discriminant analysis (FDA)-related methods are dimensional reduction techniques that have been widely used in the field of pattern classification [16]. They also have been introduced for fault detection and process monitoring in chemical industry [17-22]. Gross error is equal to faultsin systems. So, FDA is introduced for gross error detection in quality estimation and has a good performance.
In this article, a systematic method of quality monitoring and prediction based on FDA and kernel regression has been proposed. FDA is first used for fault detection. If the process runs under normal condition, kernel regression method is then performed for quality prediction. Otherwise, the contribution plot of weights in fault feature direction is further used for fault diagnosis. Application results of the industrial fluid catalytic cracking unit (FCCU) show that the integrated method can effectively detect the happening faults and perform quality prediction and estimation.
2 Preliminary principles of FDA and kernel regression
2.1 Fisher discriminant analysis
Fisher discriminant analysis (FDA) is a linear dimensional reduction technique widely used in the field of pattern classification [16]. Chiang. [20] used it first to diagnose faults in chemical process. The aim of FDA is to find the optimal Fisher discriminant vector such that the Fisher criterion function is maximized. The data in high-dimensional feature space then can be projected onto the obtained optimal discriminant vectors for constructing a lower-dimensional feature space [21]. The different class data can be separated mostly in the lower-dimensional Fisher space.
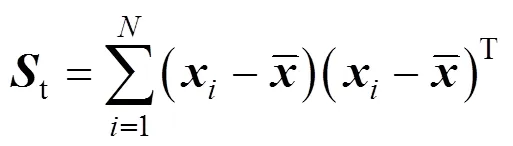
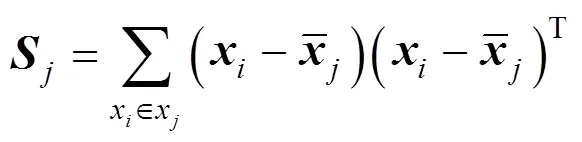
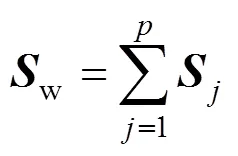
The between-class-scatter matrix is defined as
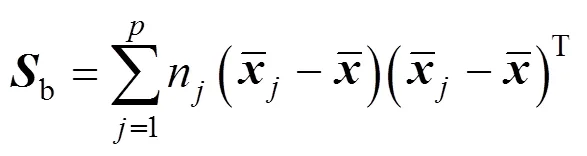
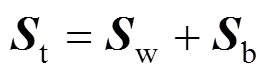
wherenis the number of observations in class. It can be concluded that the total-scatter matrix is equal to the sum of the between-class-scatter matrix and within-class-scatter matrix,
The optimal discriminant vector can be found by maximizing the Fisher criterion function as follows:
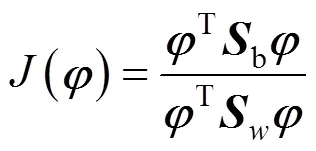
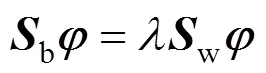
wherebandware the between-class scatter matrix and within-class scatter matrix. It is equipollent to solve the generalized feature equation as follows:
2.2 Kernel principle component analysis
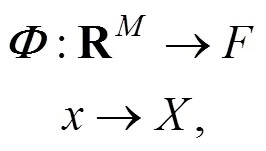
Kernel principle component analysis (KPCA) is a nonlinear extension of PCA in kernel feature subspace. Consider a nonlinear mapping [23]:
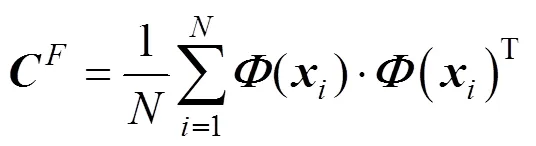

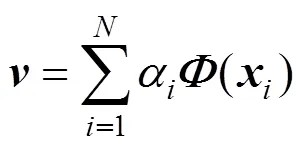
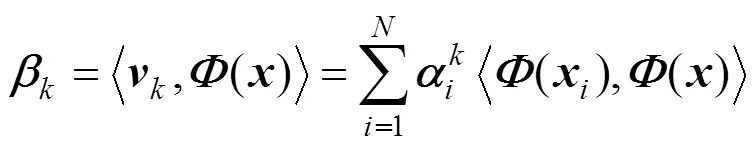
then the PC vectors can be denoted as follows.
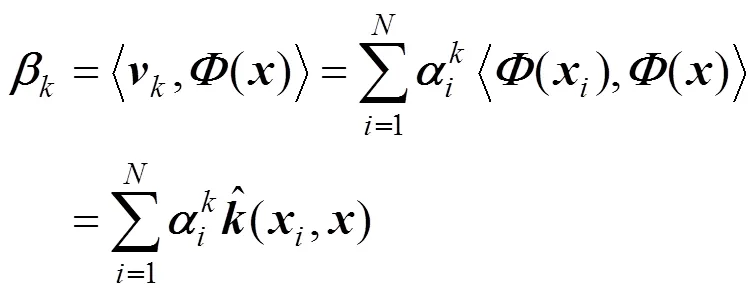
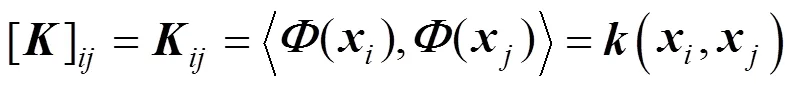
where
2.3 Kernel principle component regression
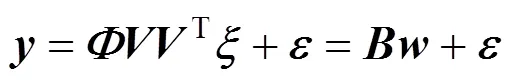
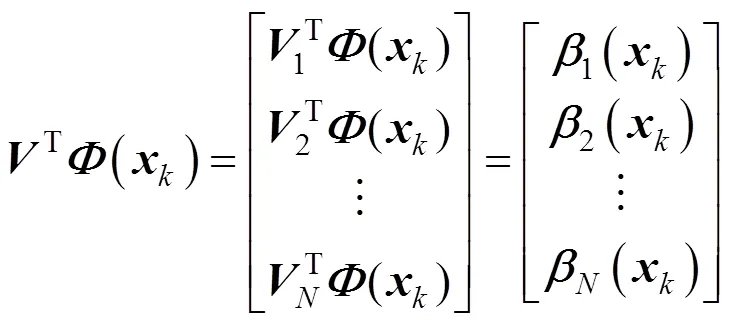
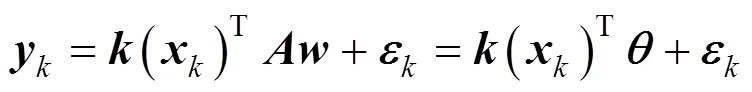
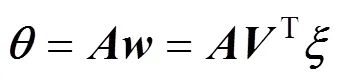
Consider the standard regression model in the feature space,

then,

Whereis an diagonal matrix of {1,2,···,λ},is an orthogonal matrix. So the linear regression model can be expressed further as,
where
is the new regressor in terms of kernel principal component and it satisfies that

So the least square estimator of coefficientcan be expressed as
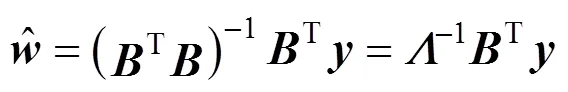
From the above estimator expression, we can see that it is difficult to finddirectly. Below we show how to findusing the kernel function.
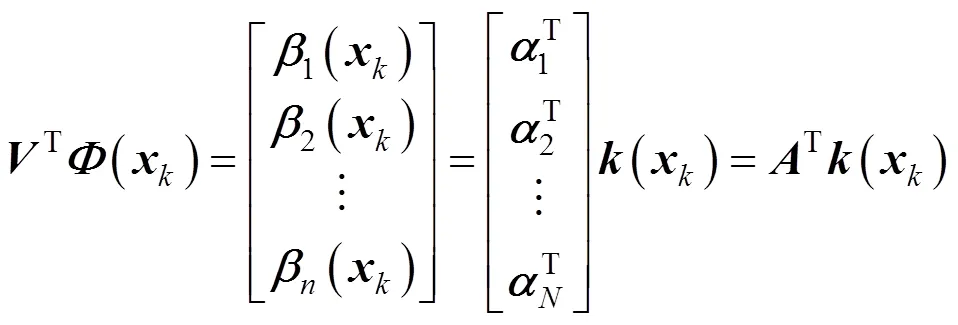
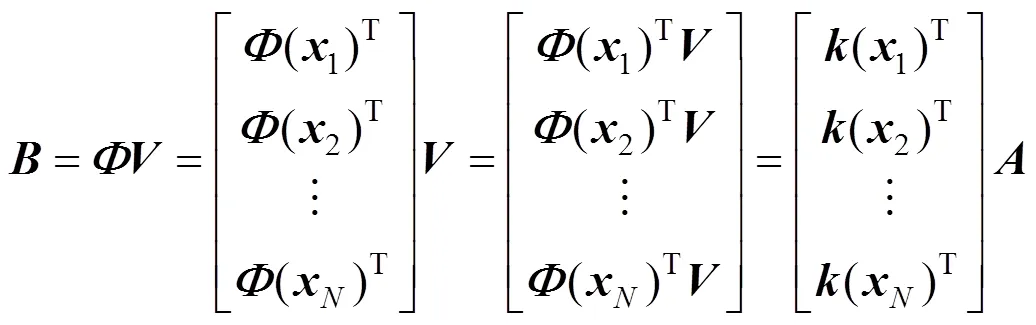
Denotethe-th component ofandthe-th component of; from the linear regression model, we obtain
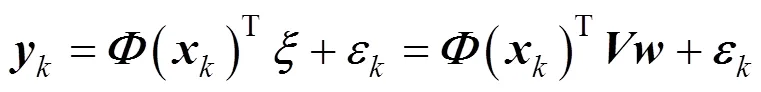
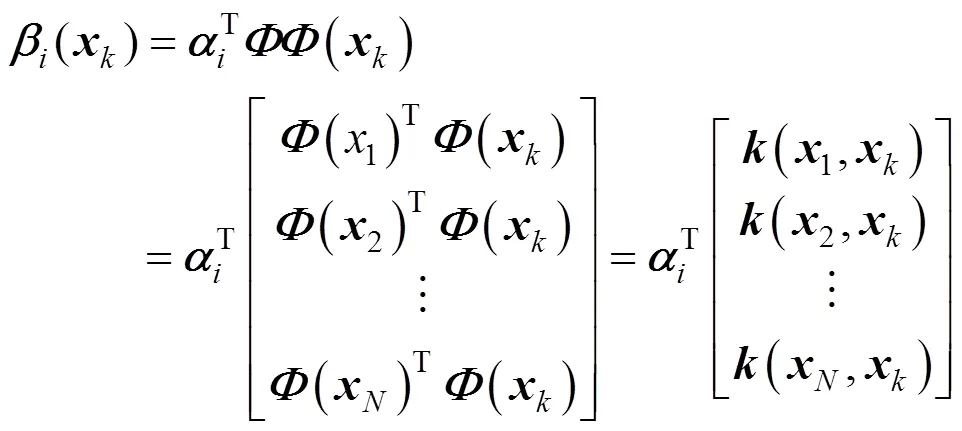
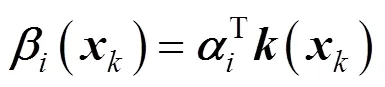
So,
where
From above, we know that
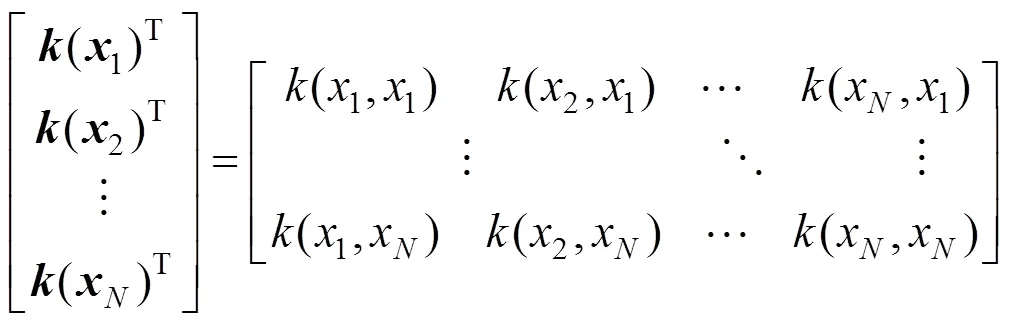
where
From the definition of matrix,
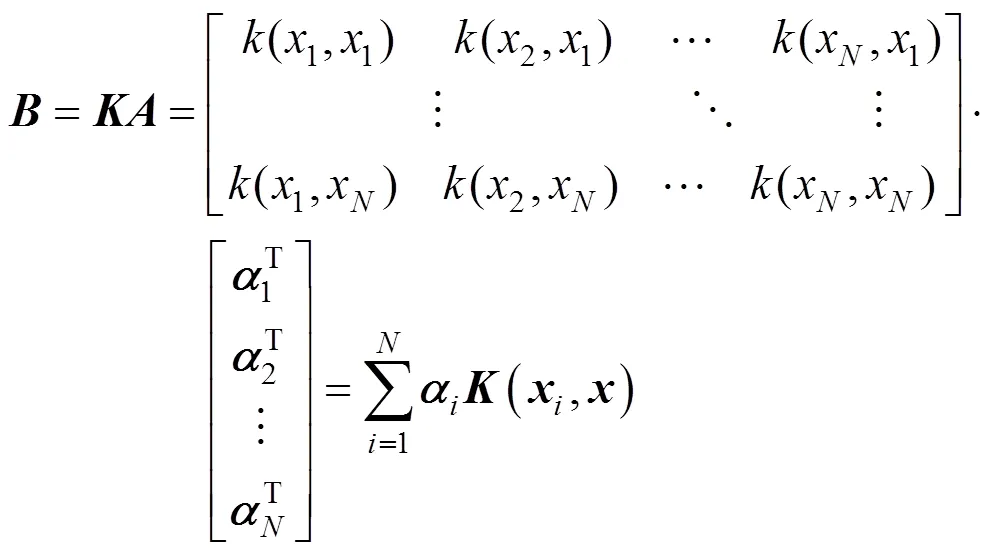
We can see that
So

3 Quality monitoring and prediction based on FDA and kernel regression
3.1 The relationship among FDA, KPCA, and KPCR in quality monitoring and estimation
Kernel principle component regression (KPCR) is the extension of KPCA. KPCA is used for feature selection. Then the extracted features can be used as preprocessing step for least square regression in the feature space. The framework of quality monitoring and estimation is shown in Fig. 1.
It can be seen from the figure that data are first normalized using the mean and standard deviation of each variable. Then FDA is performed for gross error and fault detection. If the system runs under normal condition, KPCR is further used for quality estimation and prediction. Otherwise, contribution plot of weights in fault feature direction is used for fault diagnosis.
FDA-related methods have been used for pattern matching and process monitoring. But it is introduced for the first time for gross error detection in quality estimation.
3.2 The construction of detecting index and control limit
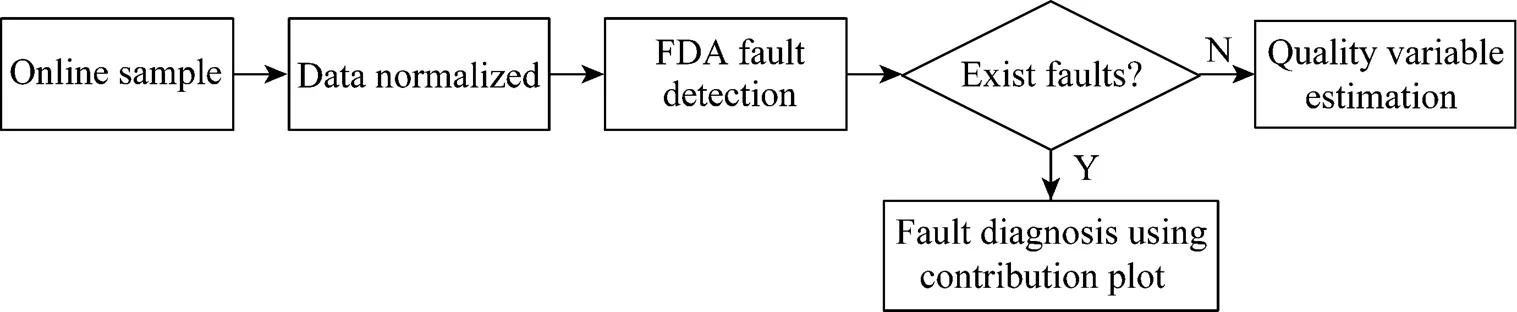
Figure 1 Flow chart of quality monitoring and estimation
For online quality monitoring, the distance of projection vectors in low-dimensional Fisher space,newcompares with the control limit*to determine whether a fault has occurred. The distance between feature vectors is defined as:
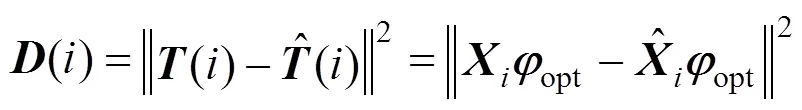

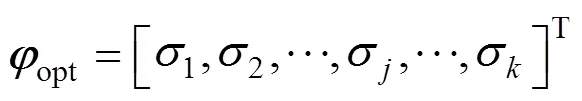
A Quality monitoring based on FDA

(3) Determine the control limit*from the normal data. The control limit is set to allow 99% of the total distances under the threshold.

(6) Compare the distancenewwith the control limit*. Ifnewis less than the predefined threshold*, the current process feature is considered to represent the normal operating condition. Then use procedures B and C to perform quality prediction and estimation; if the fault has occurred, use step (7) for fault diagnosis.
B Develop normal quality prediction and estimation model
(1) Acquire the training data and normalize it using mean and standard deviation of each variable.
where
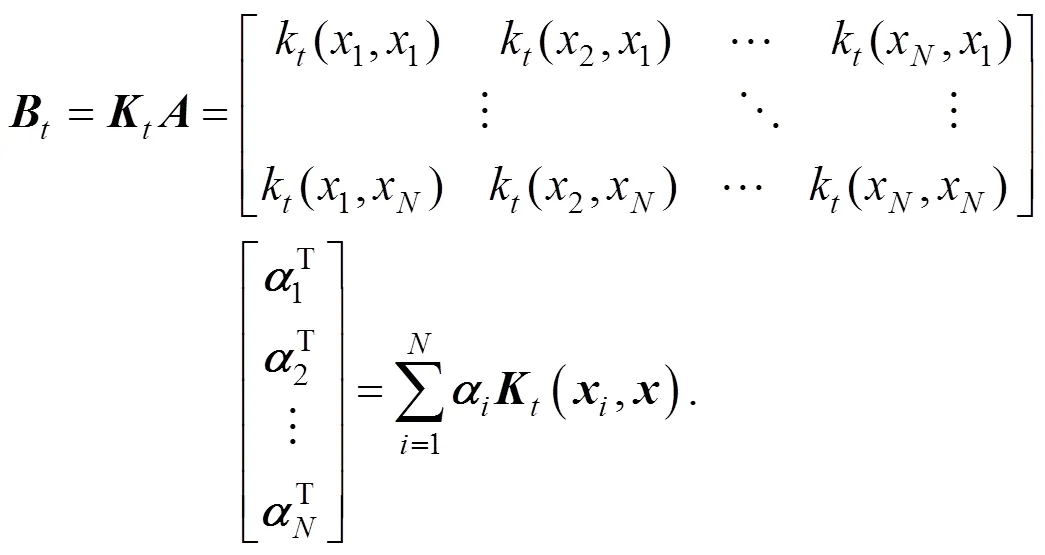
(4) Calculate the transformed regressor matrixas follows:

(6) Calculate the predictions of training data as follows:
C Online estimation and prediction procedure
(1) Obtain new data and scale it with the mean and variance of each variable.
(3) Mean centering of the test kernel matrix is as follows
(4) Calculate the transformed regressor matrixas follows:

4 Application studies and discussion
4.1 Application results of the FCCU process
Fluid catalytic cracking unit (FCCU) is the core unit of the oil secondary operation. Its operation conditions strongly affect the yield of light oil in petroleum refining. In general, FCCU consists of reactor- regenerator subsystem, fractionator subsystem, absorber-stabilizer subsystem and gas sweetening subsystem. The main aim of fractionator subsystem is to split reaction-cracked oil-gas according to a fractional distillation process. Prime products of fractionator subsystem include crude gasoline, light diesel oil, and slurry [7]. To control the product quality, the yield rate of gasoline is calculated offline every 8 hours. Significant delay (often several hours) will incur such that the measured values cannot be used as feedback signals for quality control systems. So it is necessary to estimate it online. However, when using online estimation, the results are often contaminated with data points that deviate significantly from the true values due to instrument failure or changes in operating conditions. So, it is essential to perform quality monitoring and avoiding wrong operations.
The proposed method is applied to the quality monitoring and prediction of the yield rate of gasoline. The training and testing samples are collected from data of the distributed control system (DCS) and the corresponding daily laboratory analysis of Shijiazhuang Oil Refinery Factory, China. The input variables for quality monitoring and prediction are selected according to the principle that the variables which affected response variable most are selected first. Based on analysis to the process, it is found that the main variables which contribute to the yield rate of gasoline are flow rate of fresh oil, flow rate of reflux oil, temperature of catalytic reaction, overhead temperature of the main fractionating tower, the extraction temperature of light diesel oil, and bottom temperature of stabilizer column. Hence, these six variables are used as inputs for quality monitoring and prediction. Yield rate is used as the output of estimation model.
We first collect two data sets and each includes 100 normal samples. They are used as training and testing data. The monitoring result using FDA is given in Fig. 2. We can see that no samples exceed the control limit when the system is normal. The monitoring results using PCA is shown in Fig. 3, it can be seen from the figure that there are a few samples exceed the 99% limit although the process is normal. The monitoring performance of FDA is better than PCA.
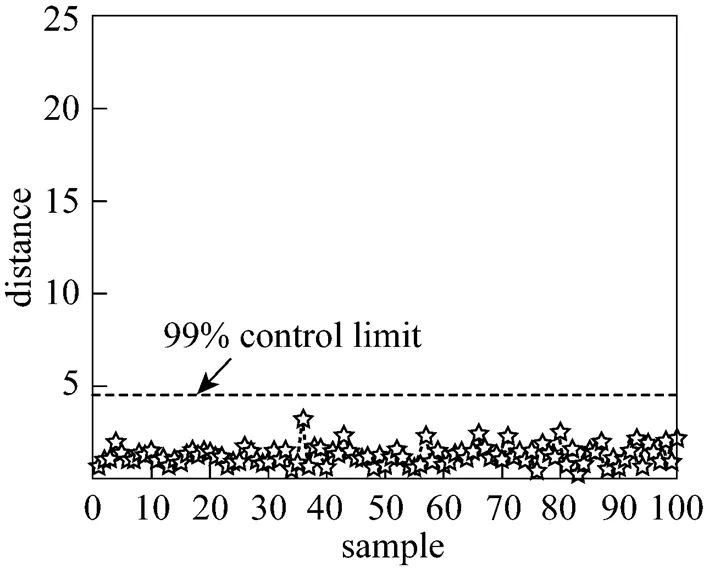
Figure 2 Quality monitoring plot of normal data using FDA
Figure 3 Quality monitoring plot of normal data using PCA
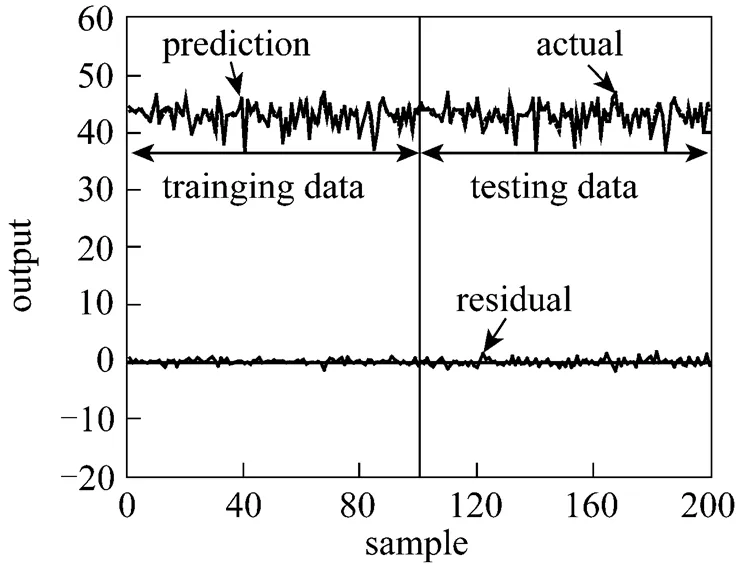
Figure 4 Estimation results by KPCR (Normal data)

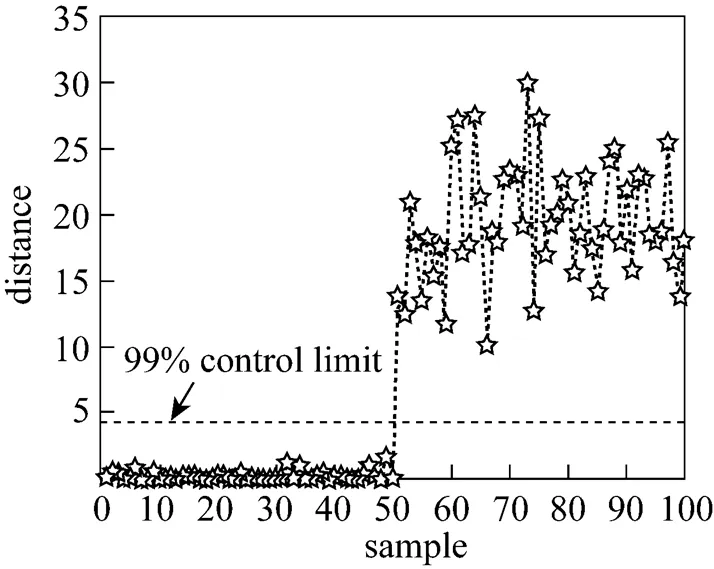
Figure 6 Quality monitoring plot of fault data using FDA
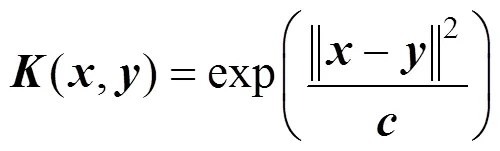
When the process is under normal condition, quality estimation can be further performed and appropriate kernel must be first chosen. The radial basis function (RBF) kernel is used as the selected kernel function andis 5.0 in this case.
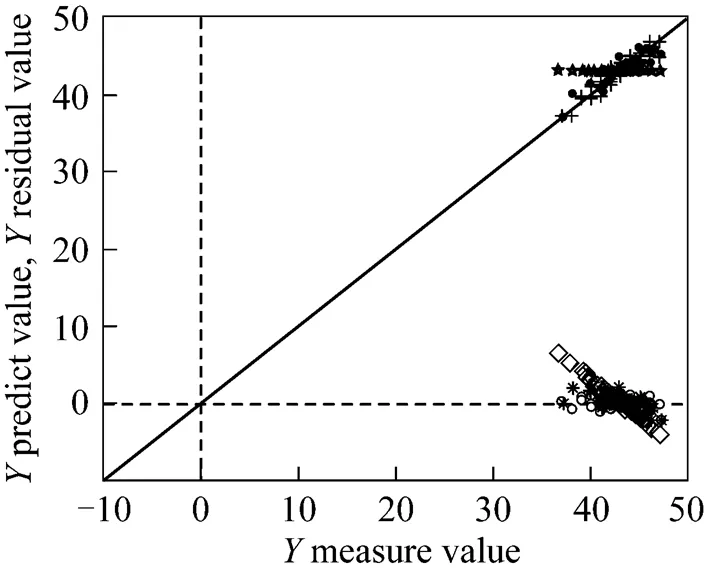
The prediction results using kernel regression are shown in Figs. 4 and 5. The upper part of Fig. 4 shows the actual and predicted values of training and testing data and the lower part shows the absolute error between actual and predicted values. Fig. 5 shows the predicted results by another method. In such plots, the data will fall on the diagonal (predicted values equal to actual values) if the model fits the data perfectly. It also shows the residual values of training and testing data. We can see from Fig. 4 that the KPCR model predicts the actual value with a relatively good accuracy. The absolute error is small. The same results can be seen in Fig. 5, in which the predicted values are plotted against observed data and the data shifts to a compact diagonal distribution on the plot. The prediction residuals are close to zero and have no significant outliers.
The estimation performance can also be evaluated in terms of the root-mean-square-error (RMSE) criterion. The RMSE values for training and testing data of KPCR method in this case are 0.5112 and 0.5843, respectively. It also shows relatively good estimation results.
Remark The RMSE index is defined as [28]:
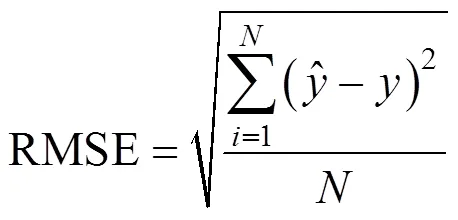

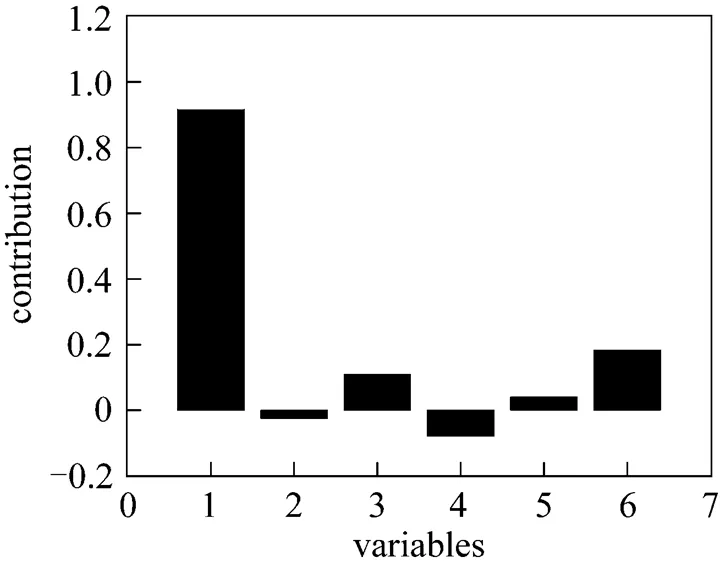
Figure 7 Contribution plot of weights in the feature direction
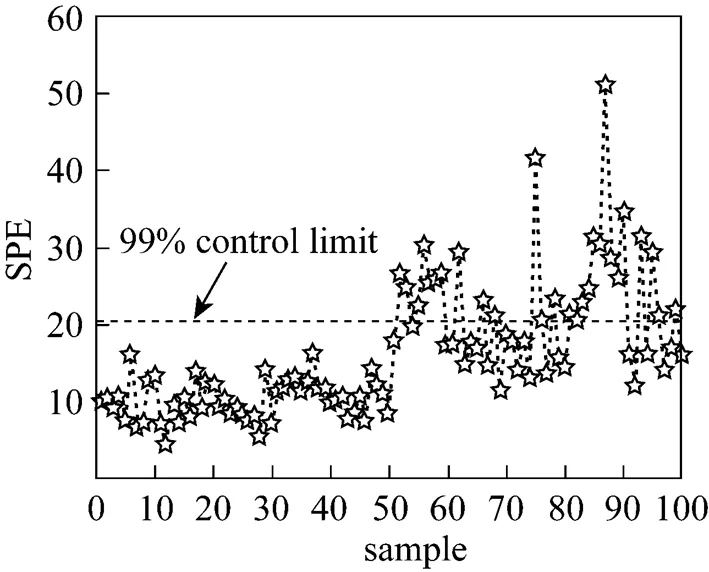
Figure 8 Quality monitoring plot of fault data using PCA
Figure 9 Estimation results by KPCR (Fault data)
We then select a test data set of 100 samples including a fault of 10% decrease in the flow rate of fresh oil. The fault is introduced in sample 50 and persists to the end of the process. The PCA monitoring chart for the fault is shown in Fig. 8. It indicates that the square predicted error (SPE) statistic has a response to the fault happening; only a few samples delay. But it is not very clear. The corresponding FDA monitoring chart is shown in Fig. 6. In contrast to Fig. 8, we can see that the statistic distance increases drastically when the fault occurs at sample 50 and exceeds the 99% control limit. It also has better performance than PCA.
After a fault has occurred, fault diagnosis is performed to identify the root cause. Fig. 7 is the contribution plot in the fault feature direction. It displays that variable 1 is primarily responsible for the fault deviation. Variable 1 corresponds to the flow rate of fresh oil. So the diagnosis result is right. The early detection and determination of the fault’s root cause will guide the operator to take correct action promptly, which could maintain the final product well.
The prediction results of yield rate based on kernel regression are shown in Figs. 9 and 10. From Fig. 9, we can see that before the fault occurs, KPCR has good prediction results. But after that, the prediction results become worse. The absolute error is large and the prediction values far derivate from the actual values. The same results can be seen in Fig. 10. Before the fault is introduced, the data distribution is compactly towards the diagonal and the residual is low. But the test data distribution is scattered and the residuals are large after the fault happens. The total RMSE for the test data is 1.9824. If the faulty values are used as feedback signals in the control system, it will lead to wrong operations. So, quality monitoring is very important and necessary to guarantee the prediction results well.
4.2 Further discussion
The performance of the estimation method based on KPCR is influenced by many factors. We will use thesamples used in Section 4.1 to discuss them extensively.
I Performance comparison of different methods
To demonstrate the predominance of the proposed method, PCR and PLS are further applied, followed by a comparison with the KPCR prediction method. The estimation results using PCR and PLS are shown in Figs. 11-14.
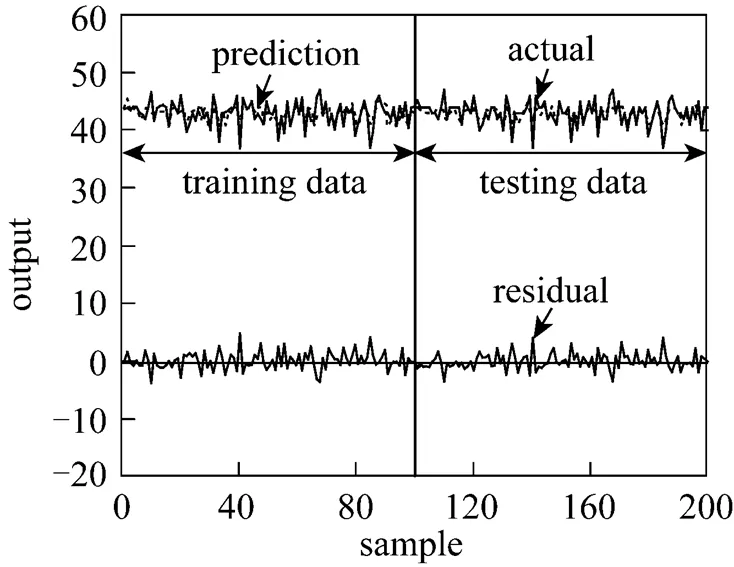
Figure 11 Estimation results by PCR
Figure 13 Estimation results by PLS
Figure 15 Estimation results with linear kernel
From the figures, we can see that, compared with PCR and PLS, KPCR (shown in Figs. 4 and 5) has better estimation performance.
Because KPCR is nonlinear modeling method, it has better prediction results. So it has a better ability to deal with nonlinear data. In this study, there are complex nonlinear relationships among input and response variables. So, projecting nonlinear input data onto a linear subspace by PCR or PLS cannot model the nonlinear relationships properly. In contrast, KPCR tries to model such nonlinear relationships preferably by a nonlinear kernel mapping into a feature space.
II Performance influence of different kernels in KPCR
When we estimate quality variables by KPCR, the choice of kernel is important. Different kernels have different influence on the performance of prediction. We use the linear kernel, polynomial kernel, and radial basis kernel for comparison, which are listed below.
The KPCR model estimation results using linear and polynomial kernel (the parameteris chosen as 5.0)are shown in Figs. 15-18. It can be seen from the figures that using linear and polynomial kernels cannot obtain good estimation results compared to using radial basis kernel (shown in Figs. 4 and 5).
The reason for this is that the input variables of the data set used are nonlinear correlated with each other and with the response variable. When linear and polynomial kernels are used, they cannot model the nonlinear correlation structure properly due to the risk of including noise in the model while trying to account nonlinearity. From our experience, radial basis kernel is more suitable for modeling such nonlinear relationships compared to other kernel functions by selecting appropriate parameter.
III Performance influence of parameterin the RBF kernel
Figures 19 and 20 present the estimation results of response variables for training and testing data with parameterequals to 0.01, 0.05, 0.5, 5, and 20. It can be seen from the figures that for training and testing data, whenis larger or smaller over a specific threshold, the estimation performance becomes worse. Therefore, to get good prediction results, the appropriate choice of parameteris important. In this case, whenis equal to 5.0, good estimation performance can be achieved. The same results can be obtained from the RMSE values of different c (shown in Table 1). Whenis equal to 5.0, the RMSE values are 0.5112 and 0.5843. They are the smallest among all the training and testing data.
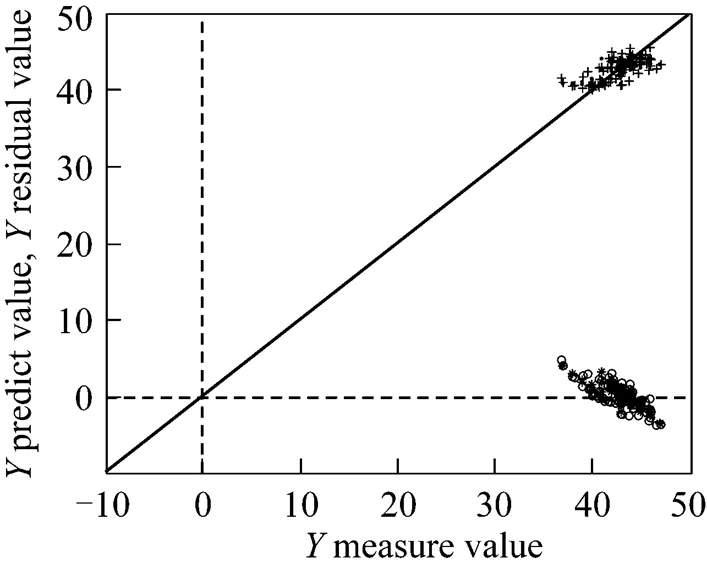
Figure 16 Estimation parity plot with linear kernel
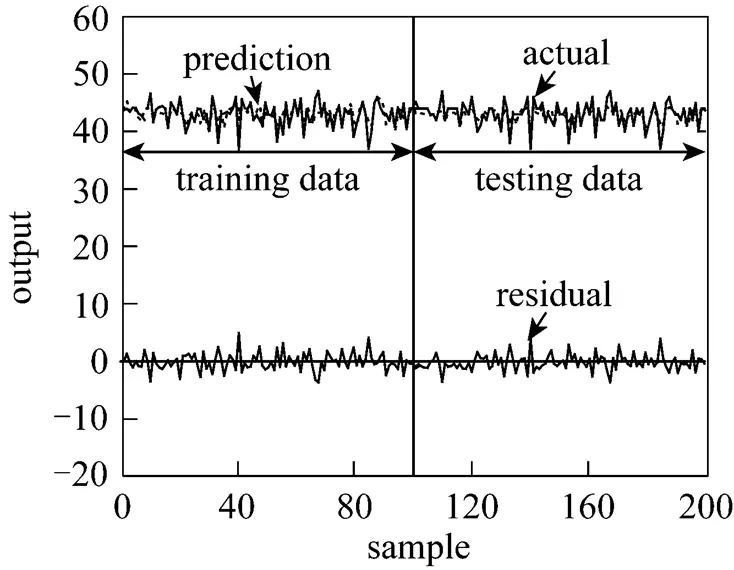
Figure 17 Estimation results with polynomial kernel
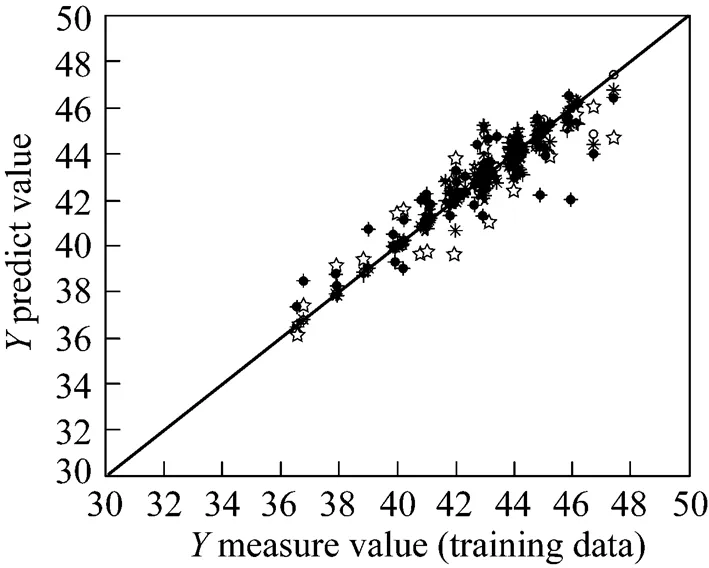
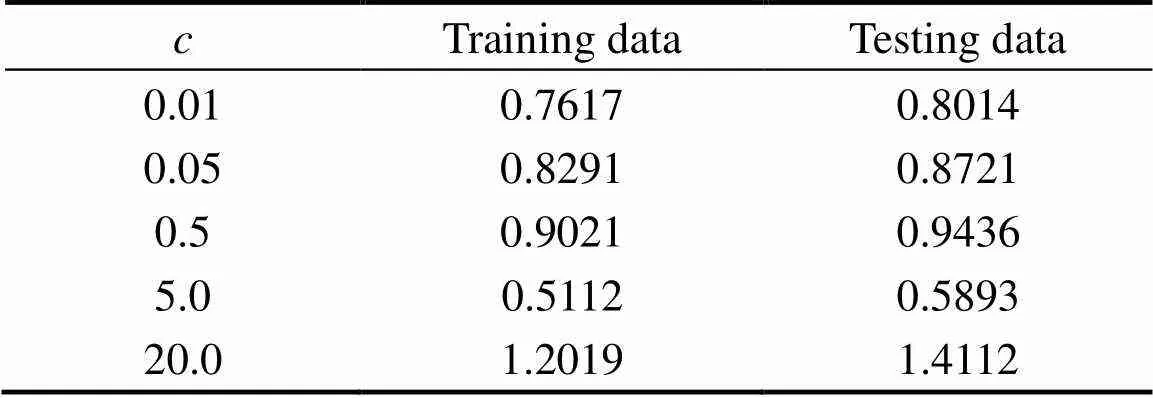
Table 1 RMSE of different parameter c in kernel principal component regression (RBF kernel)
5 Conclusions
In this article, a systemic quality monitoring and prediction method based on FDA and kernel regression is proposed. The FDA monitoring method is first performed to detect process condition. If the process is normal, kernel regression is further used to do quality prediction and estimation. If fault has occurred, contribution plot of the weights in the feature direction is used for fault diagnosis. The improvement in prediction performance observed, from PCR, PLS to KPCR, suggests that nonlinear correlation structures should not be modeled using linear approaches due to the risk of including noise in the model while trying to account the nonlinearity. The application results of the industrial fluid catalytic cracking unit (FCCU) show the effectiveness of the proposed method.
However, when the proposed method is used, how to choose kernel function and identify the kernel parameter is still an open problem. At present, we only solve this with our experience. How to settle this using a systematic approach is still a challenging issue. We believe that for the problem to be further solved, the proposed method will give more promising results.
AcknowledgEments
..
1 Joseph, B., Brosilow, C.B., “Inferential control of processes (1) Steady state analysis and design”,., 124, 485-508 (1978).
2 Lin, B., Recke, B., Knudsen, J.K.H., J?rgensen, S.B, “A systematic approach for soft sensor development”,..., 31, 419-425 (2007).
3 Qin, S.J., McAvoy, T.J., “Nonlinear PLS modeling using neural networks”,..., 16, 379-391 (1992).
4 Radhakrishnan, V.R., Mohamed, A.R., “Neural networks for the identification and control of blast furnace hot metal quality”,., 10, 509-524 (2000).
5 Kresta, J.V., Marlin, T.E., MacGregor, J.F., “Development of inferential process models using PLS”,..., 18, 597-611 (1994).
6 Park, S., Han, C., “A nonlinear soft sensor based on multivariate smoothing procedure for quality estimation in distillation columns”,..., 24, 871-877 (2000).
7 Yan, W., Shao, H., Wang, X., “Soft sensing modeling based on support vector machine and Bayesian model selection”,..., 28, 1489-1498 (2004).
8 Skagerberg, B., MacGrgor, J.F., Kiprissides, C., “Multivariate data analysis applied to low-density polyethylene reactors”,...., 14, 341-356 (1992).
9 Chen, S., Billings, S.A., Cowan, C.T.F., Grant, P.M., “Practical identification of NARMAX models using radial basis functions”,.., 52, 1327-1350 (1990).
10 Ljung, L., System Identification: Theory for the User (Information and System Science Series), Prentice-Hall, New Jersey (1987).
11 Wang, X., Luo, R., Shao, H., “Designing a soft sensor for a distillation column with the fuzzy distributed radial basis function neural network”, In: Proceedings of the 35th IEEE Conference on Decision and Control, Kobe, Japan (1996).
12 Espinoza, P. A., Gonzalez, G. D., Casali, A., Ardiles, C., “Design of soft sensors using cluster techniques”, In: Proceedings of International Mineral Processing Congress, San Francisco, USA (1995).
13 Reilly, P., Carpani, R., “Application of statistical theory of adjustments to material Balances”, In: 13th Canadian Chemical Engineering Conference, Montreal, Canada (1963).
14 Mah, R.S.H., Stanley, G., Downing, D., “Reconciliation and rectification of process flow and inventory data”,....., 15, 175-183 (1976).
15 Mah, R.S.H., Tamhane, A.C., “Detection of gross errors in process data”,., 28, 828-830 (1982).
16 Duda, R.O., Hart, P.E., Stork, D.G., “Pattern classification”, 2nd ed., Wiley, New York (2001).
17 Cho, H.W., “Identification of contributing variables using kernel-based discriminant modeling and reconstruction”,.., 33, 274-285 (2007).
18 Jemwa, G.T., Aldrich, C., “Kernel-based fault diagnosis on mineral processing plants”,.., 19, 1149-1162 (2006).
19 Zhang, X., Zhao, X., Yan, W.W., Shao, H.H., “Nonlinear biological batch process monitoring and fault identification based on kernel fisher discriminant analysis”,., 42, 1200-1210 (2007).
20 Chiang, L.H., Russell, E.L., Braatz, R.D., “Fault diagnosis in chemical processes using Fisher discriminant analysis, discriminant partial least squares, and principal component analysis”,...., 50, 243-252 (2000).
21 He, Q.P., Qin, S.J., “A new fault diagnosis method using fault directions in fisher discriminant analysis”,., 51, 555-571 (2005).
22 Zhao, X., Yan, W., Shao, H., “Monitoring and fault diagnosis for batch process based on feature extract in Fisher subspace”,...., 14, 759-764 (2006).
23 Sch?lkopf, B., Smola, A., Müller, K.R., “Nonlinear component analysis as a kernel eigenvalue problem”,., 10, 1299-1319 (1998).
24 Lee, J.M., Yoo, C., Choi, S.W., Vanrolleghem, P.A., Lee, I.B., “Nonlinear process monitoring using kernel principal component analysis”,..., 59, 223-234 (2004).
25 Rosipal, R., Girolami, M., Trejo, L. J., Cichocki, A., “Kernel PCA for feature extraction and de-noising in nonlinear regression”,.., 10, 231-243 (2001).
26 Dachapak, C., Kanae, S., Yang, Z.J., Wada, K., “Kernel principal component regression in reproducing Hilbert space”,(.....), 34, 213-218 (2002).
27 Chiang, L.H., Russell, E.L., Braatz, R.D., Fault Detection and Diagnosis in Industrial Systems, Springer, Hong Kong (2001).
28 Lee, D.S., Lee, M.W., Woo, S.H., Kim, Y.J., Park, J.M., “Multivariate online monitoring of a full-scale biological anaerobic filter process using kernel-based algorithms”,...., 45, 4335-4344 (2006).
29 Kim, K., Lee, J. M., Lee, I. B., “A novel multivariate regression approach based on kernel partial least squares with orthogonal signal correction”,...., 79, 22-30 (2005).
30 Wold, S., “Cross-validatory estimation of components in factor and principal components models”,, 20, 397-405 (1978).
2008-01-27,
2008-11-05.
the National Natural Science Foundation of China (60504033) and the Open Project of State Key Laboratory of Industrial Control Technology in Zhejiang University (0708004).
** To whom correspondence should be addressed. E-mail: masile@sdu.edu.cn
猜你喜歡
新教育·校園(2023年11期)2023-12-11 18:20:49
小學(xué)生學(xué)習(xí)指導(dǎo)(小軍迷聯(lián)盟)(2021年11期)2022-01-18 05:14:06
小哥白尼(軍事科學(xué))(2020年5期)2020-05-22 06:23:20
小哥白尼(軍事科學(xué))(2018年8期)2018-09-12 02:07:58
幼兒畫刊(2018年4期)2018-04-11 03:58:56
初中生天地(2016年35期)2016-02-23 03:18:15
小朋友·快樂手工(2015年7期)2015-08-13 00:33:38
小主人報(bào)(2015年3期)2015-02-28 20:42:01
科普童話·百科探秘(2014年10期)2014-10-10 04:01:21
小朋友·快樂手工(2014年4期)2014-08-16 10:07:32
 Chinese Journal of Chemical Engineering2009年3期
- Chinese Journal of Chemical Engineering的其它文章
- Position Group Contribution Method for Estimation of Melting Point of Organic Compounds
- Process Intensification of VOC Removal from High Viscous Media by Rotating Packed Bed*
- Adsorption of Dye from Wastewater by Zeolites Synthesized from Fly Ash: Kinetic and Equilibrium Studies*
- Modeling of Isomerization of C8 Aromatics by Online Least Squares Support Vector Machine*
- Resolution of Ibuprofen Ester by Catalytic Antibodies in Water-miscible Organic-solvents*
- Reaction Characteristics of Asymmetric Synthesis of (2S,5S)-2,5-Hexanediol Catalyzed with Baker’s Yeast Number 6*