
Decoding the inconsistency of six cropland maps in China
2024-03-07 01:52:04YifengCuiRonggoLiuZhihoLiChoZhngXioPengSongJilinYngdLeYuMengxiChenJinweiDong
The Crop Journal 2024年1期
Yifeng Cui, Ronggo Liu*, Zhiho Li Cho Zhng, Xio-Peng Song, Jilin Yngd,Le Yu, Mengxi Chen, Jinwei Dong,*
a Institute of Geographic Sciences and Natural Resources Research, Chinese Academy of Sciences, Beijing 100101, China
b University of Chinese Academy of Sciences, Beijing 100049, China
c Department of Geographical Sciences, University of Maryland, College Park, MD 20740, USA
d College of Grassland Science and Technology, China Agricultural University, Beijing 100193, China
e Ministry of Education Ecological Field Station for East Asian Migratory Birds, Department of Earth System Science, Institute for Global Change Studies, Tsinghua University,Beijing 100084, China
f Ministry of Education Ecological Field Station for East Asian Migratory Birds, Beijing 100084, China
g Tsinghua University (Department of Earth System Science)- Xi’an Institute of Surveying and Mapping Joint Research Center for Next-Generation Smart Mapping, Beijing 100084, China
h Institute of Remote Sensing and Geographic Information System, Peking University, Beijing 100871, China
i Department of Forest and Conservation Sciences, University of British Columbia, Vancouver, BC, V6T 1Z4, Canada
Keywords:Consistency and accuracy 10- and 30 m Cropland mapping Agricultural management China
ABSTRACT Accurate cropland information is critical for agricultural planning and production, especially in foodstressed countries like China.Although widely used medium-to-high-resolution satellite-based cropland maps have been developed from various remotely sensed data sources over the past few decades,considerable discrepancies exist among these products both in total area and in spatial distribution of croplands, impeding further applications of these datasets.The factors influencing their inconsistency are also unknown.In this study,we evaluated the consistency and accuracy of six cropland maps widely used in China in circa 2020, including three state-of-the-art 10-m products (i.e., Google Dynamic World, ESRI Land Cover, and ESA WorldCover) and three 30-m ones (i.e., GLC_FCS30, GlobeLand 30, and CLCD).We also investigated the effects of landscape fragmentation, climate, and agricultural management.Validation using a ground-truth sample revealed that the 10-m-resolution WorldCover provided the highest accuracy (92.3%).These maps collectively overestimated Chinese cropland area by up to 56%.Up to 37%of the land showed spatial inconsistency among the maps,concentrated mainly in mountainous regions and attributed to the varying accuracy of cropland maps, cropland fragmentation and management practices such as irrigation.Our work shed light on the promotion of future cropland mapping efforts, especially in highly inconsistent regions.
1.Introduction
Croplands play a fundamental role in safeguarding food security[1].With only 7%of global cropland,China feeds nearly 22%of the global population [2] and contributes to the United Nation’s Sustainable Development Goal of zero hunger (SDG 2) [3].However,croplands in China face pressure from non-food crop cultivation,cropland abandonment in mountainous regions, and ecological damage caused by cultivation of marginal lands [4].Timely and accurate spatiotemporal cropland information remains a prerequisite for food security monitoring [5], pest [6] and field management [7].
Remote sensing is an efficient way of acquiring cropland information [8,9].The research community has produced hundreds of land-use and land-cover (LULC) products from regional to global scales, and most of them include the category of cropland[10–12].The spatial resolution of these products has improved from coarse (1 km, 500 m) to moderate (30 m, 10 m).In the 2010s, 30-m global to regional-scale land-cover maps, including GlobeLand 30 [13], Finer Resolution Observation and Monitoring of Global Land Cover (FROM-GLC) [14,15], Global Land-Cover product with Fine Classification System (GLC_FCS30) [16], and the annual China Land Cover Dataset (CLCD) [17] have been released and widely used,followed by the freely accessible Landsat archives from the United States Geological Survey (USGS) since 2008[18]and the emergence of cloud computing techniques.Since 2015,satellites from the Copernicus Sentinel Programme[19]have laid the foundation for LULC mapping at 10-m or even higher resolution, offering the opportunity to generate cropland datasets with unprecedented spatial resolution [20].Recently, three Sentinel-derived 10-m LULC maps with worldwide cropland categories have been delivered: Google Dynamic World [21], World-Cover 2020 from European Space Agency (ESA) [22], and Land Cover 2020 from Environmental Systems Research Institute (ESRI)[23].Given that the remotely sensed data from commercial satellites (such as the PlanetScope CubeSat [24]) has not been freely available on a global scale, these open-source 10-m land-cover datasets offer the highest spatial resolution of current maps and show great potential for agricultural application in China [25].
However,evident discrepancies are widespread in existing landuse products employing differing mapping methods.A crosscomparison and accuracy assessment [26] of three 10-m landcover products demonstrated the ability of ESA WorldCover to delineate landscape elements in greater detail on the global scale.On the continental or sub-global scale, reports of the consistency assessment of multi-class land cover products[27–29]or thematic maps[30,31]also reveal discrepancies.Wei et al.[32]evaluated the consistency of five medium-resolution arable-land products across Africa and found that cropland area derived from GlobeLand30 was more consistent with FAO statistics than MODIS products for Africa.Zhang et al.[33]found that the Global Land Analysis and Discovery(GLAD) 30-m cropland dataset with the benchmark year of 2015 gave the highest overall accuracy of 0.88 in China.Thus, global accuracy does not promise regional accuracy.However, prior cropland-mapping studies have relied mainly on datasets with coarse to medium resolution released before 2020, with limited spatial detail.The further application of Google Earth Engine(GEE) in cropland mapping [34] after 2020 transformed the paradigm, permitting higher-resolution and wider scale studies.China-specific assessments have overlooked the latest 10-meter resolution maps,leaving a knowledge gap in this field.
Multiple factors,including natural factors and human activities,contribute to discrepancies among cropland products[35].The factors that constrain the consistency of cropland datasets in China have not been clearly identified.Previous studies [36,37] have examined these factors from both natural and human perspectives,and similar investigations[32,38]have been conducted on the African continent.But because China and Africa differ in geographic and climatic conditions,as well as agricultural practices,their conclusions cannot be extended to China, where the farming model follows a ‘‘big country, small farmer” approach.
Given the aforementioned issues, the objectives of this study were to 1) quantify the consistency among three 10-m resolution cropland datasets for Chinese mainland and compare it with that of three 30-m datasets; 2) evaluate the accuracy of six cropland datasets using a sample dataset independent of the data producers; and 3) investigate the climate, landscape, and agricultural management factors influencing consistency
2.Materials and methods
2.1.Cropland datasets
Detailed information on the six cropland maps compared in this study is presented in Table 1.The three 10-m resolution maps were Google’s Dynamic World (DW) [21], ESA’s WorldCover 2020 (WC)[22], and ESRI’s Land Cover (ESRI) [23].The deep learning models are trained and applied to the production of DW and ESRI maps based on the same reference dataset of over 5 billion pixels derived from the Sentinel-2 images around the world and produced separately by cloud computing on GEE and Microsoft Planetary Computer.For WC, 141,000 hand-labeled pixels were used to train a random forest model using both Sentinel-1 and Sentinel-2 data.For the minimum mapping unit (MMU), the ESRI and DW models were trained on reference data with a MMU of 250 m2, whereas WC was trained on data with a 100 m2MMU.The WC and ESRI are annually updated datasets, whereas the DW is operationally delivering a near real-time LULC map when Sentinel-2 scenes become available approximately every 5 days [26].
The 30-m LULC products used in this study were CLCD, Globe-Land 30 (GL30), and GLC_FCS30 (GLCFCS).CLCD is a time-serial LULC dataset for 1990–2020 produced by Wuhan University in China and is generated using a nationwide training sample and the random forest algorithm based on GEE[17].The GL30 product is one of the most widely used land cover products developed using a pixel-object-knowledge method based on multi-temporal Landsat and HJ-1 (China Environment and Disaster Reduction Satellite)A/B imagery[13].The latest version of GL30 was updated in 2020.GLC_FCS is a global land-cover product based on time series of Landsat imagery and automated training dataset derived from the Global Spatial Temporal Spectra Library(GSPECLib),with a fine classification system and updated at 5-year intervals since 1985 [16,39].The overall accuracy declared in the user guides for CLCD, GL30, and GLC_FCS are 79.31%, 85.72%, and 82.50%, respectively (Table 1).GL30 and GLC_FCS offer full world coverage,whereas CLCD is a China-specific product.
2.2.Ancillary data
2.2.1.Ground-truth sample
The volume and distribution of ground-truth data can affect the results of validation [40].In this study, a multi-sourced ground truth dataset was used to quantitatively evaluate the precision of the cropland products.The dataset comes from our previous study[33] and consists of 33,713 vector sample points across China recorded in ESRI Shapefile format,each of which lists two attributes including the geo-position and binary cropland/non-cropland label.
The sample used in the study was generated by integration of the validation sample subset in China from the GFSAD(Global Food Security-support Analysis Data) [41] and AGLC (Annual Global Land Cover)[42]global validation dataset,as well as augmentation with the help of Google Earth’s highly detailed images and historic Landsat archive.First, 4435 total samples (1999 from GFSAD and 2436 from AGLC, respectively) were inherited from the existing global sample pool and randomly distributed across China.Second,29,278 further sample points distributed throughout the country were generated by stratified random sampling to preserve a balance among numbers of samples in potential cropland layers(rather than a random distribution across the whole of China).We sampled these points with strata defined by the proportion of pixelwise consistency evaluation among the six cropland datasets(proportions are shown in Fig.S1).The non-cropland category(regions not classified as cropland in any datasets, shown in black pixels in Fig.1C)was overrepresented and thus did not participate in the stratified sampling.In all, 33,713 samples were generated,distributed across the country in every stratum as well as in noncropland regions.They also encompassed diverse landscapes present in China.Prior to final validation,each sample unit underwent careful examination by two trained persons to ensure they were located within the field boundary of pure rather than the mixed pixel with the help of Google Earth images within the year of 2020 through the online accessible web map tile service (WTMS)services(Fig.S2A),and their stability and representativeness were also demonstrated.The Fig.S1 shows the spatial distribution of ground-truth samples.
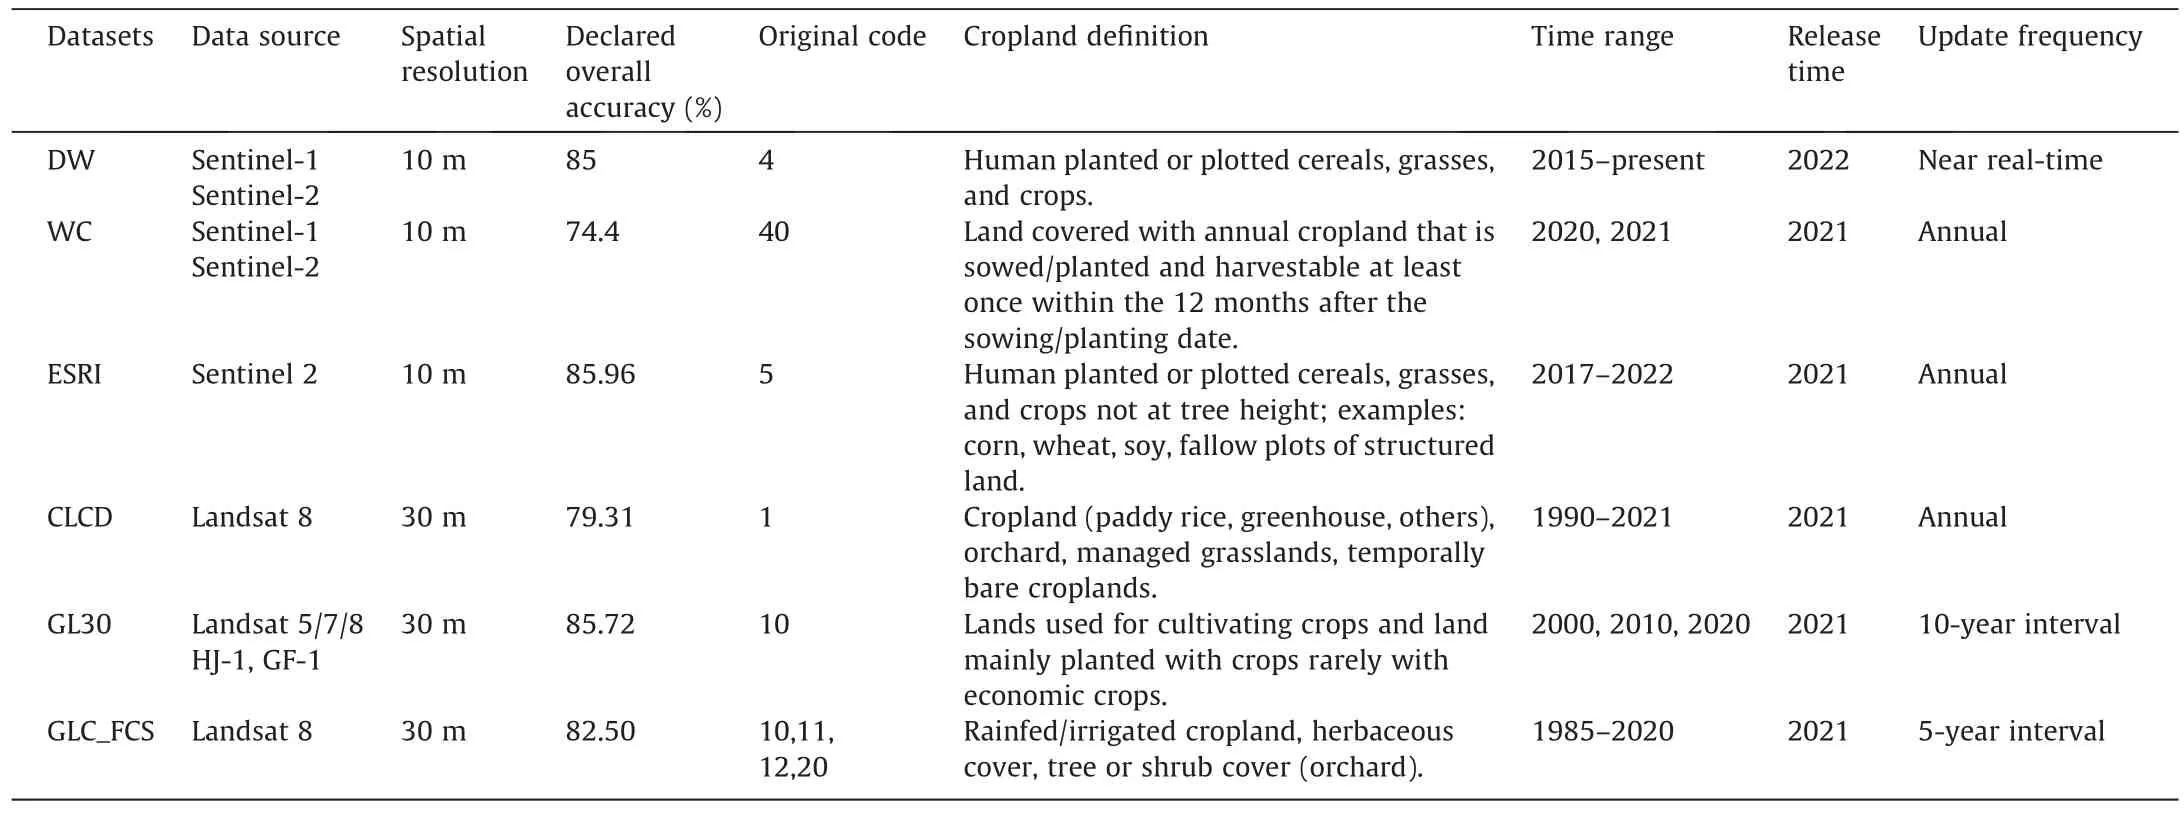
Table 1 Basic information of six cropland maps derived from the corresponding LULC products.
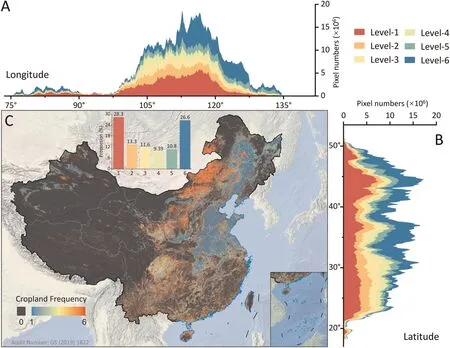
Fig.1.Spatial distribution of consistency among six cropland datasets across China in the benchmark year of 2020.Plots on axes show the numbers of pixels at the corresponding longitude(A)or latitude(B)assigned as cropland by each of the six color-coded datasets,shown in the Level-1 to Level-6 in the legend.(C)The bar plot in the map describes the proportion of all pixels assigned as cropland by each of the datasets.The 10-m resolution cropland products were resampled to 30-m using the nearestneighbor method before overlaying to conduct the pixelwise consistency analysis.The authors declared that boundary of China map is totally based on the Audit Number:GS(2019) 1822 without re-editing.
2.2.2.Statistics from land survey
The official cropland area data for years 2019–2021 were acquired from China Rural Statistical Yearbooks published by China’s National Statistical Bureau (https://data.cnki.net/Yearbook).The data were derived from the Third National Land Survey,which is considered [43] to be the most authoritative source of land use data in China.Given that this Survey was based on December 31,2019 as the reference time point, the statistics for the year 2020 were corrected at the provincial scale.To remove the inter-annual fluctuation of cropland areas,they were averaged over 2019–2021(Table S4).
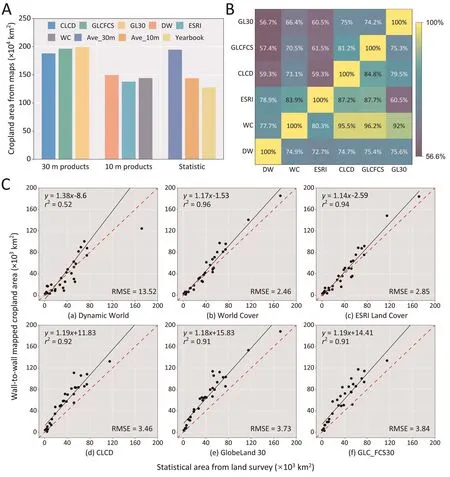
Fig.2.Areal consistency of cropland maps.(A) Areal comparison and linear relationships of six cropland products with statistics from land survey.(B) Cropland area consistency of six LULC datasets.(C)Provincial-level comparison between wall-to-wall mapped area from six remotely sensed cropland datasets and statistic data from land survey.The scatterplot shows all the provincial administrative units in Chinese mainland (d) The 2019–2021 three-year-average cropland area from the land survey was compared with the wall-to-wall mapping area for each cropland map.
2.2.3.Agri-climate zones and irrigation datasets
Ancillary data for spatial agreement analysis consisted of agricultural climate zones and irrigated areas.The natural agricultural zones of China are mapped in ESRI Shapefile format based on temperature and humidity, which divide China into 13 temperature zones (Fig.S3) and 37 natural agricultural zones (with abbreviations shown in Tables S1,S2).These zone data are from the Center for Resource and Environmental Data Science,Chinese Academy of Sciences (https://www.resdc.cn/).Although located in the same agri-climate zone and with similar parcel sizes, the consistency of different cropland products varies due to the different agricultural management.Irrigation is a universal agricultural management practice in coping with monsoon climates for the shortage of precipitation in Eastern Asia countries, especially in China.Irrigation may affect the accuracy of cropland mapping subtly by influencing biogeochemical characteristics or surface albedo [44],leading to spectral differences in cropland mapping [45].The irrigated-area data were derived from China’s first long timeseries annual irrigation map IrriMap_CN, incorporating data from multiple sources and using statistical downscaling and collaborative mapping methods with a stable accuracy of over 75% [45].The spatial consistency percentages of farmland with different irrigation ratios were counted in six subgroups (less than 15%, 15%–30%, 30%–45%, 45%–60%, 60%–75% and over 75%) in our study.
2.3.Preparations of six cropland maps in China
All the six cropland thematic maps used in this study were extracted from the corresponding global or regional LULC datasets according to the definitions in the user manuals of each dataset,in which for GLC_FCS there are multiple cropland subcategories to be merged into one category to generate a cropland/non-cropland binary map.Cropland datasets were divided by their spatial resolution into two groups and then uploaded to GEE Assets for further processing.They were then clipped to the boundary of China,reprojected to an equal-area projection, resampled to the 10-m or 30-m spatial resolution individually, and stored locally.Each dataset was thus binarized as cropland and non-cropland pixels with values 1 and 0, respectively (Fig.S4).In view of the near real-time nature of DW, which differs from the other annually updated datasets, we used the MODE compositing method in GEE Application Programming Interface (API) documents (https://developers.google.com/earth-engine/apidocs/ee-imagecollectionmode)to calculate the most frequent value at each pixel for generating the cropland map for 2020.
2.4.Area-based consistency comparison
Cropland areas derived from each dataset at the national and provincial levels were calculated using zonal statistics and then compared to the statistics data.The degree of consistency was defined as high, medium, or low if respectively three, two, or one dataset labeled the same area as cropland.Accuracy metrics were R2and root mean square error (RMSE).The indicator including coefficient and RMSE could give a further quantitative measurement.A higher correlation coefficient (and lower RMSE) indicates better fitness and less deviation from statistics, and vice versa.
where xiand yiis the cropland area of province i derived from the datasets and the statistic, n is the number of provinces taking part in the comparison (Hongkong, Macau and Taiwan are excluded due to the lack of statistic area).
Areal consistency in this study refers to the degree to which the boundaries of two cropland datasets match and coincide as well as their differences.To assess areal consistency, the cropland maps from each dataset were overlaid,and the proportion of the overlap was calculated as a proportion of the total cropland area in the cropland dataset being compared:
where Aiis the area of overlapping regions of two pairwise cropland products,Ajrepresents the area of assessed cropland datasets being compared, and PropAreadenotes the proportion of consistency,where the maximum value does not exceed 100%.
2.5.Spatial consistency comparison
Cropland is unevenly distributed in China,meaning that consistency in the overall area does not necessarily lead to spatial consistency.In this study,a pixel-by-pixel comparison was conducted on different products.The six cropland datasets were divided into 10-m and 30-m groups.In each group,the three binary cropland labels for each pixel were summed to yield the frequency (0–3) with which the pixel was labeled as cropland.A pixel labeled as cropland by at least one product thus showed either high, medium,or low cropland consistency.
Spatial consistency was retrieved also from the samples.Cropland samples in the sample pools permits estimating not only the degree of cropland identification in each product but also the consistency and correctness of cropland labeling.
2.6.Sample-based accuracy assessment
Because the cropland labels were binarized, accuracy assessment was identical to binary classification testing.Unlike a single global estimate of classification accuracy provided by the dataset’s producers,individual samples were used to perform local accuracy assessment for cropland in a sub-region.Five metrics: user accuracy (UA, also known as precision), producer accuracy (PA, also known as recall or sensitivity), F1 score, overall accuracy (OA),and Matthews correlation coefficient (MCC), were derived from the confusion matrix [46].The calculation of these metrics is as follows:
where TP and FP represent true and false positive predictions of cropland class by the maps and TN and FN represent true and false negative predictions.
2.7.Analyses of factors influencing consistency
The cropland products’ consistency across China could be attributed to natural and anthropogenic factors.Several potential factors (such as climate characteristics and pattern of terrain and parcels)can influence consistency.Most of the non-natural factors are affected by human activities directly or indirectly(for example,by government policy changes in land use or irrigation infrastructure).Based on our previous analysis and evidence from various relevant studies [33], we attributed the cropland product consistency across China primarily to the influence of agroclimatic zones,the pattern of parcels, and irrigation status.
Using the agri-climate classification division boundary, we characterized the relationship between climatic distribution and spatial consistency.We divided China into 13 climate zones and 37 agricultural subzones according to temperature and wetness indicators (Fig.S3).This climate distribution was overlaid on the consistency map developed in the section 2.5 and spatial consistency was calculated for each subzone.
In view of China’s vast area and its land policy (such as the Household Responsibility System for Collective Farming policy which divided the collective cropland into individual parcels[47]), agronomic practices vary widely across the country, resulting in heterogeneity in patch size and degree of aggregation.The pattern of cropland parcels was also analyzed due to its previous discussion in related articles [48].Three landscape indicators derived from the 10-m WC: mean patch size (MPS), edge density(ED),and fragmentation index(FI),were computed on 20-km grids using the SDMTools R package [49].MPS, ED, and FI were calculated for each map in formula (9) to (11).In this calculation, each patch represents a single cropland parcel.
where NP and A patchiand Edge represent respectively the number of patches, the area of patch i in the projected coordinate system and the total length of patch.
Furthermore, a LOESS fitting was performed in temperature or agricultural zone regions,and coefficients were calculated to quantify the relationship between pattern indicators and spatial consistency.The R2statistic were used to analyze the relationship between the shape of cropland and levels of spatial consistency.The proportions of irrigated cropland pixels were used to indicate irrigation levels ranging from 0 and 100%.The spatial consistency map was calculated for various irrigation levels.
3.Results
3.1.Areal consistency
The six LULC datasets-based cropland maps describe the spatial patterns in China.In general,most of the croplands are distributed in the monsoon region of east China and the northwestern region,while sporadic croplands occur in the Qinghai-Xizang Plateau(Fig.S4).The three 30-m products showed similar cropland distribution patterns,whereas the three 10-m products showed sparser cropland in southern China.GL30 has the largest cropland area in Chinese mainland, reaching 199.26 × 10⁴km2in 2020; while the ESRI has the smallest cropland area of 137.80 × 10⁴km2.The two products showed a difference of 30.84% in cropland areas.For cropland products with the same spatial resolution,the differences in the quantification of China’s cropland area are relatively small.Note that the 10-m products generally have a lower average area than 30-m products and are closer to the statistical data from the Yearbook.Although there are differences among these cropland datasets,they are somewhat consistent in portraying the spatial distribution of cropland across China.
All datasets, especially the 30-m resolution products, overestimated the cropland area described in the Yearbook at the provincial level (Fig.2A, B).Of the six products, all but DW showed a good correlation between statistics (Fig.2C).The cropland area derived from WC gave the highest correlation with an R2of 0.96,indicating a more accurate estimation of cropland area than provided by the other five datasets.DW showed the poorest fit(R2= 0.52) and the highest RMSE (12.85).In scatterplots(Fig.2C), regression outliers indicate provincial administrations showing large differences between mapped cropland areas and census data, in particular Inner Mongolia in DW.
3.2.Spatial consistency among cropland maps
Fig.2 depicts the pixelwise spatial consistency for the six cropland datasets at 30-m resolution.The proportion of the six datasets that were completely agreement was only 26.6% and the proportion with the worst consistency was 28.3%.In contrast, 45.1% of the regions had 2–5 of the six datasets considered to be arable land.High-consistency areas were concentrated in middle-tohigh latitude agricultural regions with flat terrain, primarily in the plains of northeastern and central China (east of the Heihe–Tengchong Line), and in the Hetao Plain and oases in the Tarim Basin.Owing to the favorable climate and advanced tillage technology, extensive and continuously distributed croplands were found mainly in these regions.An area of low consistency was found in the center of the Inner Mongolian Plateau.Lowconsistency area (owing to commission caused by DW) accounted for nearly a quarter of the cropland area.The landscape in these regions was dominated by fragmented parcels mosaicked by diverse land cover types or sparse vegetation, making misclassification a common source of error in cropland extent mapping.Consistency among datasets with the same spatial resolution (Fig.S5)agreed with the consistency of the six datasets on a national scale.
A zoomed-in illustration of six typical sites (Fig.3A–F) demonstrates the differences between the cropland products.These sites’spatial distributions are shown in Fig.S5.Both the 10-m and 30-m datasets accurately mapped the spatial extent of concentrated and continuous cropland evenly distributed in the broad plain area with high accuracy, except for DW, which showed the highest omission error.However, in areas with fragmented parcels(Fig.3F) or complex backgrounds in transitional zones (Fig.3B),the 10-m products better delineated cropland boundaries.Among the three datasets with 30-m resolution, the cropland extent in the fragmented area was overestimated.The same overestimation was observed in cropland mapping in humid and semi-humid regions.GLC_FCS and CLCD described the spatial extent of cropland similarly to the 10-m datasets in most geographic areas.However,large discrepancies were found in highland valley regions such as the Qinghai-Xizang Plateau (Fig.3E), with CLCD almost unable to detect the presence of cropland.The WC yielded a cropland distribution most similar to the actual cropland distribution, followed by ESRI, GLC_FCS, and CLCD.The performance of DW in depicting cropland parcels was relatively unstable.
3.3.Accuracy assessment with sample points
Table 2 shows error matrix metrics.The overall accuracy in all products ranged from 81.9% to 92.3%, higher than the accuracy claimed by the product developers at the global scale.The 10-m products were more accurate than the 30-m products.WC showed the highest overall accuracy of 92.34%,followed by GL30(86.24%),ESRI (85.33%), and CLCD (84.59%).Despite the overall accuracy of GLC_FCS being the lowest among the six products, the number was still 81.87%.With respect to omission error, DW ranked first with 26.1%.The highest omission error is reflected in the poorest fitting effect due to the overestimation of cropland area,especially in northern China provinces such as Inner Mongolia (Fig.4A).The small omission error in WC (9.8%) is consistent with its performance in cropland estimation.For commission error, GLC_FCS exceeded other products with a value of 25.3%, matching its overestimation in the cropland area for all provinces.For MCC, a more appropriate metric for binary classification, WC still ranked first with 0.845, followed by GL30 and ESRI with Matthews correlation coefficient values above 0.70.They were followed by CLCD, DW,and GLC_FCS in descending order.Taking all metrics into consideration, WC gave the most balanced performance (higher overall accuracy and lower omission and commission error), followed by GL30.The accuracy of the six cropland maps on the scale of 13 climatic zones is illustrated in Table S3.Fig.4(b)depicts the positive relationship between the high accuracy represented by the average F1 score and the proportion of consistency.
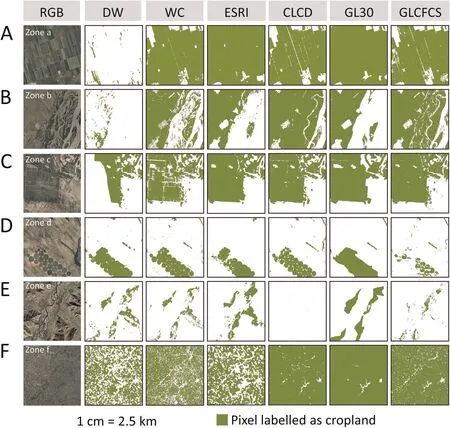
Fig.3.Zoomed-in illustration of spatial extent for six cropland products in blocks Zone a–f.Green pixels represent the extent of cropland in each maps.The specific locations of blocks are shown in Fig.S5.
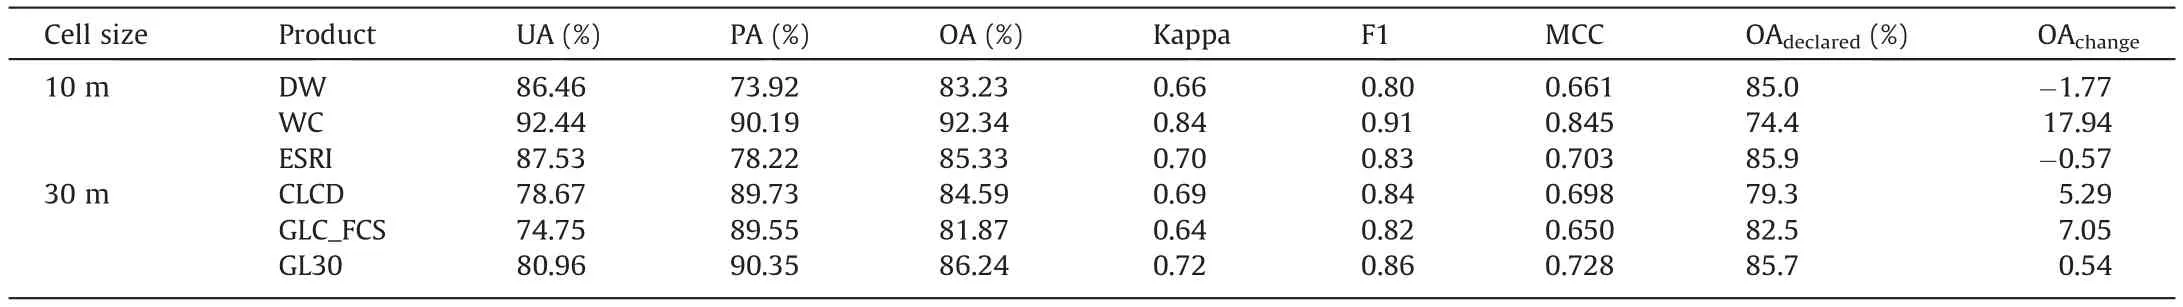
Table 2 The pixelwise accuracy of six cropland products.
3.4.Factors affecting the inconsistency of cropland maps
3.4.1.Performance in agri-climate zones
Spatial heterogeneity across climatic and agricultural zones was visualized by overlaying the consistency map(Section 3.4)with the boundaries of agriclimatic zones (Fig.S3).
The consistency between 10-m and 30-m products was similar across temperature zones(Fig.5).For both 10-m and 30-m consistency comparison, the level of high consistency dominated the components in warm temperate (53.97% and 60.98% respectively)and mid-temperate (54.56% and 68.32% respectively), while the level of low consistency dominated in arid temperate (61.07%and 37.49% respectively), cold temperate (54.97% and 64.43%respectively) and Plateau climate zones (60.73%–99.19% and 57.64%–99.95%respectively).Differences lay mainly in Arid Warm Temperate and Arid Temperate,where the proportion of mediumlevel consistency varied widely.
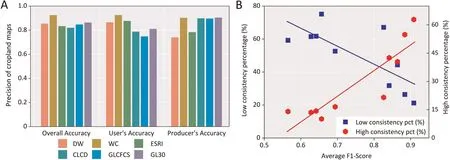
Fig.4.Sample-based accuracy assessment of six cropland maps(A),and its relationship with consistency in 13 climate zones(B).The two metrics User’s Accuracy(UA)and Producer’s Accuracy (PA) are represented numerically as the difference between 1 and Commission Error (CE) and Omission Error (OE) respectively to better illustrate the accuracy of the six cropland datasets.The mean F1 score of the six cropland maps was selected as representative of accuracy.The detailed spatial distribution and confusion matrix of sample-based accuracy for six maps can be referred to Figs.S6 and S7.
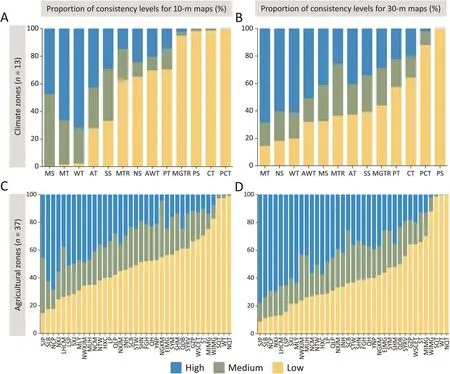
Fig.5.The proportion of three spatial agreement levels (high, medium, and low) in 13 climate zones (A, B) and 37 agricultural zones (C, D) in ascending order by low consistency.(A, C) and (B, D) show the 10-m and 30-m consistency maps, respectively.The full names of the x-axis labels can be found in Tables S1 and S2.
At the level of the 37 agricultural zones, the high-consistency proportions were located mainly in regions with suitable farming conditions shaped by climate.In the 10-m products, the highest proportions of complete agreement (with percentages above or below but close to 50%)were distributed mainly in the North China Plain (NCP, 68.19%), Songliao Basin (62.18%), Northern Xinjiang(55.36%), and Liaodong-Shandong Peninsula (50.85%), followed by Southern Xinjiang (49.36%), Northwestern Xinjiang Mountainous (48.39%), Middle and lower reaches of the Yangtze River(47.28%) and Middle and Upper Reaches of the Han River(46.98%).These areas have a high concentration of population and well-developed agriculture.The spatial distribution of arable land is dense and the size of individual parcels is large, making them well-monitored by satellites at either 30-m or 10-m spatial resolution.The spatial distribution of high consistency was broader and more uniform in 30-m than in 10-m products across China.In addition to the same areas as the 10-m data, the following areas also showed high agreement: Sanjiang Plain (77.70%), Sichuan Basin(68.63%), Hinggan and the Changbai mountain (60.18%), and Northern Taiwan (50.31%) for 30-m cropland products, with over 50% pixels showing high agreement.In contrast to the pattern of high-consistency distribution, the low-consistency areas of the two resolution products are highly coincident in spatial distribution.In some regions, the low-consistency ratio even exceeded 80%, such as in the Hinggan Mountains, the Hengduan Mountains,and Xizang or Qiangtang areas with extreme climates.Among them, the Qinghai-Xizang Plateau is known as the third pole of the earth,where high-altitude solar radiation is intense and cumulative temperatures are low.Most areas have an arid climate and insufficient water for irrigation, resulting in poor crop growing conditions.Only in some lower-altitude areas,such as the southern Yarlung Zangbo River valley, the eastern Huangshui valley, arable land is located mainly in the river valley zone terraces.These areas have a large elevation drop, and the already sparse cropland is interspersed with bare land or mixed with other vegetation, such as coniferous forests.The combination of multiple types of vegetation and cropland prevented the dataset from achieving greater consistency in cropland mapping.
The semi-humid semi-arid zone in northwestern-northern China is an eco-vulnerable zone that spans a wide range of longitudinal gradients.There were large differences in spatial consistency within the agricultural zones of the region.This is mainly because the region is influenced by various factors, such as the degree of agricultural land development and utilization, the level of socioeconomic development, and agricultural management practices.As several of the most agriculturally developed regions in northwest China, the Hexi Corridor, which is irrigated by the glacier meltwater,and the Hetao Plain,which has the benefit of irrigation by the Yellow River, have the highest consistency.For the same reason, the Xinjiang oasis arable land region with similar resource conditions also showed high spatial consistency.
3.4.2.Landscape fragmentation pattern
In the grids with 20 km resolution, grids with lower MPS and higher ED tended to have larger FI values, indicating more fragmented agricultural landscapes with smaller cultivated parcels or more discrete distributions.MPS is a ratio-type indicator with a directly comparable scale.For the temperature zone scale, regions with small MPS values(the values of the horizontal coordinates in Fig.6) were distributed mainly in the vast hilly areas south of the Qinling-Huaihe River (MGTR, MTR, SS) or in the high-altitude cold regions (PS, PCT).
There were positive correlations between FI, ED, and inconsistency at the temperature-zone level, with R2reaching 0.787, and P-value less than 0.001.In contrast,there was a significant positive correlation between MPS and consistency.In both 10-m and 30-m products,regions with concentrated distribution of cropland,large parcel sizes, and even agricultural landscape homogeneity such as AT,AWT,and MS reduce the difficulty of satellite mapping,thereby reducing inconsistency between cropland datasets.
3.4.3.Irrigation
Fig.7A shows that the high consistency of cropland datasets tended to increase with the proportion of irrigated cropland at the low to medium irrigation levels (< 60%) level.In contrast, low consistency tended to decrease as the irrigation percentage increased before the maximum interval of irrigation rate (60%–75%)was reached.Regions with a larger share of irrigated cropland(usually accounting for over 60%)yielded high consistency among cropland mapping products,with high agreement reaching 74.57%.High consistency ranged from 54.34% to 65.62%, and low consistency ranged from 17.96% to 24.78% in the middle interval of irrigated cropland (30%–60%), indicating comparatively high consistency.The regions with irrigated proportion below 30%showed the poorest spatial agreement of cropland mapping datasets.These regions have the lowest irrigation rates in the six groups, resulting in the highest proportion (up to 54.20%) of disagreement owing to relatively unsuitable farming conditions caused by scattered tiny fields or climate conditions and the relative backwardness of irrigation techniques.
Fig.7 shows the relationship between the proportion of irrigated land and the consistency of the 10-m cropland dataset within 11 climate zones and 32 agri-zones(excluding two temperate zones and five agri-zones where there was no irrigated cropland).Tendency was found in most regions, except for PS in the temperature zone and SQ in the agri-climate zone, where there was a near absence of scatter representing irrigated cropland.To further investigate the relationship, we divided the 32 agri-zones containing irrigated cropland into two categories:below and above the 800 mm isoprecipitation line (Fig.7B).For agri-zones located north of the 800 mm isoprecipitation line, which typically receive less than 800 mm of annual precipitation, the proportion of lowconsistency pixels within the region gradually decreased as the proportion of irrigation increased.This trend was not as clear for irrigated cropland in the south.A more detailed quantitative relationship analysis of each agri-zone and temperature zone is presented in Figs.S10, S11.
4.Discussion
4.1.Reasons for inconsistency among cropland maps
The first reason for the discrepancies in cropland assignment among mapping datasets was the inconsistent definition of cropland in the classification system used.The definition of cropland varies between datasets, and the six datasets tended to adopt a broader interpretation of cropland than specified in the classification system (Table 1).For example, the inclusion of grasslands in DW and herbaceous or shrub cover in GLC_FCS contributed to overestimating cropland area (Fig.2A).This inconsistency in definition is also the primary reason for the overestimation of cropland area in all datasets with respect to the official land survey [15].Finding a consensus on a definition of cropland that can satisfy both remote sensing datasets and the mapping capabilities of the algorithms, while also meeting the commonly accepted needs of tillage science, could reduce the inconsistency among remote sensing-derived cropland datasets.The definitions of cropland in all six datasets evaluated in the study include human-planted cereal crops, but vary to include cereals, grass, shrubs, and economic crops.GLC_FCS differentiates between four subcategories of cropland: rainfed cropland, irrigated cropland, herbaceous cover, and shrub-covered surfaces [16].We recommended that producers of remotely sensed maps of cropland should first focus on mapping cropland accurately following the consensus definition and only then consider developing maps of other land-cover types associated with cropland systems.To achieve this,more attention should be paid to abandoned cropland, irrigated cropland, shrub- and grass-covered cropland,and cash crops and cereals, which are difficult to distinguish from conventional medium-resolution optical remote-sensing data.A path towards the realization of the above recommendations is to make full use of higher-resolution optical data, to combine remote sensing data from multiple sources such as radar and LiDAR, and to promote the sharing of ground-based crowdsourced samples[50]for more accurate mapping of cropland systems.Five of the six cropland products were produced using cloud computing technology (on Google, Amazon, or private cloud-computing platforms),but their performance in China varied greatly,even though they were derived from the same data source.The semi-automated classification with human intervention of GL30 showed a closer match to official statistics with respect to the definition of arable land [13].
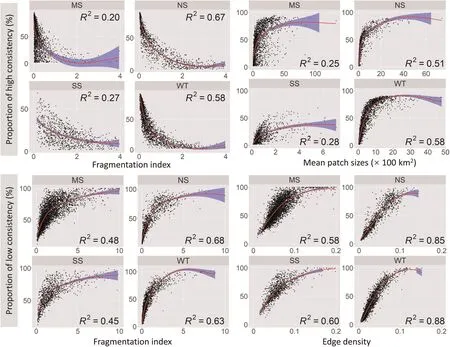
Fig.6.Correlation between spatial agreement and three indicators in four representative climate zones (MS, NS, SS, and WT).All 13 climate-zone-level correlations can be seen in Fig.S8.
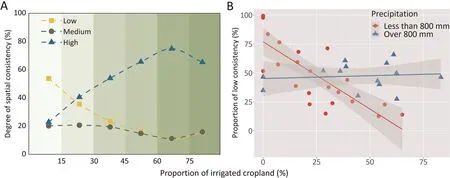
Fig.7.Relationship between percentage of irrigated cropland and degree of consistency.(A)Three consistency levels with proportion of irrigated cropland.(B)Comparison of two precipitation degree in proportion of low consistency with irrigated cropland.
The increased spatial resolution of the 10-m datasets contributed to their superiority in matching the official statistics(Fig.2) and delineating parcel boundaries (Fig.3), in agreement with the findings of Lu et al.[51].Owing to the higher spatial resolution,the proportion of mixed image elements in heterogeneous regions was greatly reduced, particularly in southern hilly and mountainous regions (Fig.3E).However, the 30-m products, such as GLC_FCS and CLCD,still offered advantages.GLC_FCS performed better than all 10-m products in characterizing cropland subtypes and delineating the extent of irrigated cropland(Fig.3D),owing to its detailed classification system with four subtypes of cropland(shown in Table 1).This is also consistent with the findings of our previous research [33].In addition, CLCD’s annual long-timeseries mapping capability has played an irreplaceable role in mapping the spatial and temporal dynamics of cropland on a timeseries national scale since the 1980s.The ability to map long time series of cropland dating back to the 1980s is not possible with existing 10-m data under current data-processing schemes.
4.2.Importance of regional scale evaluation
Our study also emphasizes the importance of evaluating the accuracy of cropland mapping products on a regional scale.The three 10-m products showed higher overall accuracy than the 30-m products (Fig.4).The overall accuracy of these products in China differed from the global accuracy reported by their producers.WC had the highest overall accuracy of 92.34% across China,followed by ESRI and DW, which differs from worldwide results[26].DW’s accuracy in China was much lower than its reported global accuracy, owing to the huge commission error caused by massive misclassification in Inner Mongolia Gobi regions(Fig.S9B).Among the 30-m datasets, CLCD had the highest accuracy,followed by GL30 and GLC_FCS.This finding is consistent with those from a previously reported comparison [33] of five 30-m datasets.The reasons for the discrepancies are also associated with the definition of cropland,the characteristics of the validation data and the temporal phase of cropland mapping datasets.While the validation dataset is a binary shapefile data format of cropland/non-cropland,in reality however,the distinction between cropland and non-cropland is not absolutely strict (being confounded by widespread cropland abandonment, also known as de-farming[52],de-fooding[53],etc.).This means that conventional hard classification strategies cannot represent this natural process well.Moreover,in semi-arid or semi-humid regions with intense surface vegetation dynamics,the process of surface cover change in arable land within a year is complex[47].This complexity prevents cropland datasets with a lower update frequency(like the annual-scale cropland mapping products) from accurately labeling cropland,resulting in reduced overall accuracy.In this way, the GLC_FCS dataset,with its refined cropland subclass mapping capability,represents the future direction of soft classification strategies.In the meantime, the utility of DW in mapping near-real-time dynamics should be recognized and valued.
The six cropland maps showed high consistency,particularly in agricultural zones such as NCP,SCB,and SJP.This means that both maps performed quite well in these regions.These regions are distinguished by climates, soils, and topographies that are favorable for agricultural cultivation.They are prominently represented in Fig.1 as areas shaded in blue, indicating a cropland frequency of greater than or equal to 5.In these regions, the differences in the application of various cropland maps due to inconsistencies can be significantly reduced compared to other regions.This reduction in inconsistency becomes particularly important when cropland maps are used as masks for predicting the impacts of hazards,such as floods [54].
4.3.Effects of climate and irrigation on spatial consistency
Producing cropland datasets is inherently difficult owing to the extensive biogeographical variation within and across biomes,resulting in diverse spectral signatures.For this reason,differences and inconsistencies among datasets are unsurprising.Spatial heterogeneity of consistency across climatic and agricultural zones was observed in the analysis based on parcel patterns and agricultural land management measures represented by irrigation.Spatial consistency was negatively correlated with the degree of fragmentation of arable land,and consistency was generally higher in areas with suitable climatic conditions and developed irrigation management.In agricultural areas suitable for farming, the more concentrated and contiguous the distribution of cropland and the larger the average patch size,the larger was the MPS and the smaller the FI, as reflected in Fig.6.Thus, the probability of pure cropland pixels is higher for optical satellite data with a spatial resolution of 30 m or 10 m, so that the difference in the cropland mapping result between the two spatial resolution products in these regions is small.In contrast, for areas with relatively small patch area and fragmented distribution,increasing the spatial resolution of remote sensing will improve arable-land mapping.Irrigation affects the performance of arable mapping products and consistency among datasets by influencing the degree of spectral variation in farmland.Such agricultural practices have a stronger effect on irrigated cropland area north of the 800 mm isoprecipitation line.In this region, the heterogeneity of spectral features between cropland and grassland or shrubland gradually increased with irrigation percentage, increasing the separability of features and the consistency of remote sensing mapping products for cropland [55].
Our study highlights the importance of a consistent definition of cropland and the effect of spatial resolution in producing accurate and consistent datasets, as well as the necessity of correction of global maps at local scale and the effect of parcel and land management practice on accurate cropland mapping.
4.4.Uncertainties of works and implications for future studies
Differences in definitions of cropland lead to inconsistency among remote-sensing mapping products, even after reclassification into cropland thematic maps.However,this inaccuracy caused by different classification schemes is unavoidable before the widely acceptable agreement is reached.Secondly, cropland area calculation by pixel counting is affected by mixing of cropland and other land cover types in a single pixel.Small parcels that blend with natural vegetation increase the difficulty of accurate classification, resulting in greater variation and less consistency in these areas.Although the 10-m data contain fewer mixed image elements than 30-m data, they still cannot be completely avoided in the mapping process, especially in southern or mountainous regions.Mixed categorization of cropland and grassland and forest land,which is common in southern China,usually leads to overestimation of cropland area.In contrast, the omission of cropland in the Qinghai-Xizang Plateau region leads to underestimation of area[56].Design-based inference [57], which has been widely used to adjust for errors in remote sensing, may improve area estimation and promote to the wall-to-wall mapping.The year-long compositing of DW,performed to allow comparison with the other datasets,may introduce errors in near-real-time datasets such as the overestimation of cultivated land in the Inner Mongolia region (Fig.2C).To demonstrate the stability of the method of mode compositing method for the near real-time datasets, we also changed to other data compositing methods and compared them with the statistical data and found that the performance of DW annual compositing data remained stable, suggesting that MODE compositing method was reasonable.Since comparisons in this study were made only for the common time window within the year of 2020, long time-series cropland maps are valuable for agricultural management, although the dynamic updating of samples on an interannual basis and retrospective mapping of 10-m data are laborious.Future attention should be paid to the assessment of the accuracy and consistency of time-series cropland maps based on state-ofthe art algorithms such as change detection method [58].
The accuracy of the statistics used in this study may be affected by the third national land survey in China starting at the end of 2019 and differences in the reliability of statistical data at various levels of administrative units.The latest available statistics may be out of date compared to the real situation in 2020.Liu et al.[59]also pointed out that there are differences in the reliability of statistical data at different administrative levels.Given that the overall accuracy of the six arable land datasets based on ground-truth points was, in fact, higher on the national scale, there may have been errors in the validation of the provincial scale.But comparison with official statistics is still a widely used method in addition to cross-validation for assessing the accuracy of remote-sensed datasets.
Despite these uncertainties,the prospect and use of 10-m stateof-the-art products are promising for their application in retrieving details of patterns and dynamics in surface processes.Existing 30-m remote sensing data is becoming increasingly stable and abundant, further contributing to the development of arable land mapping[60].Although our study provides a primary reference for the performance of existing cropland maps in China for the base year of 2020, it remains to be seen which cropland product provides the least error in characterizing cropland dynamics in time series analysis,especially to meet the demand of continuous land change monitoring.Open-source validation samples and the emerging paradigm of citizen science sample collection offer new avenues for more comprehensive and timely assessment and comparison of multiple arable land products [61].Our previous studies have confirmed that thematic cropland datasets perform better than full-element LULC products [33].We recommend that future efforts be made to improve the performance of the algorithms for the regions indicated above, as well as in the development of mapping agricultural management or tillage practice measures in areas with relatively stable cropland extent, such as crop types[62], cropland abandonment [63], and cover crops [64].
5.Conclusions
Accurately mapping cropland extent and area is crucial for effective agricultural management and development.This study provides crucial insights into the accuracy and consistency of six state-of-the-art cropland datasets in China.Through a crossresolution investigation,we assessed the consistency of these datasets and evaluated their accuracy based on extensive field samples.The pairwise consistencies of Chinese cropland area estimated by six remote-sensing-derived mapping products ranged from 57%to 96%.All products overestimated cropland area relative to census statistics, with coarser-resolution datasets displaying higher overestimation.WC yielded the highest fitness in comparison to the statistical area by province and DW performed worst owing to huge commission errors.Spatial disagreement ranged from 27%to 38%.Individual sample-based validation highlighted the superior performance of the 10-m WC dataset.Datasets with 10-m resolution captured more spatial detail than 30-m datasets.Spatial consistency was negatively associated with cropland fragmentation.Regions with higher accuracy, suitable climatic conditions,and well-developed agricultural management practices showed higher consistency.Continuous improvements in accurately mapping national cropland are needed, with particular attention to addressing spatial inconsistency and accounting for regional natural conditions and agricultural management practices.
CRediT authorship contribution statement
Yifeng Cui:Conceptualization,Methodology, Validation,Visualization, Writing – original draft.Ronggao Liu:Conceptualization,Supervision, Funding acquisition.Jinwei Dong:Conceptualization,Methodology, Writing – review & editing, Supervision, Funding acquisition.
Declaration of competing interest
The authors declare that they have no known competing financial interests or personal relationships that could have appeared to influence the work reported in this paper.
Acknowledgments
This work was supported by the National Natural Science Foundation of China (72221002, 42271375), the Strategic Priority Research Program (XDA28060100), and the Informatization Plan Project (CAS-WX2021PY-0109) of the Chinese Academy of Sciences.We thank for the producers of six cropland maps and the irrigation maps from Dr.Chao Zhang used in the study as well as the WTMS online services from Google Inc.for our work.We are grateful to Dr.James C.Nelson (Kansas State University) and the anonymous reviewers for their valuable comments and suggestions.
Appendix A.Supplementary data
Supplementary data for this article can be found online at https://doi.org/10.1016/j.cj.2023.11.011.
- The Crop Journal的其它文章
- Corrigendum to ‘‘GmTOC1b negatively regulates resistance to Soybean mosaic virus”.[Crop J.11 (2023) 1762–1773]
- Wetting alternating with partial drying during grain filling increases lysine biosynthesis in inferior rice grain
- OsDA1 positively regulates grain width in rice
- A polygalacturonase gene OsPG1 modulates water homeostasis in rice
- The ABA synthesis enzyme allele OsNCED2T promotes dryland adaptation in upland rice
- Trehalose: A sugar molecule involved in temperature stress management in plants