
Reconstructing in vivo spatially offset Raman spectroscopy of human skin tissue using a GPU-accelerated Monte Carlo platform
2023-12-02 09:29:36YunHeZhang張?jiān)弃QHuanZhengZhu朱桓正YongJiangDong董泳江JiaZeng曾佳
Chinese Physics B 2023年11期
關(guān)鍵詞:思源
Yun-He Zhang(張?jiān)弃Q), Huan-Zheng Zhu(朱桓正), Yong-Jiang Dong(董泳江), Jia Zeng(曾佳),?,
Xin-Peng Han(韓新鵬)3, Ivan A.Bratchenko4, Fu-Rong Zhang(張富榮)1, Si-Yuan Xu(許思源)1, and Shuang Wang(王爽)1,?
1Institute of Photonics and Photon-Technology,Northwest University,Xi’an,Shaanxi 710127,China
2Huawei Technologies Co.,Ltd,Shenzhen,Guangdong 518129,China
3Cardiopulmonary Disease Department,Xi’an International Medical Center Hospital,Xi’an 710100,China
4Laser and Biotechnical Systems Department,Samara National Research University,Samara 443086,Russia
Keywords: Monte Carlo simulation,tissue optical model,spatially offset Raman spectroscopy
1.Introduction
One novel Raman spectroscopy technique, spatially offset Raman spectroscopy(SORS),can avoid interference from the fluorescent background of surface materials and noninvasively obtain deep spectral information under materials with high Raman activity or high fluorescence.[1,2]There are several geometries in which SORS can be deployed,for example, ring spot laser illumination and Raman signal collection or a ring-shaped illumination scheme or collection.[3]Inverse SORS allows some flexibility in changing the spatial offset(?s)by delivering the laser beam in the shape of a ring and collecting the Raman photons at the center of the probe.[4,5]It is particularly suited to medical applications because the laser radiation is spread over an extended area,permitting the delivery of a higher laser power to the target in situations where laser intensities are constrained,for example due to laser safety considerations inin vivoapplications.[3]However,the re-emitted Raman photons will be altered duringin vivomeasurements by the absorption and scattering effect of the heterogeneous tissue structure and biochemical constituents.Therefore, it is essential to have an accurate illustration of the properties of excitation photon propagation and the Raman photon escape process to achieve a theoretical understanding and guidance for future biomedical applications of inverse SORS.
Monte Carlo(MC)methods are considered to be the gold standard for modeling light propagation in complex stochastic media such as biological tissues.[6–11]Recently, the simulation speed and accuracy of MC modeling have been greatly enhanced by techniques such as parallelization of graphics processing units (GPUs) and distributed computing,[12,13]which provides rigorous and reliable solutions for explaining photon–tissue interactions.Meanwhile,the primary question for inverse SORS applications, especially for developing optical fiber-based systems, is to elucidate the relationship between spectral sensing depth and the spatial offset(?s).Karthiket al.developed a MC model that enabled the simulation of arbitrary source–detector fiber geometries,fiber properties and the recording of time-resolved information about excitation and fluorescence light from a fluorophore in a semiinfinite medium.[14]Kelleret al.[15]used the multilayer fluorescence MC code to investigate the effect of tissue and probe geometry on SORS measurements and thus developed application strategies for surgical margin assessment of breast tumors.[16,17]Wilsonet al.adapted the MCML model to determine the optimum detection geometry of the bone Raman signal, and demonstrated how the carbonate/phosphate ratio was distorted by the elastic scattering effect of the overlying tissue layer.[18]Moscaet al.elaborated SORS, detecting the depth of any particular spatial offset when analyzing turbid samples.[19]However, none of the above-mentioned work interpreted inhomogeneous Raman scattering in turbid biological media duringin vivoinverse SORS measurements.
In this study, we attempt to solve this problem by simulating thein vivoinverse SORS measurement of normal human skin in the near infrared (NIR) wavelength range.An eight-layer optical model of the skin was developed using the transmission parameters from recent publications.[20–22]An open-source platform,Monte Carlo extensions(MCX),[23]was adapted to study 785 nm excitation photon distribution with an inverse spatially shifted annular beam.The excitation photons were converted to emission photons by an inverse distribution method (IDM) based on excitation flux to obtain simulations with spatial offsets ?sof 1 mm, 2 mm, 3 mm,and 5 mm.To improve the simulation accuracy, the intrinsic spectral properties of each skin layer were measured from separated tissue sections by a continuous linear scanning method.The reconstructed skin Raman spectra with different spatial offsets were compared within vivoexperiments to verify the feasibility of the model.
2.Materials and methods
2.1. In vivo measurement of Raman spectrum of human skin
A home-made inverse SORS system was established to measure skin spectral informationin vivoas shown in Fig.1.The excitation light from a 785 nm semiconductor laser (MDL-III-785-lock, Changchun New Industry) is collimated by a fiber collimator (F260APC-780, Thorlabs) and then passed through a 785 nm band-pass filter(LD01-785/10-25,Semrock)to avoid the spectral sideband component of the laser or stray light entering the excitation light path.The excitation beam is converted into a ring-shaped beam by an axicon lens(AX2510-B,Thorlabs),and the radius of the annular beam(?s)is controlled by changing the distance between the axicon lens and sample continuously.Two quartz glass planoconvex lenses (GCL-010820/GCL-010811, Daheng Photoelectric) are used for spectral acquisition.A long-pass filter(LP02-785RU-25, Semrock) is placed between them inside to avoid the influence of stray light.An optical fiber bundle(RTS105-19-3-VIS-NIR, Oceanhood) transmits the obtained spectral photons to a spectrometer(LS-785,Teledyne Princeton Instruments),and the spectral signal is detected by a back photosensitive CCD(PIX400BR-SF-Q-F-A,Teledyne Princeton Instruments) camera.The spectral wavelength and response of the system are calibrated using a Ne/Ar lamp(IntelliCal, Teledyne Princeton Instruments).The integration time for each measurement was 3 s and the excitation power was approximately 200 mW measured at the skin surface.All acquired Raman spectra were processed using home-made software (NWUSA), including band range selection, cosmic line removal, ninth-order polynomial fitting of the spectral background and fifth-order Savitzky–Golay smoothing.[24]

Fig.1.Schematic diagram of the optical path of the inverse spatial offset Raman detection system.
2.2. Ex vivo measurements of Raman spectra from excised human skin tissue sections
Ex vivoRaman spectra were measured with a confocal Raman microscope(Alpha500R,WITec GmbH).[25–27]Its major components include a 785 nm semiconductor laser for the spectral excitation,a microscope combined with a 63×objective (NA=1.25, WPlan-Apochromat, Zeiss), and a spectrometer(UHTS300,WITec GmbH).A multi-axis piezo scanning stage (2 nm scanning accuracy, P-524 K081, PI GmbH,Karlsruhe) and an additional motorized stage were used for precise spectral scanning.
For the experiment, a total of 20 normal skin samples were obtained from Xi’an International Medical Center Hospital, Xi’an, Shaanxi, China.Based on the protocol for preparing frozen tissue sections, consecutive longitudinal sections were prepared as 10μm thick slices and placed on gold-coated glass substrates (BioGold?63479-AS, Electron Microscopy Sciences)forex vivospectral measurements.The frozen sections were stored in an acetone cooling bath at-80?C until use,and thawed for 30 min prior to spectroscopic analysis or further histological processing.
For the measurements,the spectral signals from four skin layers(stratum corneum,epidermis,dermis and subcutaneous fat)were collected over the range 800 cm-1–1800 cm-1.As shown in Fig.2, a continuous linear point-by-point scanning method was adopted to acquire the tissue spectral information from about 200 different depth positions along thezaxis:10 spectra were acquired in the stratum corneum, 40 in the epidermis, 70 in the dermis and 80 in the subcutaneous fat.Meanwhile, the same scanning method was repeated at least 10 times for each examined skin section along thex-axis, as shown in Fig.2.After spectral preprocessing,aK-means clustering analysis (KCA) algorithm was utilized to address the general spectral features in each skin layer.
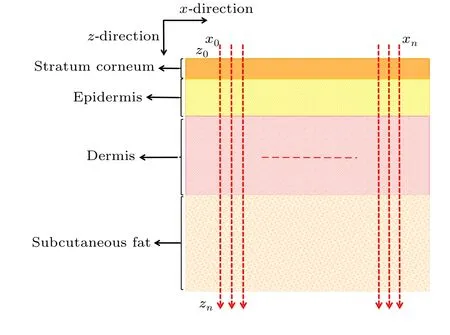
Fig.2.Schematic diagram of the ex vivo Raman spectral investigation plan.
2.3.Optical model of normal human skin
Based on our previous works,[28,29]various appendages of skin tissue, such as hair follicles, sweat glands and sebaceous glands,were ignored for simplicity without loss of generality during the simulations.An eight-layered skin optical model in the NIR wavelength range was developed with transport parameters compiled from Shimojoet al.[20]and Salomatinaet al.[22]Table 1 outlines our eight-layer model,including thickness(d),refractive index(n)and optical transport parameters (absorption coefficientμa, scattering coefficientμs,scattering anisotropyg) at 914 nm for each skin layer.The stratum corneum is a thin structure, so in the simulation process we assumed that the optical characteristic parameters of stratum corneum and epidermis are the same.The total thickness of the skin model is 4 mm, while the thickness of each layer is based on published anatomical literature.[20,28,30]Skin Raman spectra from 800 cm-1to 1800 cm-1, corresponding to the wavelength range from 838 nm to 914 nm by 785 nm excitation,are reconstructed by a MC method to investigate the contribution of intrinsic Raman signals originated from different skin layers and the distortion due to tissue reabsorption and scattering duringin vivomeasurements.
The refractive index of the ambient medium above the tissue model is 1.0(air),and that of the ambient medium below the eight tissue layers is 1.37,[31]which is assumed to be muscle.The refractive indices of epidermis, dermis and subcutaneous fat were fixed at 1.34, 1.39, and 1.44, respectively.[32]The anisotropy factorgof all bloodless skin layers was assumed to be 0.9 within the wavenumber range of the entire study.[33]We also assumed that blood has an index of refraction of 1.33, which is equivalent to water.For epidermis and bloodless dermis, transport parameters from 400 nm to 1100 nm were provided by Shimojoet al.[20]The upper blood plexus consists of capillaries scattered within the dermal tissue.Therefore,it is modeled as a uniform layer of 30%blood and 70%skin tissue.The optical parameters(μa,μs,g,n)of the upper blood plexus were calculated by adding the fractions contributed by the two components,which could be expressed by the following matrix formula:[34–36]
wheref1andf2are the respective percentages of a single component.For example, in the tissue model, the upper blood plexus consists of 30%blood(f1=0.3)and 70%dermal tissue (f2= 0.7).So the refractive index of the upper blood plexus was estimated asn=(1.33×0.3)+(1.39×0.7).The lower blood plexus was modeled as consisting of 10% blood and 90% dermis.To simulate the Raman photon escape process,the optical parameters of other wavelengths(higher than 785 nm)were derived in a similar manner,as shown in Table 1.
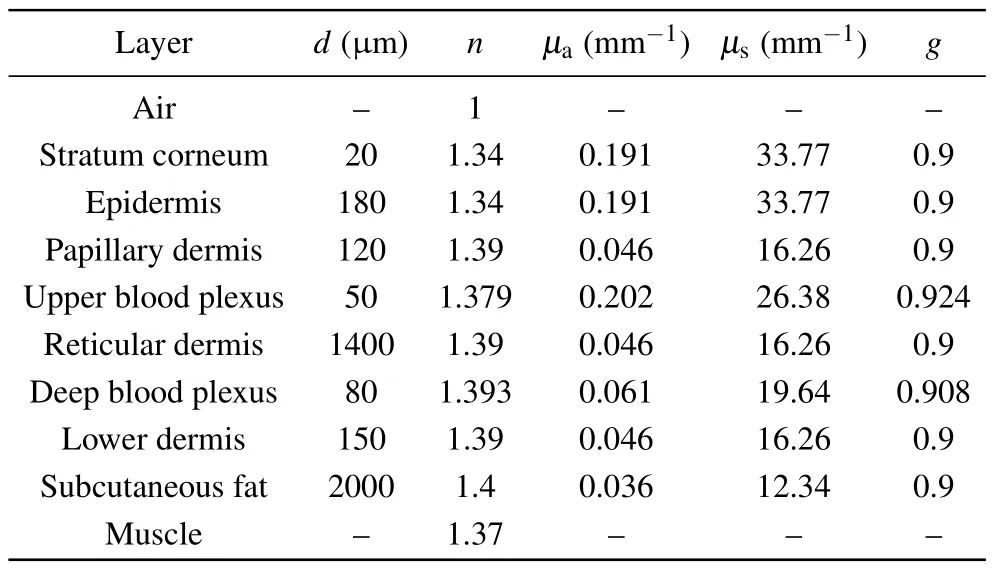
Table 1.The transport parameters (μa, μs, g, n) of the eight-layer skinoptical model at 914 nm.
2.4.Monte Carlo simulation
The MC model was developed atop the open-source MCX base.[34,37]All simulations were performed in wavelength (nm), and the results were presented in wavenumber(cm-1)to maintain consistency with the experimental results.To provide a detailed description of the simulated Raman spectra,an interpolation was performed to obtain the same number of data points as the measuredex vivoRaman spectra.The simulation process consists of the following steps:
(i) Addressing excitation photon distribution within the tissue model.After setting the basic parameters in the MCX platform,such as position and direction of excitation light,optical properties of excitation light, etc., many parallel threads are initiated to simulate photon migration and generate a photon flux map across the entire tissue volume.A threedimensional (3D) distribution of excitation light can be efficiently calculated for a 785 nm annular excitation source with a radius(?s)of 1 mm,2 mm,3 mm or 5 mm.
(ii) Calculating the number of photons collected on the tissue surface,Ndetect(λ,z).Under the condition of ?sof 1 mm, 2 mm, 3 mm or 5 mm, the transport characteristics of photons of specific wavelength emitted by isotropic point light sources at different depth positions (z) were trailed for determining the number of detected photons on the tissue surfaceNdetect(λ,z).In the specific simulation process, 106Raman photons from nine separate wavelengths (838 nm, 845 nm,855 nm, 865 nm, 880 nm, 890 nm, 902 nm, 910 nm, and 913 nm)were traced from the isotropic source corresponding to 800 cm-1–1800 cm-1by 785 nm excitation.
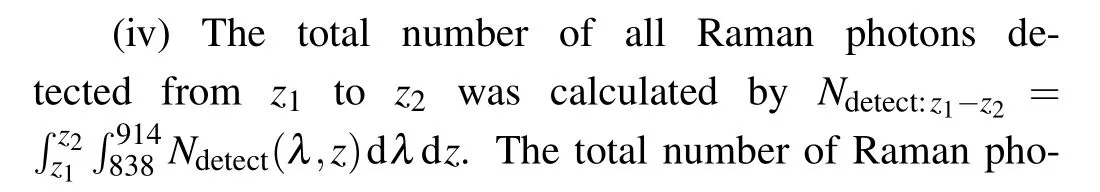
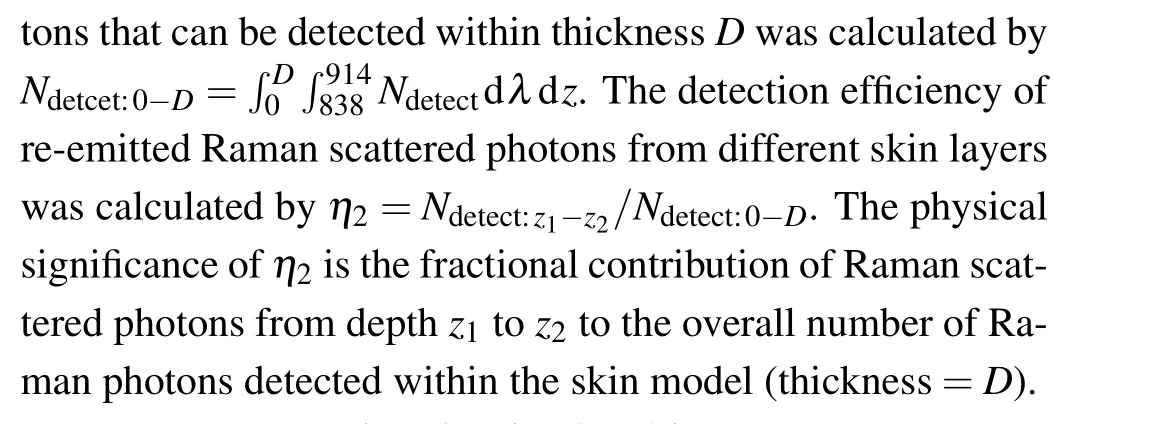
(iii) Calculating the spectral detection efficiency of different layers of skin tissue,η1(λ).After obtainingNdetect(λ,z), the number of photons of wavelengthλdetected by each layer of tissue (depth fromz1toz2) is calculated byN(λ)detect:z1-z2=z2z1Ndetect(λ,z)dz.The number of photons in each simulated wavelength from the skin model with specific tissue thickness (D) is calculated byN(λ)detect:0-D=D0Ndetect(λ,z)dz.The spectral detection efficiency from different skin layers is calculated byη1(λ)=N(λ)detect:z1-z2/N(λ)detect:0-D.This indicates the spectral contribution or fractional contribution of the detected Raman photons from depthz1toz2to the overall detected photons on the tissue surface at a specific wavelength.
(v) Reconstructing the simulated inverse SORS spectra,Rreconstuct.Thein vivoRaman detection spectral data under different spatial offset conditions can be reconstructed by convolving the intrinsic Raman spectrum of the tissueβ(λ,z)with the detection efficiency,as shown in the following equation:
whereDis the total thickness of the model skin;β(λ,z)is the intrinsic Raman spectrum of the tissue measured by the confocal Raman microscope system.
3.Results and discussion
Monte Carlo simulations with 785 nm excitation light and nine different discrete wavelengths/wavenumbers were used to simulate the transmission behavior of Raman excitation and scattered photons at different wavelengths emitted from a ring light source.During the simulation,the values of spatial offset(?s) were defined for recording the number of spilled photons from the tissue surface, which is the number of surfacedetected photonsNdetect(λ,z).The compiled MCX program was executed on an NVIDIA MCX RTX4000 graphics card on a Lenovo P700 workstation, and 1 million photons were emitted in each simulation.
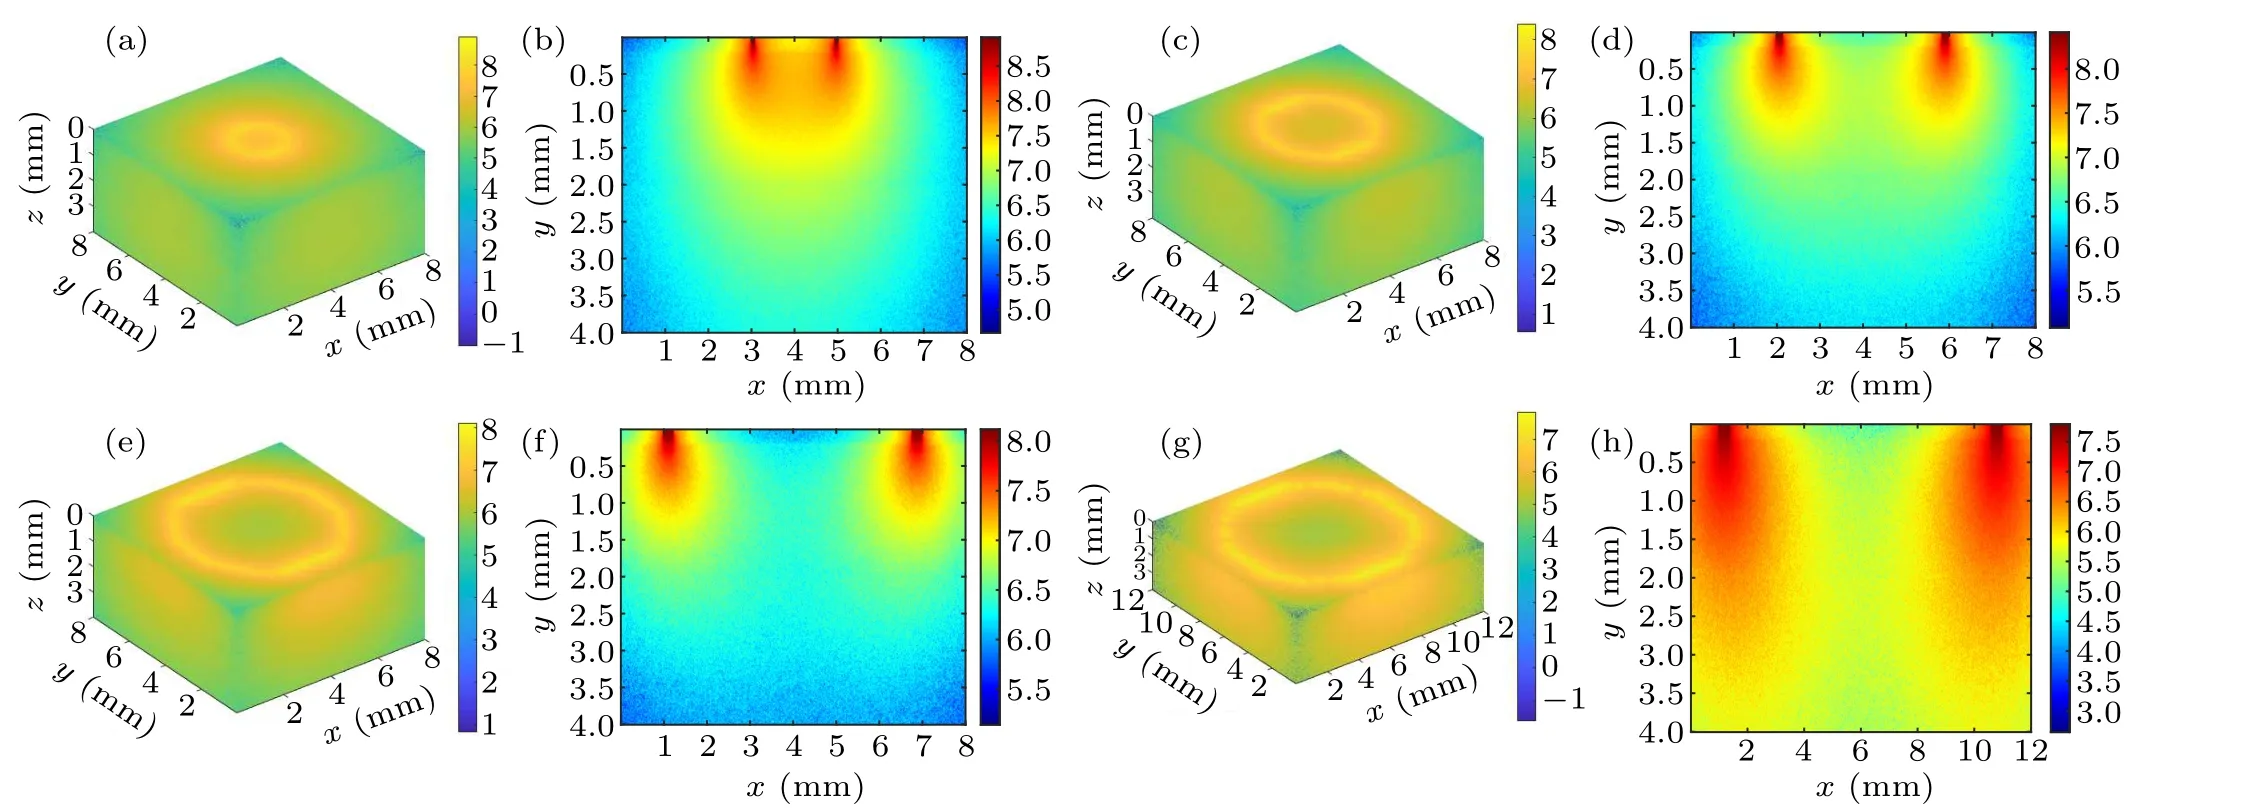
Fig.3.Schematic diagram of the intra-tissue transport behavior of excitation photons during inverse spatial offset Raman spectroscopy detection: (a)and(b)?s=1 mm,(c)and(d)?s=2 mm,(e)and(f)?s=3 mm,(g)and(h)?s=5 mm.
Figure 3 shows a schematic diagram of the photon transport behavior presented by a circular excitation light spot on the tissue surface with different spatial offsets (radius of the circular spot)at 1 mm,2 mm,3 mm,and 5 mm.Figures 3(a),3(c), 3(e), and 3(g) show the 3D excitation light distribution and figures 3(b), 3(d), 3(f), and 3(h) show the corresponding cross-section diagrams.It can be observed from the crosssection diagrams that a small value for the inverse SORS parameter (e.g., Fig.3(a), ?s=1 mm) tends to cause a strong and concentrated distribution area of excitation photon overlap, illustrated by the orange area in the center of the ring excitation spot.However, when the spatial offset increases,the distribution area of excitation photons gradually expands(pseudocolor changed from light yellow to light green)resulting in a shrunken overlapped area(pseudocolor changed from orange to light yellow or even green)and an enhanced area of coverage of excitation photons.The observed simulation phenomena are more obvious in the 3D images of Figs.3(b),3(d),3(f),and 3(h),which means that the excitation photons diffuse in the tissue with a larger volume(e.g.,Fig.3(h),?s=5 mm)as ?sincreases.
Figure 4 shows a schematic diagram of excitation and detection of photon transmission patterns for inverse SORS detection under different ?s.When the spatial offset is small(?s=1 mm), as shown in Fig.4(a), the excitation region indicated by the red arrow is more concentrated and the Raman photons at the collection end(indicated by the dark red arrow)are mainly from the superficial skin layer instead of the deep layer.Meanwhile, due to the ring-like distribution of excitation photons, the spectral scattering region appears as a kind of ‘focused’ pattern or effect to re-emit Raman photons.As shown in Figs.4(b) and 4(c), by increasing of spatial offset,the number of excitation photons distributed in the upper layer gradually decreases.As shown in Fig.4(d), when the spatial offset increases to 5 mm,the number of excitation photons distributed in the bottom layer is relatively higher than that in the upper layer,indicating greater in-elastic scattering and spectral detection depth.

Fig.4.Schematic diagrams of the excitation and detection photon transmission patterns for inverse spatially shifted Raman spectroscopic detection: (a)?s=1 mm, (b)?s=2 mm, (c)?s=3 mm, (d)?s=5 mm.The dark red arrow indicates the excitation side and the red arrow indicates the collection side.
Figure 5 shows the number of detected photons from different tissue depths with specific wavelengths for ?s=1 mm,2 mm, 3 mm or 5 mm.It is clear that the number of detected photons gradually decreases as the spatial offset increases.This is because when the laser irradiation area is offset from the Raman spectral collection area,the laser intensity inside the sample will become uniformly distributed along the propagation path due to multiple tissue scattering and diffusion.As shown in Fig.5, when the spatial offset increases,Raman photons re-emitted from deep skin layers will be reabsorbed and scattered by the surface tissues, resulting in a smaller number of photons being detected at the skin surface.Generally, the number of escaped photons increases as tissue depth increases in the superficial layers(stratum corneum and epidermis),because reabsorption and scattering of Raman photons near the skin surface have little effect on the Raman escape behavior.As shown in Fig.5(a), when ?s=1 mm,deep scattered Raman photons have more difficulties when escaping from the tissue surface, so the number of photons detected decreases as the tissue thickness increases.However,the number of Raman photons escaping from the subcutaneous fat layer (depth=2.4 mm) increased slightly, which may be caused by the change in refractive index between different tissue layers.[38]In particular, the subcutaneous fat layer has a higher refractive index than the layers above and below, and some Raman photons generated inside this layer encounter total internal reflection which completely bounces these photons back.This phenomenon is also consistent with our previous point-excitedin vivoRaman spectral simulations.[38]As the spatial offset increases,the detectedin vivoRaman spectral information comes more from the deep skin layer.In Fig.5(a),only a small number of the photons can penetrate the deep subcutaneous fat,and the minimum number of detected or escaped Raman photons from subcutaneous fat is only 12% of that from the stratum corneum layer.When ?sincreased to 3 mm in Fig.5(c), the minimum number of Raman photons detected from subcutaneous fat reached 76%of that from the stratum corneum layer.Moreover, as shown in Fig.5(d), the number Raman photons detected from subcutaneous fat and stratum corneum layers is almost the same as or even slightly more from the fat layer.This phenomenon could be explained by the fact that as the spatial offset increases more excitation light is transmitted to the fat layer with lipid macromolecules,which is more prone to generate Raman scattering than other layers.
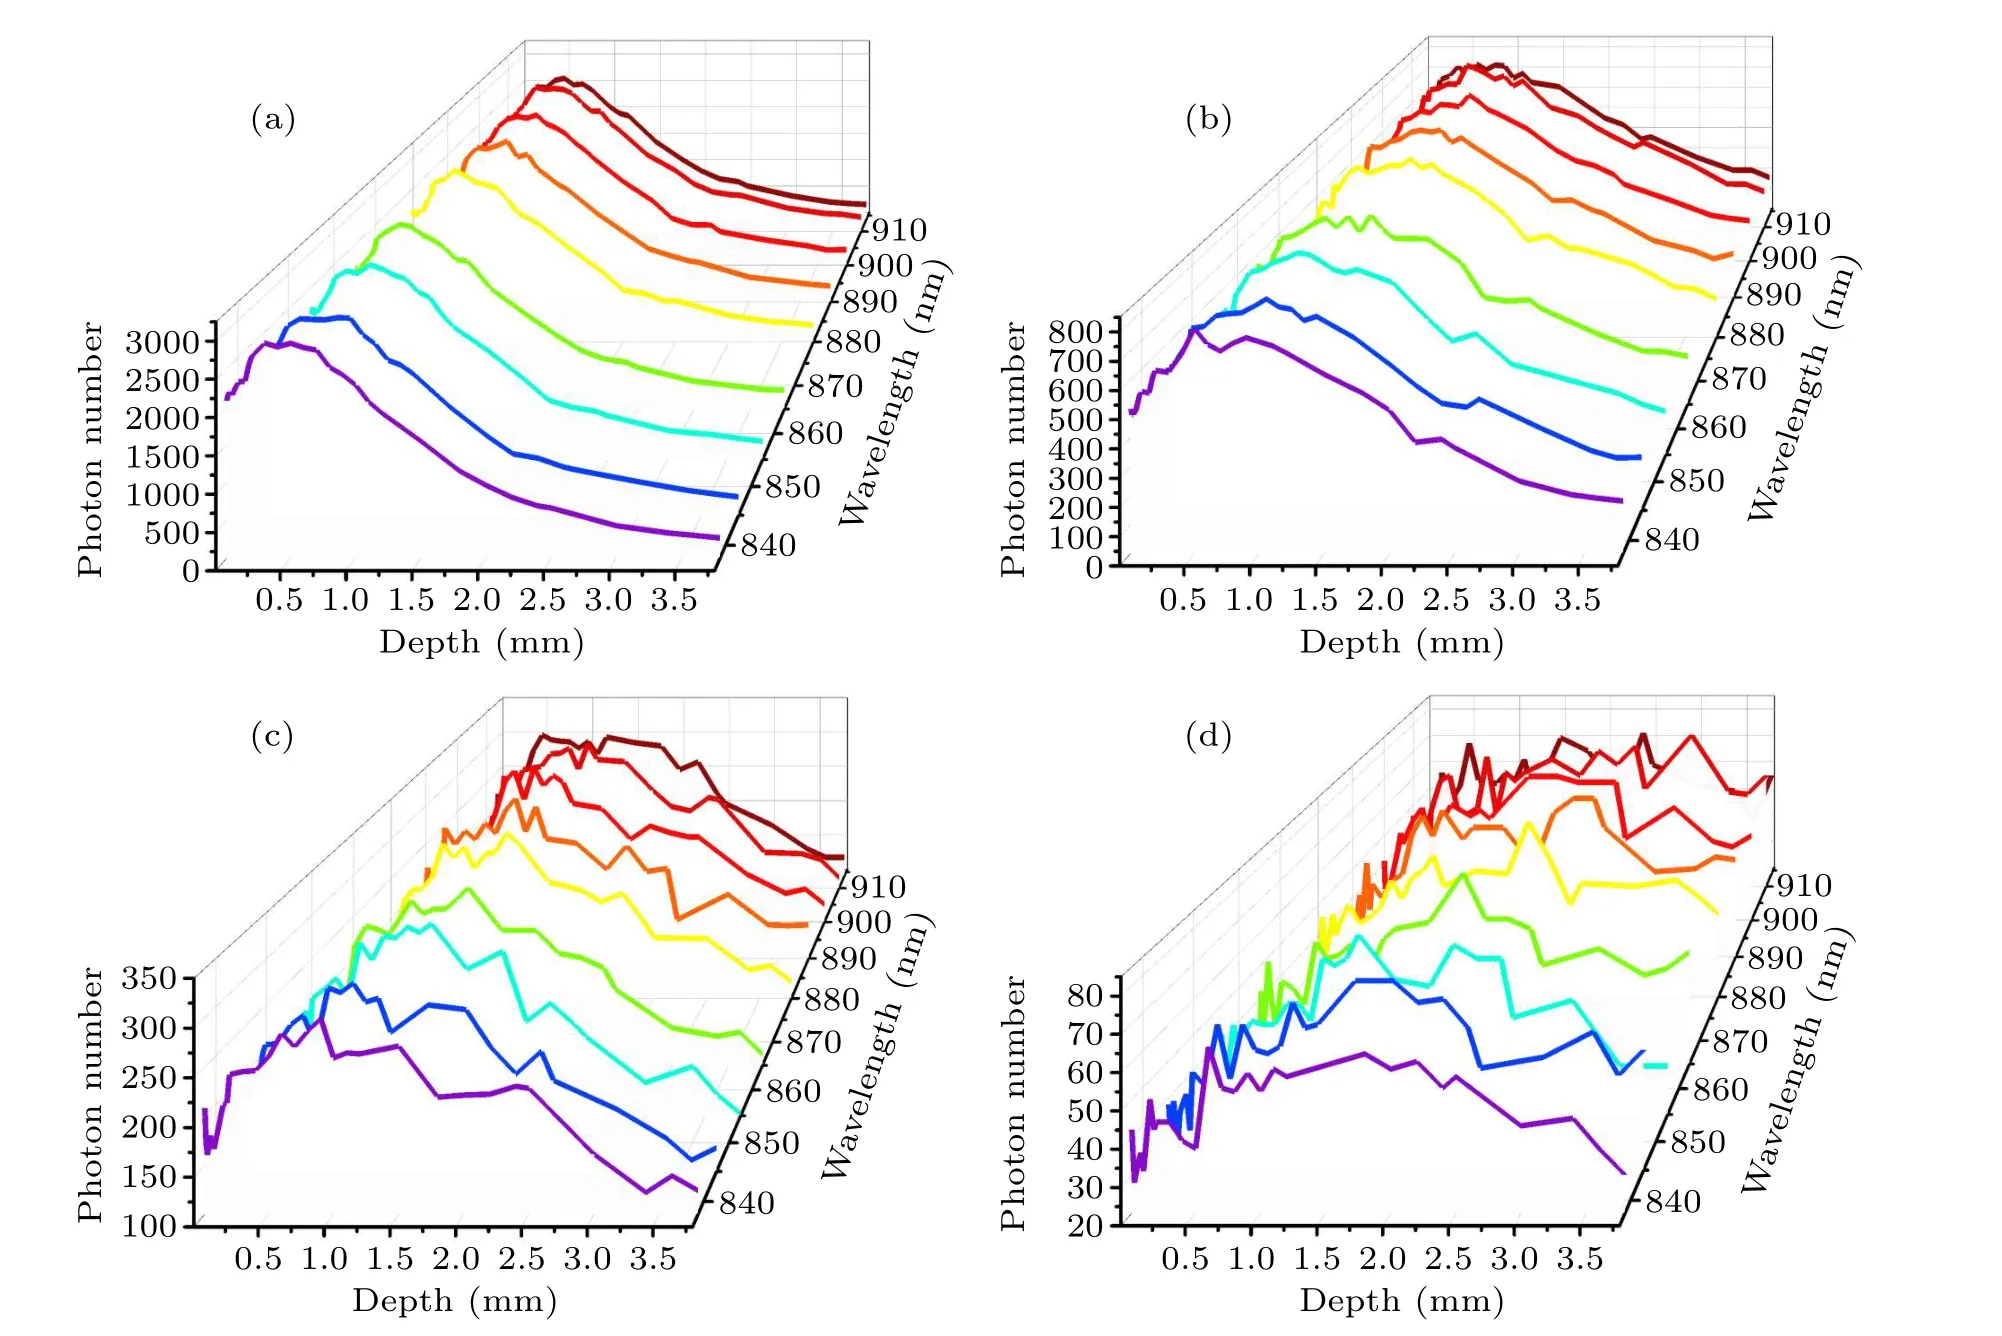
Fig.5.Number of photons detected, plotted as a function of depth within the tissue at specific wavelengths: (a) ?s=1 mm, (b) ?s=2 mm,(c)?s=3 mm,(d)?s=5 mm.
To understand how the intrinsic Raman spectrum is distorted by tissue reabsorption and scattering,we calculated the Raman detection efficiencyη1(λ,z)by the method described in Subsection 2.4.The Raman detection efficiencyη1(λ,z)is the probability of obtaining a Raman signal from a specific layer at each simulated wavelength.Since it is impossible to obtain the intrinsic Raman spectra of different layers in the subdivided dermis through experiments,the final Raman spectra of the dermis are obtained by calculating and summing the detection efficiency of the five layers obtained previously.The Raman detection efficiencies of different skin layers at specific spatial offsets are shown in Fig.6.It can be seen that for ?s=1 mm,2 mm or 3 mm(Figs.6(a)–6(c),respectively)the detection efficiency of the dermis layer is the highest,followed by the subcutaneous fat layer, the epidermis and the stratum corneum, which is consistent with the previous point Raman excitation simulation.[38]When ?sincreased to 5 mm,as shown in Fig.6(d), the detection efficiency of the subcutaneous fat layer is enhanced; this is due to the fact that the excitation photons were transported to deeper skin layers and exhibited a greater probability of inelastic scattering.
Figure 7 compares the detection efficiency for different skin layers at ?s=1 mm,2 mm,3 mm,and 5 mm.For the stratum corneum and epidermis(Figs.7(a)and 7(b))the detection efficiency gradually decreases as the spatial offset increases because the detection depth gradually increases with increasing spatial offset.When the scattered Raman photons are generated from deeper skin layers they have a higher chance of being rescattered by the superficial tissue structure and constituents, thus exhibiting a large amount of lateral migration before escaping from the skin surface to be observed.Meanwhile, compared with the dermis and subcutaneous fat layer,the thinner superficial skin layer of stratum corneum and epidermis exhibited a lower probability of inelastic scattering,resulting in a reduced number of detected Raman photons and a lower detection efficiency.As shown in Fig.7(c), the detection efficiency for dermis is highest when the spatial offset is 2 mm.More spectral information from the deep subcutaneous fat layer could be detected as the spatial offset increases to 5 mm,as shown in Fig.7(d).
The detection efficiency of scattered Raman photons for each skin layer was calculated and is displayed in Fig.8,which shows the difficulty of detecting the spectral information from each skin layer at different spatial offsets.When the spatial offset increases, the detection efficiency of superficial layers(stratum corneum and epidermis) gradually decreases while the detection efficiency of deep tissue structures (dermis and subcutaneous fat) gradually increases.Compared with point excitation (?s= 0 mm), The detection efficiency of the fat layer is highest among all skin layers, attributed to the fact that more excitation light is transmitted to the fat layer when using 5 mm diameter ring-shaped excitation(?s=5 mm);this improves the probability of the Raman scattering effect occurring in the fat layer.Meanwhile,although a small number of excitation photons will propagate into this layer, the main biochemical constituent of subcutaneous fat is lipid biomacromolecules,which exhibit greater Raman scattering probability and spatially offset Raman spectroscopic detection,reflecting that the inverse spatial offset method is more likely to detect deep spectral information.The highest detection efficiency for the dermis layer was found at ?s=2 mm,which implies that the optimal spatial offset forin vivoanalysis of the Raman spectral properties of the dermis layer should be around 2 mm,similar to the above observations.
The intrinsic Raman coefficient (β(λ,z)), representing the true spectral nature of skin tissue, was measured by the confocal micro-Raman system and the results are shown in Fig.9.A multi-axis piezoelectric scanning platform with a scanning accuracy of 1 nm–2 nm was used to acquire the tissue spectral information from about 200 different depth positions along thez-axis using a line-scan method.Considering the large number of spectra from this experiment and the non-uniform shape of the edges of the skin tissue layers, the KCA algorithm was adopted to categorize the acquired spectra to obtain more accurateex vivospectral data for each skin tissue layer, as shown in Fig.8.The important spectral features in the range of 800 cm-1–1800 cm-1are the main vibrational bands around 855 cm-1(collagen),[39]935 cm-1[C–C stretching mode of proline and valine and protein backbone (α-helix conformation)/glycogen (protein assignment)],[40]1080 cm-1(collagen),[41]1265 cm-1(amide III of collagen),[42]1300 cm-1(CH2 twisting(lipids),[43]1445 cm-1[collagen (protein assignment); phospholipids(lipid assignment)],[40,44]1655 cm-1[(C–C)amide I][45]and 1745 cm-1[phospholipids(lipid assignment)].[40,44]It can be observed that the intensity of the Raman signal gradually increases from the stratum corneum to the subcutaneous fat layer.Since the stratum corneum is thinner, the measured signal is more spread out and the signal-to-noise ratio is relatively low.It should be noted that although there are multiple dermal layers in the model skin (Table 1), the dermal spectrum shown in Fig.6 was used for all dermis layers in the skin model.
In order to reconstruct thein vivoRaman spectrum using Eq.(2), the detection efficiency shown in Fig.6 was interpolated to obtain data points with the same wavenumber as thein vivospectrum shown in Fig.9.Figure 10 shows the reconstructed Raman spectra at different spatial offsets compared with thein vivoSORS measurements from the five volunteers.Table 2 shows the standard deviations between the reconstructed and experimental results in Fig.10.Table 2 shows that the standard deviation is the smallest at ?s=2 mm,and the reconstructed spectra in Fig.10(b) present the best agreement with thein vivoRaman spectra.Several major Raman peaks were reconstructed with MC simulations, around 855 cm-1, 1080 cm-1, 1100 cm-1, 1265 cm-1, 1450 cm-1,and 1650 cm-1, respectively, matched well with thein vivospectra.Referenced with Fig.8,the detection efficiency of the dermis is highest when ?s=2 mm, indicating that the dermis has the greatest influence on the simulation results, and the higher the detection efficiency of the dermis,the better the reconstructed results match with the experimental results.In Fig.10(d), the reconstructed andin vivoRaman spectra have a poor coincidence when ?sincreases to 5 mm,as can also be seen from Table 2.Although the greater spectral contribution from subcutaneous fat will be realized at ?s=5 mm,the deep re-emitted Raman photons will be reabsorbed and scattered during the escape process inside the tissue model,resulting in more deviations.
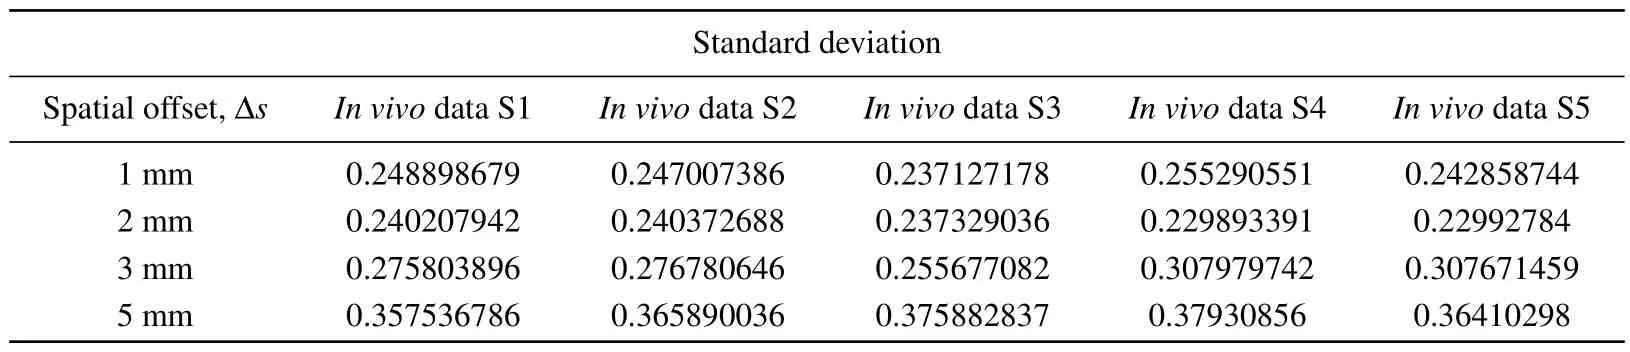
Table 2.Tissue reconstruction with in vivo experimental measurement of Raman spectral standard deviation(S,subject).
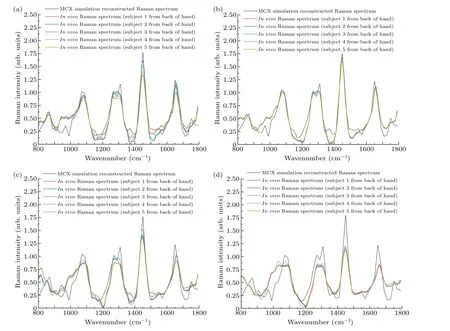
Fig.10.Comparison of skin Raman spectra reconstructed with MC simulations and in vivo Raman spectra of the skin tissues of five volunteers:(a)?s=1 mm,(b)?s=2 mm,(c)?s=3 mm,(d)?s=5 mm.
A GPU-accelerated MC model developed by the opensource MCX project[31]provides a well-established platform with flexible, broad physical parameters and proven capabilities to provide insight intoin vivobiophotonics measurements.The benefits of this parallelized Raman MC model for simulating full Raman spectra[46,47]have been validated using multilayered skin models.The established inverse SORS model intuitively explained 3D excitation light distribution maps with different spatial offsets.The simulation results showed that the spectral contribution from subcutaneous fat is very similar to or even higher than that of the superficial skin layer as?sincreased to 5 mm, which is consistent with the experimental observations and further confirms the feasibility of our model.Although the spectral information from subcutaneous fat could be detected with a big spatial offset value,the dermis layer still has the greatest influence on the skin Raman results.The closest match between constructed and measured spectra could be achieved by using a 2 mm spatial offset,and mostly originated from the dermis layer.
4.Conclusion
In summary,the properties ofin vivoinverse SORS were studied using an adaptive massively parallel MCX-based simulator.In the simulation,a multilayered skin tissue model was built based on the latest optical properties and parameters.For acquiring the intrinsic Raman spectra of separated skin layers,a point-by-point scanning method was adapted.The reconstructed Raman spectra were obtained by convolving the intrinsic Raman spectra with the detection efficiency at different spatial offsets (?s=1 mm, 2 mm, 3 mm, and 5 mm).The simulation results suggest that the Raman photons generated from deeper skin layers will be rescattered by the structures and constituents of superficial tissue,and they exhibited large lateral migration before escaping from the skin surface to be observed.Although the detection depth gradually increases with increasing spatial offset, the intrinsic Raman spectrum is distorted by the reabsorption and scattering due to the superficial tissue constituents,which causes a decreased spectral detection efficiency for the deep skin layers.The spectral contribution from subcutaneous fat is improved when ?sincreases to 5 mm, while tissue reabsorption and rescattering will introduce more deviations between experiments and modelled spectra.Meanwhile, the reconstructed spectra are in good agreement with the experimental results.The simulated results agree best with the experimental results when the spatial offset is 2 mm.
The results of this study demonstrate the utility of our modeling and experimental approaches.The accuracy of the simulation is supported by using tissue optical parameters for Asians,consistent with ourin vivomeasurement subjects.The acquired intrinsic Raman coefficient is close enough to the true spectral nature of skin tissue,which also contributes to the validation of our model.Moreover,the GPU-based MC modeling extends the computational capability and increases the simulation efficiency by a factor of nearly 100.However, the primary shortcoming of the current simulation is that only blood contents were added to multilayered tissue model; other inhomogeneous Raman scatters, such as melanin and collagen,were neglected.The reconstructed skin Raman spectra with different spatial offsets exhibited good agreement within vivomeasurements,demonstrating the utility of our model.
Acknowledgments
The authors wish to thank Dr Yu Shimojo, Osaka University,Suita,Japan for kindly providing the NIR skin optical parameters.
Project supported by the National Natural Science Foundation of China (Grant No.61911530695) and the Key Research and Development Project of Shaanxi Province, China(Grant No.2023-YBSF-671).
猜你喜歡
青年文學(xué)家(2023年8期)2023-06-14 07:56:30
作文小學(xué)高年級(jí)(2021年6期)2021-07-05 01:50:24
閱讀(快樂(lè)英語(yǔ)高年級(jí))(2019年8期)2019-09-10 07:22:44
快樂(lè)作文(1.2年級(jí))(2019年5期)2019-09-10 07:22:44
課程教育研究(2017年44期)2017-11-30 12:34:03
快樂(lè)作文·低年級(jí)(2017年4期)2017-06-06 17:46:50
健康女性(2016年11期)2017-02-14 13:22:31
校園英語(yǔ)·中旬(2016年8期)2016-07-09 08:52:03
——記4808工廠威海修船廠
中國(guó)修船(2016年6期)2016-06-23 10:04:05
教育與職業(yè)(2014年13期)2014-01-23 06:48:28

- Chinese Physics B的其它文章
- The application of quantum coherence as a resource
- Special breathing structures induced by bright solitons collision in a binary dipolar Bose–Einstein condensates
- Effect of short-term plasticity on working memory
- Directional-to-random transition of cell cluster migration
- Effect of mono-/divalent metal ions on the conductivity characteristics of DNA solutions transferring through a microfluidic channel
- Off-diagonal approach to the exact solution of quantum integrable systems