
Non-invasive optical characterization and estimation of Zn porosity in gas tungsten arc welding of Fe-Al joints using CR model and OES measurements
2023-11-19 13:32:44SaiSRIKARTinkuKUMARDegalaVenkataKIRANandReeteshKumarGANGWAR
Plasma Science and Technology 2023年11期
Sai SRIKAR,Tinku KUMAR,Degala Venkata KIRAN,* and Reetesh Kumar GANGWAR,*
1 Department of Physics &CAMOST,Indian Institute of Technology Tirupati,Yerpedu 517619,India
2 Department of Mechanical Engineering,Indian Institute of Technology Tirupati,Yerpedu 517619,India
Abstract In this study,we employed a non-invasive approach based on the collisional radiative(CR)model and optical emission spectroscopy(OES)measurements for the characterization of gas tungsten arc welding(GTAW) discharge and quantification of Zn-induced porosity during the GTAW process of Fe-Al joints.The OES measurements were recorded as a function of weld current,welding speed,and input waveform.The OES measurements revealed significant line emissions from Zn-I in 460-640 nm and Ar-I in 680-800 nm wavelength ranges in all experimental settings.The OES coupled CR model approach for Zn-I line emission enabled the simultaneous determination of both essential discharge parameters i.e.electron temperature and electron density.Further,these predictions were used to estimate the Zn-induced porosity using OES-actinometry on Zn-I emission lines using Ar as actinometer gas.The OES-actinometry results were in good agreement with porosity data derived from an independent approach,i.e.x-ray radiography images.The current study shows that OES-based techniques can provide an efficient route for real-time monitoring of weld quality and estimate porosity during the GTAW process of dissimilar metal joints.
Keywords: optical emission spectroscopy,collisional radiative model,actinometry,GTAW,Fe-Al joints,Zn vapor porosity,radiographic imaging
1.Introduction
Optical emission spectroscopy (OES) is a technique that records the intensity as a function of wavelength from a radiating source[1].By analyzing the recorded spectrum,one can probe the chemical composition and physical properties of the radiating source.One of the significant benefits of OES is that it is non-invasive,and the measurements are straightforward [2].Therefore,OES based approaches are being intensively used by the researchers.It is helpful in understanding the fundamental physics in driving the plasma and optimizing the plasma-mediated processing in a given application[3].However,OES measurements are often required to be coupled with suitable population-kinetic models to extract the essential parameters,viz.,electron temperature(Te) and electron density(ne) [3].
In recent years,the need for welding different or dissimilar materials has increased to enhance material strength and durability while decreasing material weight [4].The joining of various materials has been employed in various sectors,including the automobile,aerospace,nuclear power,and shipbuilding industries.However,creating a suitable joint between different metals can be challenging due to their distinct physical and chemical properties [5].One solution that has gained popularity is the use of Fe-Al weld joints,or hybrid material joints,which can reduce the overall weight of products while maintaining strength and durability.These joints can be produced using various welding processes,such as gas tungsten arc welding (GTAW) and gas metal arc welding [5-8].
Despite their potential benefits,the application of zincbased coatings on steel and the presence of surface impurities can contribute to a range of defects in the welding process[9].These defects must be monitored to assess the quality of the weld.Porosity defects,or the presence of pores in the weld,can be particularly problematic during the post-weld inspection.Porosity defects can weaken the strength and integrity of the weld joint.Therefore it is essential to understand and quantify the porosity defects to optimize the GTAW processes [10].
In this light,various approaches,such as adjusting welding parameters,using different filler materials,and improving material cleanliness,were investigated [11,12].Often,internal porosity is detected post-welding through x-ray-based techniques,such as radiographic testing and 3D computed tomography (CT) [13].These methods are timeconsuming and can increase the cost of welding.Further,numerical modeling approaches have been adopted by a few researchers to address the porosity in weldments.Computational fluid dynamic (CFD) analysis helps in understanding the characteristic flow of the weld pool and predicting the porosity in the welding processes [14,15].These numerical models are computationally expensive and are proposed for porosity due to keyhole in the laser welding but not for the porosities induced by different vapors like Zn vapor.The results of welding simulations are often validated with experimental tests,but these tests can have uncertainties that make it challenging to debug [10].Overall,the existing nondestructive testing methods or CFD-based models are not suitable for real-time monitoring and fast detection of defects during the welding operation.
In the present paper,we have employed the OES cum CR model based technique for the characterization of GTAW discharge and the quantification of Zn-induced porosity during the GTAW process of the Fe-Al joints.In this regard,the OES based methods can be very effective.Toropchin et al[12] used OES measurements to investigate the effect of arc temperature on weld pool behavior by conducting experiments with different currents,electrode-to-workpiece distances,and nozzle diameters.Goett et al [16] employed a combination of high-speed imaging and spatially resolved high-speed spectroscopy with a frame rate of up to 5000 fps to estimate the arc temperature in submerged arc welding.Mirapeix et al[17] have established a link between theTeand the flaws in the weld seam.Valdiande et al [18] utilized OES and laser-induced breakdown spectroscopy to monitor the GTAW weld quality.Namoura et al [19] performed 3D spectroscopic measurements.They used the relative line intensity approach to determine the iron vapor concentrations and reported a 3D visualization of iron vapor distribution along with the temperature distribution of the arc.Ribic et al[1]have used OES to analyze electron temperatures,and species densities,in laser,arc,and laser-arc hybrid welding.
To the best of our knowledge,the use of OES in combination with a collisional radiative (CR) model and actinometry to understand and control defects arising from dissimilar metal joints has not been extensively studied.In the present work,we have investigated the role of Zn vapor in forming porosity during GTAW of Fe-Al joints.OES measurements were performed under various operating conditions,such as weld current,welding speed,and input waveform.The intensity line ratio of Zn to Ar(Ar serving as an actinometer gas) was used in conjunction with suitable theoretical modeling to determine the Zn population and its correlation with defects observed in the weld pool across the range of experimental parameters.These results were in good agreement with porosity data obtained from x-ray radiography images.This research highlights the potential of spectroscopic diagnostics as a valuable tool for quality control in the GTAW process of dissimilar metal joints.It demonstrates the ability to monitor weld quality,detect porosity defects,and estimate porosity levels during arc welding.This approach can be extended to other application areas.For example,it can be employed to assess quality control and monitor defects in additive manufacturing,ensuring the structural integrity of fabricated parts.
2.Experimental scheme
The experimental setup used in the present work is shown in figure 1.It consists of the Fronius make Magicwave 4000 arc plasma power supply,LEM make LF-310 S hall sensor,and Photron NOVA high-speed camera.The online recording of current and voltage waveforms is done with Dewesoft make data acquisition system.The arc images are synchronized with the instantaneous welding current and voltage waveforms at a sampling rate of 20 kHz.The typical arc images and respective temporal behavior of arc current are shown in figure S1 of the supplementary data.A bandpass filter(690±10 nm) is used with high-speed camera to eliminate the arc light interference.The 1 mm thin sheets of AA6061-T6 aluminum alloy(Al)and galvannealed steel(Fe)of length 200 mm,width 100 mm are joined in lap joint configurationusing AA4043 filler wire of 1.2 mm diameter.The detailed chemical composition of the materials is given in table S1 of the supplementary data.A non-corrosive Nocolok flux is applied uniformly at the brazing interface to improve the wetting of molten filler metal with the Fe sheet surface.Figure 1 depicts the joint configuration and setup used in joining Fe-Al sheets.The Fe and Al sheets are clamped on a fixture to restrict the distortions,keeping the Fe sheet at the bottom and maintaining an overlapping length of 15 mm.The fixture is mounted on a modular plate that moves at a given travel speed.Fe and Al sheets are degreased and cleaned using acetone before mounting on the fixture.
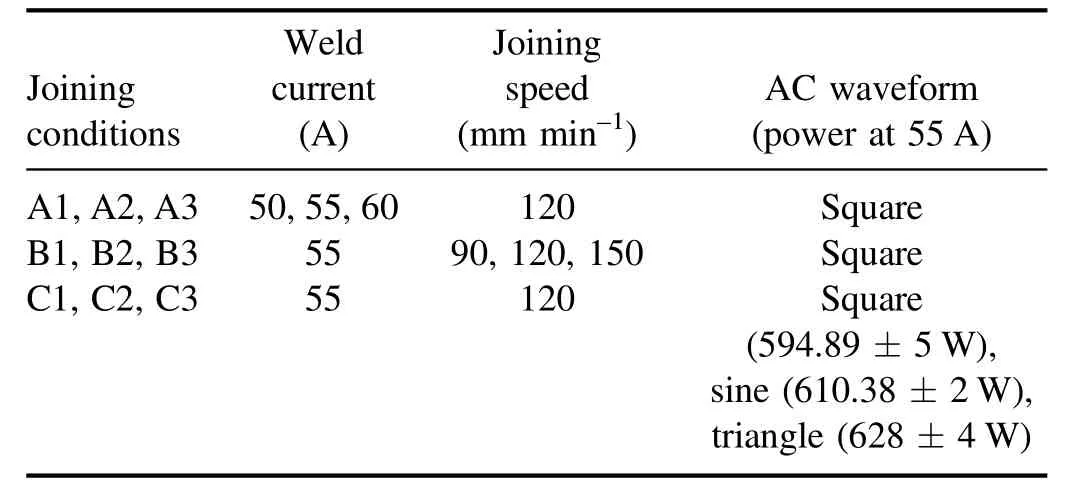
Table 1.Variable joining conditions considered in the present work.
In the present work,the OES measurements are carried out under various joining conditions by varying the weld current,waveform,and joining speed,as mentioned in table 1.It is worth mentioning that small fluctuations in power are observed at constant current when the waveform is varied.We have performed calculations to determine the power from current-voltage measurements shown in figure S1 of the supplementary document for all the waveforms used in the experiment and determined the variation in the power.The results presented in table 1,indicate that the variation in power did not exceed 20-25 W,which is less than 5%of the average input power.We believe this variation is within the acceptable range.It is worth mentioning that in the GTAW process,the arc plasma is relatively more transient in nature.Therefore,performing the experiment with constant power results in a less stable arc,inconsistent weld penetration,and poor weld quality.In contrast,a constant current provides a stable welding current,even in the face of changes in arc length or electrode-to-work distance,which is essential for achieving high-quality GTAW welds.Thus,keeping constant current is a preferable choice without significant power fluctuations.Normally,if the power fluctuations are within 10%values,one can safely assume that input power is stable within the acceptable limit.In our experiment,we used a constant current power supply,specifically the Fronius Magicwave 4000 arc plasma power supply.This power supply is designed to provide a stable welding current,which allows for precise control over the heat input.We also fixed the sample to electrode tip distance,which helps in maintaining a constant voltage.This,in turn,helps to keep the power relatively constant.
The details of the operating conditions that were kept constant are given in table S2 of the supplementary data.The OES measurements are recorded using a spectrometer(Ocean-HDX-UV-VIS,Ocean Optics,Inc.USA) with a resolution (full width at half maxima) of 0.7 nm at a fixed position 50 cm away from the arc region.The OES measurement exhibits significant line emission from Zn I in the region of 400-650 nm and Ar I in the region of 680-800 nm,as shown in figures 2(a)and(b).The respective spectroscopic parameters of these emission lines are mentioned in tables S3 and S4 of the supplementary document.Typical arc emission spectra in the entire investigating wavelength range are shown in figure S2 of the supplementary document.The emissions due to Na I and Mg I at 589.2 nm and 518.5 nm are also observed due to the traces of these elements in the filler material.All the OES measurements are corrected for background noise and spectral response of the spectrometer.The OES measurements are repeated multiple times to estimate the possible uncertainties in the extracted plasma parameters.
3.Methodology
3.1.Estimation of electron density and electron temperature using OES cum CR model approach
In the present work,we employed an OES cum CR model based approach that can simultaneously estimate the electron temperature(Te) and electron density(ne) which is required for understanding GTAW process characteristics as a function of various operating parameters.The current approach is more comprehensive than conventional methods,such as Boltzmann plots,as it does not require local thermal equilibrium conditions to be fulfilled.Further,the present approach can simultaneously extract both the key plasma parameters i.e.Teandne.It is worth mentioning that the Boltzmann plot approach can only predictTevalues.
To extract plasma parameters from OES measurements,we considered a CR model consisting of 31 fine-structure energy levels.As shown in the CR model framework in figure 3,energy levels corresponding to 4s4p,4s5s,4s5p,4s4d,4s6s,4s6p,4s5d,4s7s,manifold along with ground state,and the first Zn+ion state are considered.The population density of any fine-structure level of the CR model can be estimated by numerically solving the set of coupled balance rate equations.These rate balance equations are developed by incorporating major kinetic processes of the discharge,such as electron impact excitation/ionization,electron impact de-excitation,three-body recombination,spontaneous radiative decay,and quenching of metastable states.Following the CR model framework presented in figure 3,the rate balance equation for a given fine-structure level can be expressed as
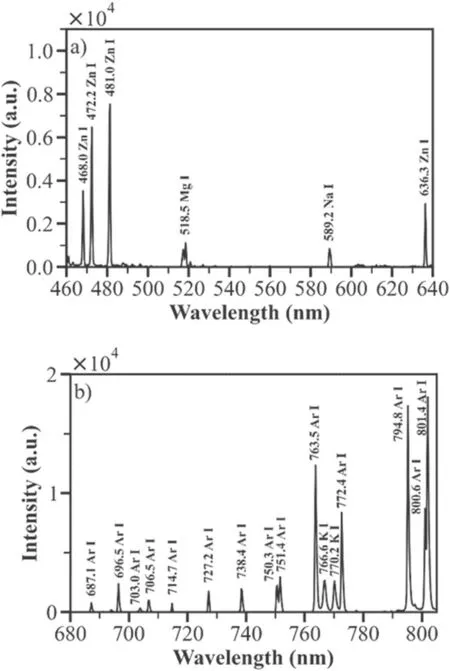
Figure 2.The observed OES line emission form(a)Zn-I,(b)Ar-I for an experimental condition ‘A1’ as mentioned in table 1.Similar emission lines are observed in all other conditions of table 1.For the complete OES spectra,please refer to the figure S2 of the supplementary document.
These coupled rate balance equations are solved,assuming the steady state condition.In this equation,Teandnerepresent electron temperature and density respectively,niand nfrepresent the population number density of the corresponding level,and n+represents the ion population.Aifrepresents the Einstein coefficient.The coefficients,k+f,kf+define the rate coefficients of the respective processes and can be obtained by integrating the respective crosssections given in the following equation [20]
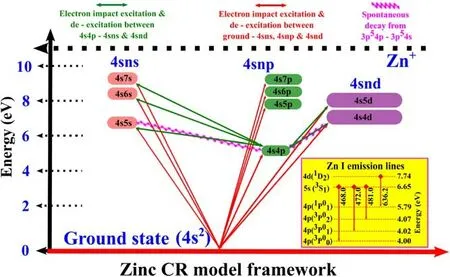
Figure 3.The CR model framework for Zn atom.The electron induced processes are shown by solid lines and radiative processes by curved lines.The insert at the bottom right shows the Zn-I emission lines that are observed in the OES measurements.
The current CR model differs from the previous model in which it incorporates the self-absorption of emission lines.We observed that including self-absorption is crucial in the present investigation conditions.Self-absorption is a phenomenon that occurs in practically all types of radiation sources,in which the strength of specific emission lines is reduced due to radiation absorption by the source itself.This can have an impact on the accuracy of the extracted plasma parameters.In the present work,we used an internal reference line-based approach proposed by Sun et al[25].To accurately estimate the self-absorption correction factor,one should select the reference emission line that has a lower transition probability and a higher energy gap between its transition levels.The self-absorption correction coefficient (SACF) of emission lines using the following equation:
where,the SACF for the emission line under consideration.andare the emission intensity of considered line and reference line,respectively.AfiandAmndenote the transition probabilities of the emission line and the reference line,respectively.Thegfandgmare the degeneracies of the respective level.EfandEmare the upper energies of the emission lines under consideration.The subscripts ‘fi’,and‘mn’ represent the energy levels of the respective transition.Here‘f’and‘m’represent the upper energy level while‘i’and‘n’ represent the lower energy level of the respective transition.In the present work,Zn-I 468 nm line is chosen as a reference line [22,26].
The solution of CR model equations provides the population density of various levels as a function of input parametersTeandne.This population density can be used to simulate the model intensity as a function ofTeandne.It can be calculated assuming the intensity as,whereIλis the intensity of the emission line,Ajiis the Einstein coefficient,andnjis the population density of the excited state[27].The population density of the excited state is a critical factor that determines the intensity of the emission line,and it is strongly influenced by the plasma parameters,such as the electron temperature(Te) and the electron number density(ne).These plasma parameters can be obtained by solving the coupled balance equations,which describe the kinetics of the excited states and their interactions with the electrons and ions in the discharge regime.The coupled balancing equation solution gives the population density of excited states as a function ofTeandne.These population densities will then be utilized to generate simulated line intensities,which will be compared to experimental OES data.To extractTeandnevalues,the CR model simulated intensities are compared with the corresponding measurements by calculating the deviation parameter as
TheTeandneof the discharge can be found by finding the minimum deviation between the simulated and measured line intensities.The summation in equation(4)is from j=1 to 4,which corresponds to the four Zn emission lines that are considered in the CR model.The value of the minimum deviation corresponds to theTeandneof the discharge.Multiple repeated measurements are carried out and the standard deviation inTeandnevalues are obtained to estimate the errors in the extractedTeandnevalues.
3.2.Estimation of Zn number density using plasma actinometry
The zinc vapor density during the welding process is quantified using the line ratio of Zn I and Ar I emission lines.These line ratios are linked to the density of respective gas atoms.If the density of one gas atom (actinometer gas) is known,the other atom’s density can be estimated.The actinometry method is widely used and extensively documented in the literature,so only a brief overview will be provided here [28,29].Assuming that respective excited states (from which the emission line originates) are mainly populated through electron-impact excitation and decay of these levels is by spontaneous emission,then the line ratio IZn/IArcan be given as [28]
whereBZnandBArare the branching ratio of the Zn I and Ar I emissions,which is defined as.Here Abadenotes the Einstein coefficient for the respective atomic transition linked to the considered emission line.Here ‘b’ denotes the upper level from where the line originates,and‘a(chǎn)’denotes the lower levels.The respective Abacoefficients were taken from the NIST database [30].Theare the electron impact excitation rate coefficients from the ground state.The[nZn] and[nAr] are the ground state density of respective atoms.The electron impact excitation rate coefficients are calculated from equation (2) [21].The required cross-section data for the Ar and Zn are taken from the previously reported data by the author using fully relativistic distorted wave approximation (RDW) [24,31-33].The requiredTevalues are used from OES-coupled-CR model results.
3.3.X-ray computer tomography imaging
To cross-validate the present zinc-induced porosity results in Al-Fe weld joints,results are compared with an independent approach based on x-ray computed tomography imaging.This technique allowed us to obtain a non-destructive,three-dimensional(3D)view of the weld and quantify any defects that may have occurred during the welding process[10].The sample was placed on a rotating turntable between the x-ray source and detector,and x-rays were passed through the sample.These x-rays either passed through the sample or were attenuated,resulting in a gray-scale radiograph on the detector screen.The resolution of the scan was determined by the magnification factor of the object,which was influenced by the relative position of the x-ray source and detector.We acquired multiple radiographic projections through a full 360°rotation,which are then back-projected to reconstruct the image.
4.Results and discussion
4.1.Electron density and electron temperature under various joining conditions of GTAW
From the CR model,the level populations are obtained as a functionTeandneat a wide grid to optimize model intensities with respective OES measurements.The deviation parameter is calculated at all the joining conditions mentioned in table 1.A distinct minimum is observed for all the cases.Figure 4(a)shows a typical deviation plot as a function ofTeandneat the‘A2’ condition of table 1.Similar behavior of the deviation parameter is observed for all other conditions of table 1.Figure 4(b) compares normalized model intensities (at minimum deviation value=0.28) with corresponding measurements.The Zn-481 nm line shows a deviation which is also present in all other conditions of table 1.However,the rest three emission lines show excellent agreement in all cases of table 1.Overall,a reasonable agreement between model and measurement values is achieved.This ensures that the CR model is optimized for the present investigating conditions.
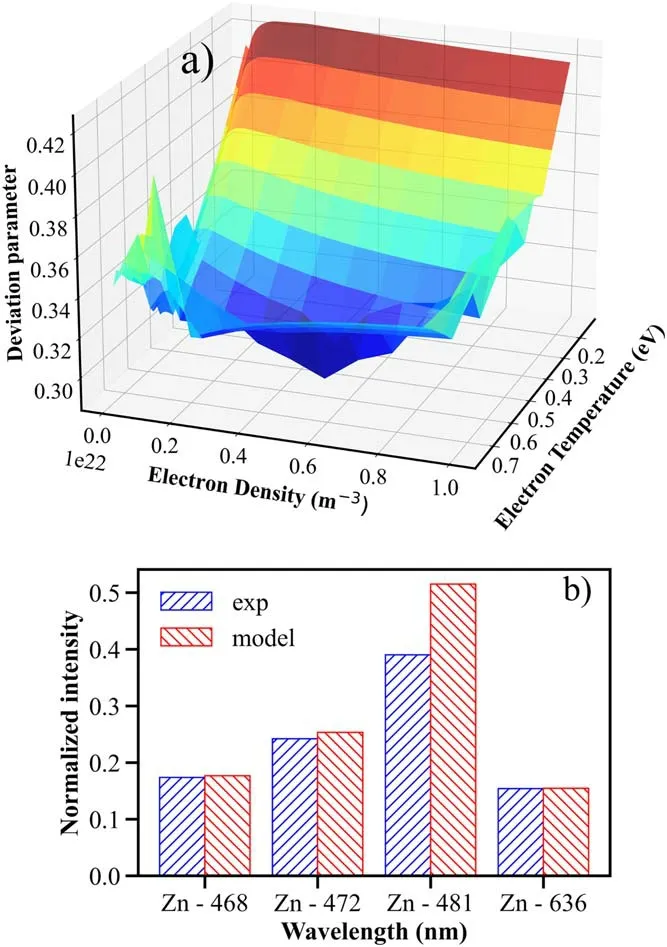
Figure 4. (a) Deviation parameter as a function of electron temperature and electron density.(b)Comparison of normalized CR model intensities with the respective OES measurements.
Figure 5(a) shows an increasing behavior ofTewith the increase in weld current from 50 to 60 A (please refer to conditions A1,A2,and A3 of table 1).This behavior is reasonable,as during the arc welding process,the increase in current leads to an increase in total heat input at a constant frequency [34,35],which reflects an increase inTe.Figure 5(b) shows a decrease in electron temperature as the joining speed increases from 90 to 150 mm min-1(please refer to conditions B1,B2,and B3 of table 1).The weld current affects the thermal cycle in the welding process,and the arc characteristics largely depend on the base metal’s interaction time.As the speed increases,a net decrease in theTevalue is observed.This trend can be explained by the fact that the overall volume covered by the welding arc increases with the joining speed in the same time interval,leading to an increase in the arc’s interaction with the environment and a net increase in heat loss with the joining speed.Figure 5(c)illustrates theTevariation as a function of the input waveform(please refer to conditions C1,C2,and C3 of table 1).It is observed that the triangle waveform achieves the highestTevalue while the square waveform achieves the lowest.The authors previously investigated the influence of various waveforms in the GTAW process [8].They reported an overall rise in heat input for the triangle waveform than for the sine and square waveforms for a similar experimental setup.The triangle waveform has the highest peak currents and voltages,followed by sine and square waveforms at the same current settings [figures S1(a)-(c) of supplementary document],allowing more electrons to be emitted from the tungsten electrode and accelerated as they pass through the arc regime.This enhances the amount of released energy,reflecting the overall increase inTe,as observed in figure 5(c) [36].
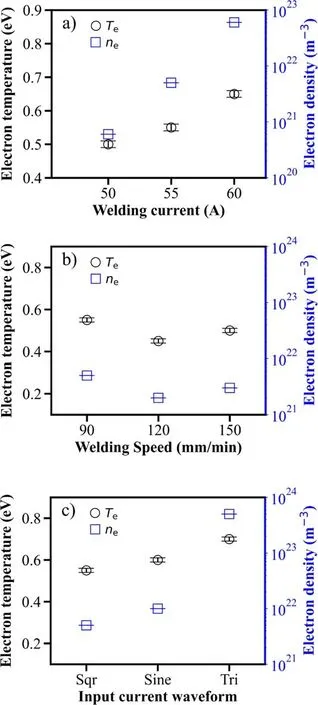
Figure 5.The electron temperature and density are plotted as a function of different experimental parameters,as indicated in table 1.
Regarding the electron density(ne),figure 5(a) indicates an increase innewith the weld current.This is expected as the heat input in the system increases with an increase in the weld current,resulting in an overall increase in thenevalues.In addition,as the joining speed increases,the electron density decreases slightly,as illustrated in figure 5(b).When it comes to waveform variation,the triangle waveform is expected to exhibit the highest electron energy,followed by the sine and square waveforms.The duty cycle of the waveform is kept constant,but the system’s overall energy increases because of the net increase in weld current,which is well reflected in thenevalues,as seen in figure 5(c).
Further,the Ar-I line ratio approach is utilized to estimate the qualitative behavior ofTeandneand compared with CR model results to ensure consistency.The line-ratio approach is straightforward.However,the accuracy of the approach significantly depends on the choice of the line ratio.Therefore,the line ratios must be chosen carefully after investigating their sensitivity to the parameter of interest.The literature suggests following Ar-I-line ratios suitable forTeandne[37].Further description of line ratio technique can be found in the literature [38-41]
The results presented in figures 6(a)and(b)clearly show that the sensitive ratio ofTeandneincreases with increasing discharge current.At a weld speed of 120 mm min-1,the sensitive ratio ofTeandnereaches its minimum value and does not depreciate further with an increase in weld speed.When the input waveform is changed,as shown in figure 6(c),the highest values of the sensitive ratio ofTeandneare observed when using a triangle waveform,which has the highest peak current values at fixed voltages.In contrast,the lowest values are observed when using a square waveform.These findings indicate the robustness of the present Zn-CR model in accurately predicting theTeandnevalues.
4.2.Determination of Zn vapor density
Employing the plasma OES-actinometry technique,the qualitative behavior of Zn vapor density induced in the arc plasma welding process is investigated under various operating conditions,as mentioned in table 1.As evident from equation(5),the actinometry approach is directly linked with the emission line ratios.Figure 7 depicts the three-line ratios viz.468.0(Zn-I)/750.3(Ar-I),472.2(Zn-I)/750.3(Ar-I),and 481.0 (Zn-I)/750.3 (Ar-I).Figure 7(a) shows that the Zn-to-Ar increases with the weld current.Similarly,figure 7(b)shows that the Zn-to-Ar ratios decrease with joining speed.In the case of variation in input waveform,we can observe a significant rise in the intensity ratio from square waveform to triangle waveform.Further utilizing these ratios,the Zn-to-Ar population density ratio(nZn/nAr)is determined and presented in figure 8.ThenZn/nArpopulation ratios exhibit similar qualitative behavior as observed from the Zn-to-Ar line ratio.This behavior can be understood by investigating the dependence of electron temperature in respective operating conditions.The increase in thenZn/nArsuggests an increase in the population transfer to the respective radiating level through the electron impact excitation process and vice versa.The electron impact excitation rate coefficients depend on electron temperature.Therefore,the variation in the electron temperature is directly linked withnZn/nArpopulation ratio and,thereby,the induced Zn vapor density in the GTAW weld process..It is worth mentioning that the Ar gas flow rate was kept constant in all the operating conditions investigated in the present work.Moreover,the excitation of Zn-I radiating levels(~6 eV)is much lesser than the excitation threshold of Ar-I radiating levels(~13 eV).Thus,the variation of electron temperature~0.5-0.7 eV (average electron temperature assuming Maxwellian electron energy distribution),under various operating conditions,as shown in figure 6,mainly affects population transfer to Zn-I radiating levels.Therefore,(nZn/nAr)reflects the variation in the Zn vapor density induced in the arc plasma weld process.
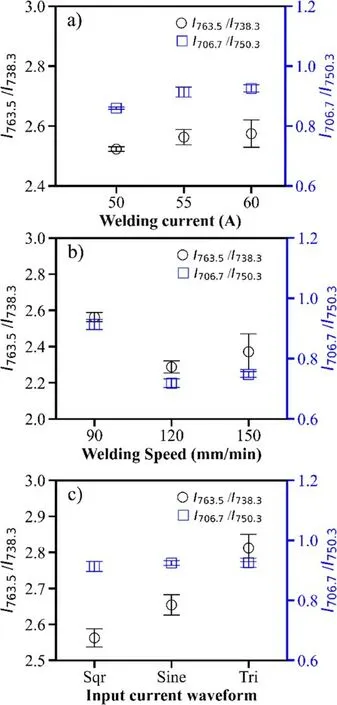
Figure 6.Ar-I emission line intensity ratios as a function of experimental operating conditions as given in table 1.
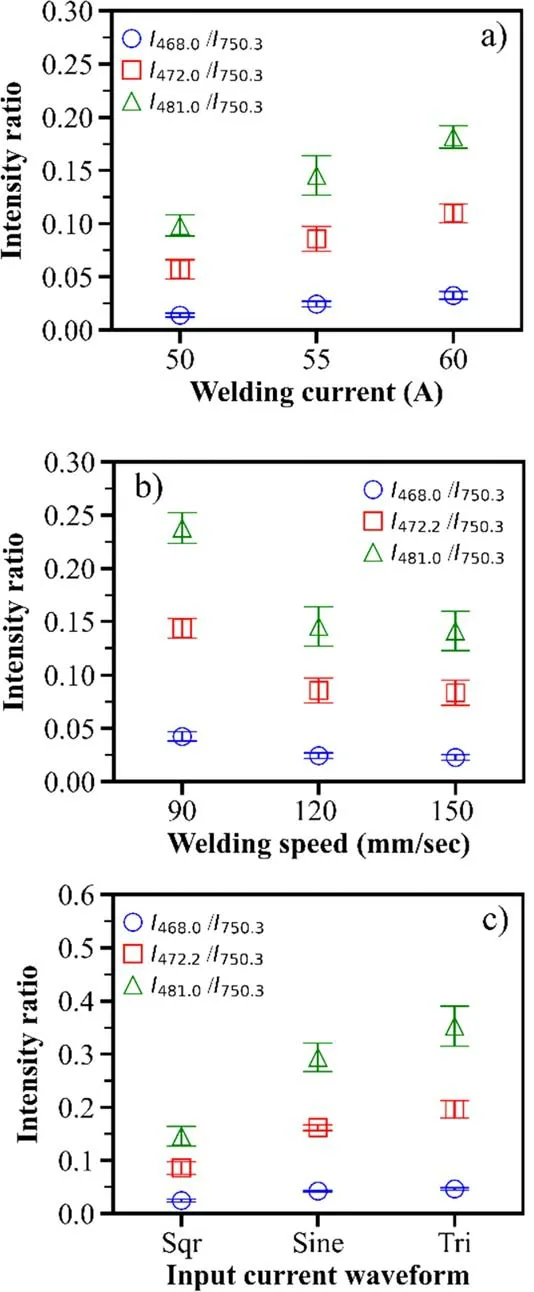
Figure 7. The Zn-I-to-Ar-I line ratios as a function of different experimental parameters,as mentioned in table 1.
As shown in figure 8,the Zn population increases almost linearly with the weld current.It is reasonable asTe,heat input,and arc force increase with the arc current.In terms of zinc vapor creation,as heat input increases,more high-pressure zinc vapor is created in the weld pool region,causing more of the zinc layer to evaporate.This condition can result in significant weld porosity,as reported previously by Jiyoung et al [11].Similarly,thenZn/nArtrend as joining speed is consistent with the findings reported by Abbas et al[35].The total heat throughput drops with the increase in joining speed.This decrease in heat input leads to a decrease in the Zn vapor concentration near the weld pool.A lower Zn vapor concentration means that there are fewer Zn atoms available to form porosity defects.This is why we observe a decrease in thenZn/nArratio as the joining speed increases.When the input waveform varies during the negative pulse period of each waveform,the electrode switches to the cathode,causing a stream of electrons to begin flowing through the arc and increasing the heat produced at the workpiece.This is the highest in the case of the triangle waveform because it generates the highest peak current compared to other waveforms,as we previously reported [8].Due to Zn higher work function and lower melting point as compared to Al and Fe,as well as the increase in energy with high arc force,there is an increase in the Zn population at the workpiece.
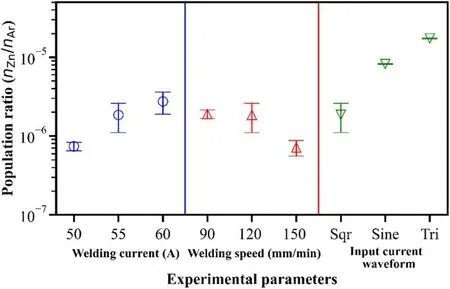
Figure 8.Population ratio (nZn/nAr)as a function of different experimental parameters as shown in table 1.
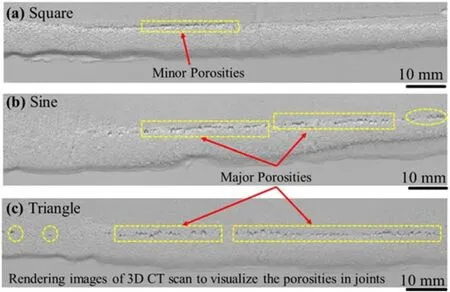
Figure 9.Rendered images of 3D CT scan of Fe-Al joints produced using joining conditions C1,C2 and C3 for AC waveform(a)square,(b) sine and (c) triangle to visualize the porosities.The yellow dashed markings in the figure highlight the welding region of porosity.
In our earlier investigation for heat generation with waveform variation,arc images indicate that the most intense arc occurs during the negative cycle of the triangle waveform,followed by the sine and square waveforms as shown in figures S1(a)-(c) of the supplementary document [8].A similar trend can be seen in the extractednZn/nArpopulation ratio,with the triangle waveform having the most Zn population and the square waveform having the least Zn population.
To cross-verify plasma-actinometry results,the predicted Zn population density from OES-actinometry is compared to porosity data derived from an independent approach based on x-ray radiography images for operating conditions C1,C2,and C3 of table 1.Figure S4 shows the Fe-Al joint weld bead and their corresponding 3D CT scan images for conditions C1,C2,and C3,respectively.Figure 9 shows the size and number of porosities in the corresponding Fe-Al joints for conditions C1,C2,and C3,respectively,using the rendering technique of the graphics software.It is clear from the image that the size and number of porosities are significant for the triangle waveform,followed by the sine waveform.It is the least with the square waveform.The porosity in the weld bead is in trend with the population ratio.In the plasma environment,a higher Zn population is expected to introduce more Zn porosities in the weld bead.Such as for square waveform,Zn population is minimum,and the porosity is also negligible.Likewise,for the triangle waveform,the porosity size and number are maximum,and so is the Zn vapor population density.
5.Conclusion and future work
The objective of this study was to investigate and observe the Zn induced porosity variation using spectroscopic diagnostics during the GTAW process.The following conclusions can be drawn from the present study:
(1) The Zn population is estimated for Fe-Al weld joints as a function of various experimental parameters such as weld current,joining speed,and input waveform.
(2) It is observed that there is a significant decrease in the zinc population ratio for low currents and joining speeds.In case of waveform,square waveform gives less zinc presence in arc compared to sine and triangle ones.
(3) For variation in AC waveforms the results are correlated with the 3D CT scan images,which agrees with the present model prediction.From figure S1,we can understand that as the peak currents increase,the arc diameter increases,which results in spiking zinc population density in the weld pool.
(4) Spectroscopic diagnostics,such as OES,can be a very effective non-destructive tool for real-time weld quality monitoring.
In conclusion,the present work demonstrates that OES is an efficient and fast method for estimating porosity during the GTAW process of Fe-Al joints.This present approach can also be employed in other areas,such as additive manufacturing,to assess structural integrity and defect detection in fabricated parts.
Acknowledgments
SS is thankful to the Ministry of Human Resources and Development (MHRD),Government of India,for providing HTRA fellowship.The authors gratefully acknowledge the support by the SERB,India,for listed Grants (Nos.CRG/2018/000419,CVD/2020/000458,and SB/S2/RJN-093/2015) Core Research Grant,India (No.CRG/2020/005089)and IIT Tirupati,India(No.MEE/18-19/008/NFSG/DEGA).
ORCID iDs
 Plasma Science and Technology2023年11期
- Plasma Science and Technology的其它文章
- High-order field theory and a weak Euler-Lagrange-Barut equation for classical relativistic particle-field systems
- Design of new resonant magnetic perturbation coils on the J-TEXT tokamak
- A study of grid failure mode drivers and methods for accelerated life testing of a 30cm diameter ion thruster
- Research on degradation mechanism of trichlorobenzene and Hg0 by nonthermal plasma catalysis
- Ionization wave propagation and cathode sheath formation due to surface dielectricbarrier discharge sustained in pulsed mode
- Development of an atmospheric fluorocarbon plasma jet generated by pulse modulated microwave discharge