
Intensified Impact of the Equatorial QBO in August–September on the Northern Stratospheric Polar Vortex in December–January since the Late 1990s
2022-11-07 05:33:00HaiboZHOUandKeFAN
Haibo ZHOU and Ke FAN
1 Institute of Atmospheric Physics, Chinese Academy of Sciences, Beijing 100029
2 School of Atmospheric Science, Sun Yat-sen University, and Southern Marine Science and Engineering Guangdong Laboratory (Zhuhai), Zhuhai 519082
3 University of Chinese Academy of Sciences, Beijing 100049
ABSTRACT This study reveals an intensified impact of the equatorial quasi-biennial oscillation (QBO) in August–September(QBO_AS) on the northern stratospheric polar vortex (SPV) in December–January (SPV_DJ) since the late 1990s.The unstable relationship may be related to the differences in the deep convection anomaly over the tropical western Pacific and Indian Oceans in October–November (ON) related to the QBO_AS prior to and after the late 1990s. During 1998–2017, the easterly phase of the QBO_AS is accompanied by a colder tropical tropopause in ON, which enhances the deep convective activity over the tropical western Pacific and suppresses it over the Indian Ocean. The deep convection anomaly generates anomalous Rossby waves that propagate into the northern mid-to-high latitudes to constructively interfere with the climatological wavenumber-1 and wavenumber-2 components, thereby resulting in enhanced upward-propagating tropospheric planetary-scale waves and a weakened SPV_DJ anomaly. During 1979–1997, however, the deep convection anomaly over the tropical western Pacific and Indian Oceans in ON related to the easterly phase of the QBO_AS is weaker and shifts eastward, which excites the anomalous Rossby waves to constructively/destructively interfere with the climatological wavenumber-1 component in the midlatitudes/high latitudes, thereby weakening the upward-propagating planetary-scale waves and leading to a weaker linkage with the SPV_DJ. Further analyses reveal that the unstable relationship may be associated with the interdecadal differences in deep convection over the tropical western Pacific and Indian Oceans and the upward-propagating tropospheric planetary-scale waves in ON.
Key words: equatorial quasi-biennial oscillation, stratospheric polar vortex, deep convection over the tropical western Pacific and Indian Oceans, planetary-scale waves
1. Introduction
The equatorial quasi-biennial oscillation (QBO) is an important interannual variability of the zonal wind in the tropical stratosphere with a period of about 28 months(Reed et al., 1961; Veryard and Ebdon, 1961; Naujokat,1986). Numerous studies have revealed that the QBO has an important modulating effect on the northern winter stratospheric polar vortex (SPV) (Holton and Tan, 1980,1982; Gray et al., 2001; Chen et al., 2004; Rao et al.,2020a; Yamazaki et al., 2020). More specifically, the winter SPV tends to be weaker (stronger) when the QBO is in its easterly (westerly) phase, often referred to as the Holton–Tan effect.
Several possible mechanisms for the Holton–Tan effect have been explored. The first and the most wellknown mechanism is proposed by Holton and Tan(1980). It involves the changes of the subtropical critical line (i.e., zero-wind line) in the lower stratosphere, which alters the width of the midlatitude waveguide for tropospheric planetary-scale waves propagating into the stratosphere. For the Northern Hemisphere, when the QBO is in its easterly phase (EQBO), the critical line moves toward the subtropics, which narrows the width of the midlatitude waveguide; the critical line can reflect the planetary-scale waves toward the pole (Tung, 1979), thus causing a more disturbed, warmer SPV. However, when the QBO is in its westerly phase (WQBO), the critical line moves toward the equator, which widens the midlatitude waveguide. The wider midlatitude waveguide allows more planetary-scale waves to propagate to the equator,thus leading to a less-disturbed, colder SPV. Apart from the critical-line mechanism, another mechanism is the QBO-driven secondary meridional circulation. This meridional circulation is transported by planetary-scale wave activities and directly affects the high-latitude circulation, thus affecting the SPV (Kodera, 1991; Kinnersley and Tung, 1999; Ruzmaikin et al., 2005; Garfinkel et al., 2012; Lu et al., 2014). Besides, a third mechanism is the QBO in the upper stratosphere. The upper-stratospheric QBO can modulate the planetary-scale waves and SPV in a similar manner via either a modulation of the critical line or the QBO-induced meridional circulation(Gray et al., 2001; Gray, 2003).
All of these mechanisms mentioned above are processes linking the equatorial stratosphere to the polar stratosphere through the stratosphere. Interestingly,Yamazaki et al. (2020) proposed a tropospheric pathway for the Holton–Tan effect by analyzing observations, linear baroclinic model, and atmospheric general circulation model simulations. Taking the EQBO conditions as an illustrative example, the EQBO is accompanied by a colder tropical tropopause, which enhances the deep convective activity over the tropical western Pacific and suppresses it over the Indian Ocean (Giorgetta et al., 1999;Collimore et al., 2003; Liess and Geller, 2012; Rao et al.,2020a, b, c). The convection anomaly generates Rossby waves that propagate into the mid–high-latitude troposphere and constructively interfere with the climatological waves, resulting in enhanced upward propagation of the tropospheric planetary-scale waves and subsequent weakening of the SPV, with the opposite happening under the WQBO conditions. This mechanism is an important complement to the Holton–Tan effect.
Furthermore, some studies have revealed that the Holton–Tan effect has interdecadal changes, and the relationship weakened during 1978–1997 (Naito and Hirota,1997; Chen et al., 2004; Lu et al., 2008, 2014; Christiansen, 2010; Rao et al., 2020b). Chen et al. (2004)showed that, in terms of interdecadal difference, the WQBO dominated during the winters of 1978–1997, but the westerly circumpolar winds did not strengthen following the Holton–Tan mechanism, while westerly winds at mid-to-high latitudes strengthened significantly.That is, the interdecadal changes of the mid–high-latitude zonal wind itself weakened the Holton–Tan effect in this period. Lu et al. (2014) suggested that the weakening of the Holton–Tan effect in 1978–1997 was associated with a broader and strengthened SPV in November–January. The divergence of wave activity allowed planetary-scale waves to propagate meridionally away from the SPV, which interfered with the QBO modulation of planetary-scale wave propagation, especially under EQBO conditions, thus leading to a weakening of the Holton–Tan effect. In addition, Christiansen (2010) showed that,during 1979–1999, the frequency of the strong phase of SPV increased relative to its weak phase, which may have been associated with a change in the QBO from a period with strong bimodality to a period with weak bimodality. The change in bimodality of the QBO was the reason for the weak Holton–Tan effect during 1979–1999. Also, that study further suggested that this change in the QBO could be a random process simply related to the annual sampling of the QBO. Besides, the seasonal synchronization of the QBO with the annual cycle was also investigated in Rao et al. (2020b), who showed that some CMIP5/6 (Coupled Model Intercomparison Project phase 5/6) models without a realistic seasonal synchronization fail to simulate the Holton–Tan effect. Therefore, in decades without a seasonal synchronization of the QBO with the annual cycle, the Holton–Tan effect might weaken. In addition, as the global climate is warming, Rao et al. (2020c) revealed that the Holton–Tan effect might be enhanced.
Moreover, previous studies show that El Ni?o–Southern Oscillation (ENSO) and the 11-yr solar cycle can disrupt the Holton–Tan effect (Labitzke and Van Loon,1988; Kodera, 1991; Wei et al., 2007; Garfinkel and Hartmann, 2008; Calvo et al., 2009; Hu et al., 2017;Huang, 2019). The impact of ENSO on the SPV was considered in the present study; however, the removal of the ENSO signal from the composite analysis did not change the results. Besides, Lu et al. (2008) suggested that solar modulation is not the primary cause for the QBO signals pre- and post-1977, and does not appear to be the factor responsible for the weakened Holton–Tan effect in 1977–1997. Thus, ENSO and solar modulation are not the focus in this paper.
As mentioned above, the Holton–Tan effect changes on interdecadal scales, with its relationship weakening during 1979–1997, for example. Previous studies have explained that the main reasons for this are rooted in the influence of the stratosphere. However, do tropospheric factors also contribute to such interdecadal changes?From the above description of the possible mechanisms,we speculate that deep convective activity over the tropical western Pacific and Indian Oceans may partly account for the Holton–Tan effect. The rest of the paper is organized as follows: Section 2 describes the datasets and methods. Section 3.1 reveals the interdecadal changes in the relationship between the QBO and the SPV. The differences in the deep convection anomaly over the tropical western Pacific and Indian Oceans related to the QBO prior to and after the late 1990s are presented in Section 3.2. Section 3.3 reveals the possible mechanisms for the interdecadal changes. Finally, Section 4 provides a summary and some further discussion.
2. Data and methods
2.1 Data
The monthly mean large-scale atmospheric circulation variables are from the NCEP-1 reanalysis datasets,with a horizontal resolution of 2.5° × 2.5° and 17 vertical pressure levels (Kalnay et al., 1996). The variables used include geopotential height, air temperature, zonal wind,meridional wind, outgoing longwave radiation (OLR),and vertical velocity. To confirm the results obtained from the NCEP-1, the geopotential height derived from the JRA-55 reanalysis (Kobayashi et al., 2015), with a horizontal resolution of 1.25° × 1.25°, is adopted.
Two indices are used: the QBO index (QBOI) and the SPV index (SPVI). The QBOI is defined as the area-averaged zonal wind at 30 hPa in the domain of 5°S–5°N,0°–360° (Ribera et al., 2003; Anstey and Shepherd,2008; Graf et al., 2014; Cheung et al., 2016; Rao et al.,2020a, b). For the composite analysis, the EQBO and WQBO are defined as QBOI < 0 and > 0, respectively.The composite analysis in this study is conducted from the perspective of EQBO minus WQBO, and 30 hPa is chosen to obtain the QBOI because (1) the QBO at 30 hPa has the largest impact in the extratropical boreal winter (Calvo et al., 2007); (2) the QBO signal is most intense at 30 hPa (Ribera et al., 2003); and (3) the QBO at 30 hPa better represents the Holton–Tan effect (Maliniemi et al., 2016). Besides, several previous studies also adopted the QBOI at 30 hPa (Anstey and Shepherd,2008; Graf et al., 2014; Rao et al., 2020a, b, c). Meanwhile, our analysis also shows that, even though the interdecadal changes in the relationship between the QBO at 50 hPa and the SPV are also present, the correlation coefficients between the monthly QBOI at 30 hPa and the winter SPVI during 1979–2017 are higher (figure omitted). In addition, because the stratospheric height anomaly is negatively correlated to the SPV, the SPVI is defined as the area-averaged geopotential height anomalies at 50 hPa within the area of 65°–90°N, 0°–360°, but with the sign revised (Baldwin and Thompson, 2009;Kolstad et al., 2010; Kim et al., 2014; Woo et al., 2015).Both indices are detrended to focus on year-to-year variability and then normalized.
2.2 Methods
The quasi-geostrophic Eliassen–Palm (EP) flux is calculated to measure the wave intensity and wave propagation (Andrews et al., 1987). The simplified EP flux (F)and its divergence (? ·F) (Edmon et al., 1980) are defined as follows:
The mean zonal momentum equation is defined as
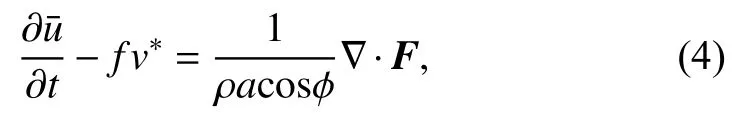
where ρ is the density of air,ais the radius of the earth; φ is the latitude, θ is the potential temperature,pis pressure,uandvare the zonal and meridional wind, respectively,fis the Coriolis parameter, andv*is the residual mean meridional circulation. By expanding the Fourier harmonics, we adopt the sum of the zonal wavenumber-1 and wavenumber-2 to denote quasi-stationary planetaryscale waves. To display the EP flux throughout the stratosphere, the vectors are scaled by(Randel,1987) and 1/ρ (Wang et al., 2009). In addition, vectors above 100 hPa are typically multiplied by 5. According to Eq. (4), the zonal-mean zonal flow is decelerated (accelerated) where there is convergence (divergence) of the EP flux (Hartmann et al., 2000).
Moreover, the horizontal wave activity fluxes (Takaya and Nakamura, 2001) are calculated. The correlation coefficient and composite analysis are adopted in analyzing the data. Unless specified, the trends have all been removed from the composites. In addition, the significance of all these analyses is determined by using the twotailed Student’st-test.
3. Results
3.1 Interdecadal changes in the relationship between QBO in August–September and SPV in December–January
By calculating the correlation coefficients between the QBOI in each month of the year and the SPVI in each month of winter (December–February) for 1979–2017(Fig. 1), we find that the correlation between the QBOI in August–September (QBOI_AS) and the SPVI in December–January (SPVI_DJ) is mostly significantly positive (Fig. 2a). The result is consistent with the study of Cheung et al. (2016), who reported that the correlation is the strongest when the QBO leads the SPV by around four months. To detect whether instability exists in this relationship, we calculate the 13-yr sliding correlation coefficients between QBOI_AS and SPVI_DJ (Fig.2c). No significant correlations are observed before the late 1990s, whereas significantly positive correlations are detected after the late 1990s, implying that the QBO might have a significant intensified impact on the winter SPV since the late 1990s. To verify the results, we repeat the above analyses using the SPVI_DJ obtained from JRA-55 (Figs. 2b, d) and find that the result is highly consistent with that of the SPVI_DJ calculated by using NCEP-1. Therefore, unless specified, only results derived from NCEP-1 are shown.
Moreover, from the scatterplot of QBOI_AS versus SPVI_DJ (Fig. 3), we can also see the interdecadal changes in their relationship. During 1979–1997, the correlation coefficient is only 0.19. However, during 1998–2017, the correlation coefficient is 0.68, exceeding the 99% confidence level. Furthermore, we perform a plausibility test on the correlation coefficients in the two periods based on 1000 bootstrap replicates in R-project (figure omitted), and the results also show that the interdecadal changes in Figs. 2c, d, 3 are stable and plausible.These results are in good agreement with previous studies (Naito and Hirota, 1997; Chen et al., 2004; Lu et al.,2008, 2014).
To further compare the structure of the stratospheric response to the QBO signal in the two periods, the QBO_AS composite differences [easterly phase of QBO_AS (EQBO_AS) minus westerly phase of QBO_AS (WQBO_AS)] in the latitude–pressure crosssections of the zonal-mean geopotential height anomalies, zonal-mean zonal wind anomalies, and zonal-mean temperature anomalies in DJ are displayed in Fig. 4. During 1998–2017, corresponding to the EQBO_AS, significant zonal-mean positive height anomalies in DJ are observed in the polar region from the surface to mid-stratosphere levels (Fig. 4d). Correspondingly, in the stratosphere, obvious zonal-mean easterly anomalies in DJ are found from 50°N to the pole (Fig. 4e), indicating a weakening of the stratospheric polar jet. Meanwhile, the zonalmean temperature in DJ shows a warm Arctic anomaly in the thermal balance with easterly anomalies over this region (Fig. 4f). These features all indicate that the relationship between QBO_AS and SPV_DJ is significantly enhanced during this period. However, during 1979–1997, there is a weak but insignificant SPV response; significant anomalies in DJ can only be found in the tropics and subtropics (Figs. 4a–c), which indicates that the relationship between QBO_AS and SPV_DJ is weak. To verify the results, we repeat the above analyses using JRA-55 data and obtain the similar results (Fig. 5).

Fig. 2. (a) Interannual variation of QBOI_AS (blue curve) and SPVI_DJ_NCEP1 (red curve) during 1979–2017. Both indices have been detrended and normalized. (b) As in (a), but for the SPVI obtained from JRA-55 (SPVI_DJ_JRA55; green curve). (c) 13-yr sliding correlation coefficients between QBOI_AS and SPVI_DJ_NCEP1. Both indices have been detrended and normalized. The horizontal dashed line denotes the 90% confidence level based on the Student’s t-test. (d) As in (c), but for the sliding correlation coefficients between QBOI_AS and SPVI_DJ_JRA55.
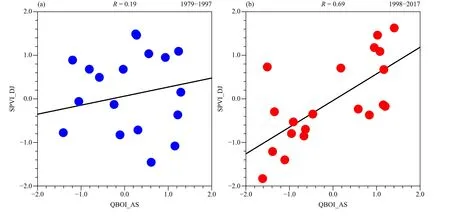
Fig. 3. Scatterplots of QBOI_AS (30 hPa, 5°S–5°N, 0°–360°; zonal wind) versus SPVI_DJ (50 hPa, 65°–90°N, 0°–360°; geopotential height)during (a) 1979–1997 and (b) 1998–2017. The black lines present the linear relationship between QBOI_AS and SPVI_DJ. The correlation coefficient (R) is located in the middle of the top.
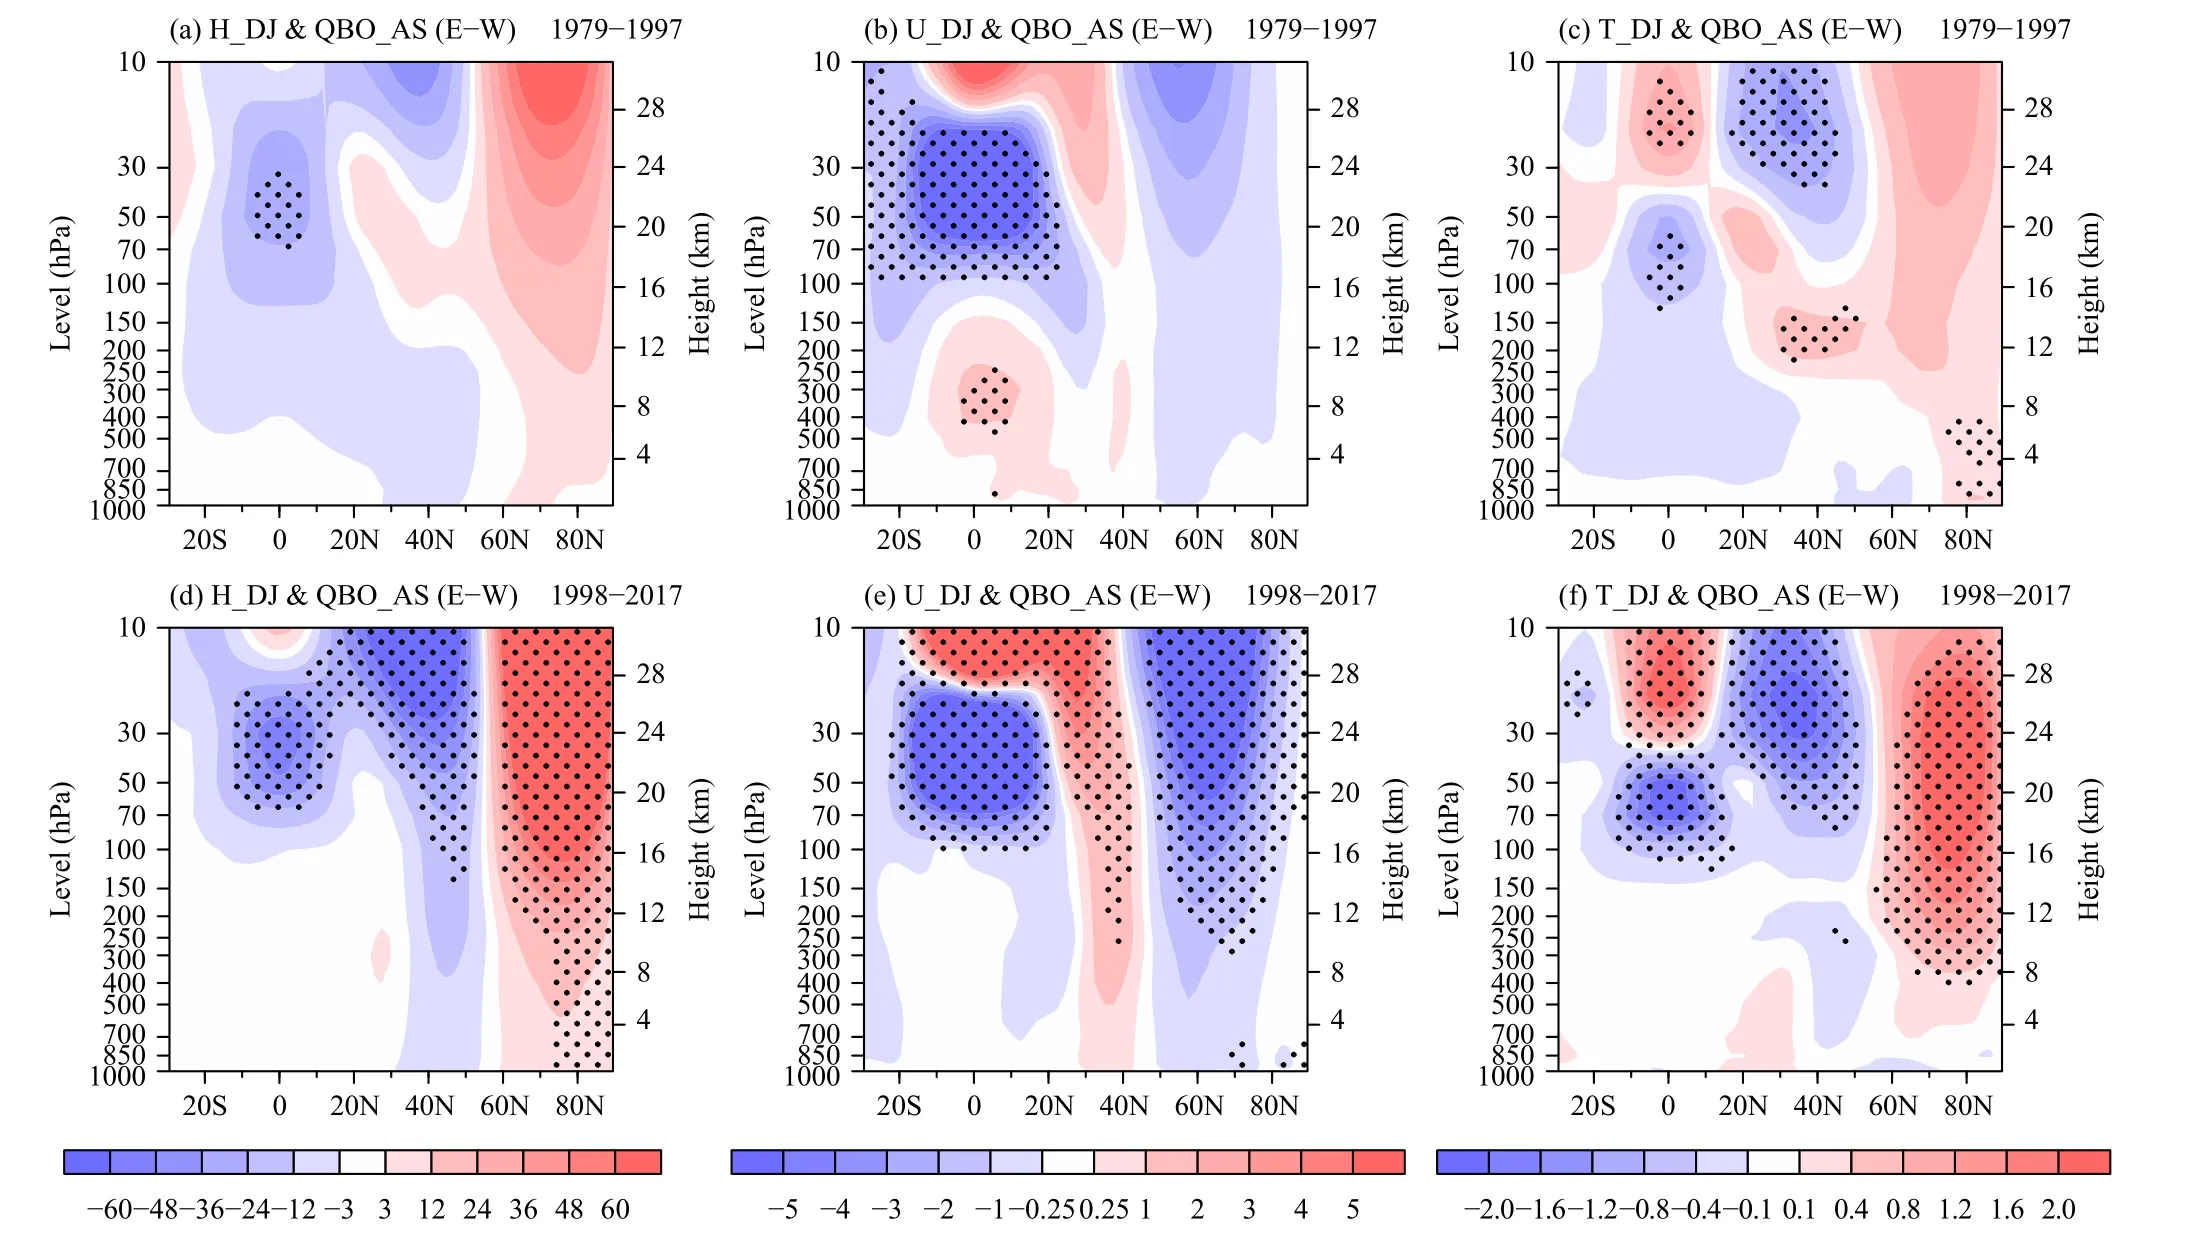
Fig. 4. Latitude–pressure cross-sections of the composite differences between EQBO_AS and WQBO_AS for zonal-mean (a) geopotential height (gpm), (b) zonal wind (m s-1), and (c) temperature (°C) in DJ during 1979–1997. The black dotted areas indicate statistical significance at the 90% confidence level based on the Student’s t-test. (d–f) As in (a–c), but for 1998–2017.
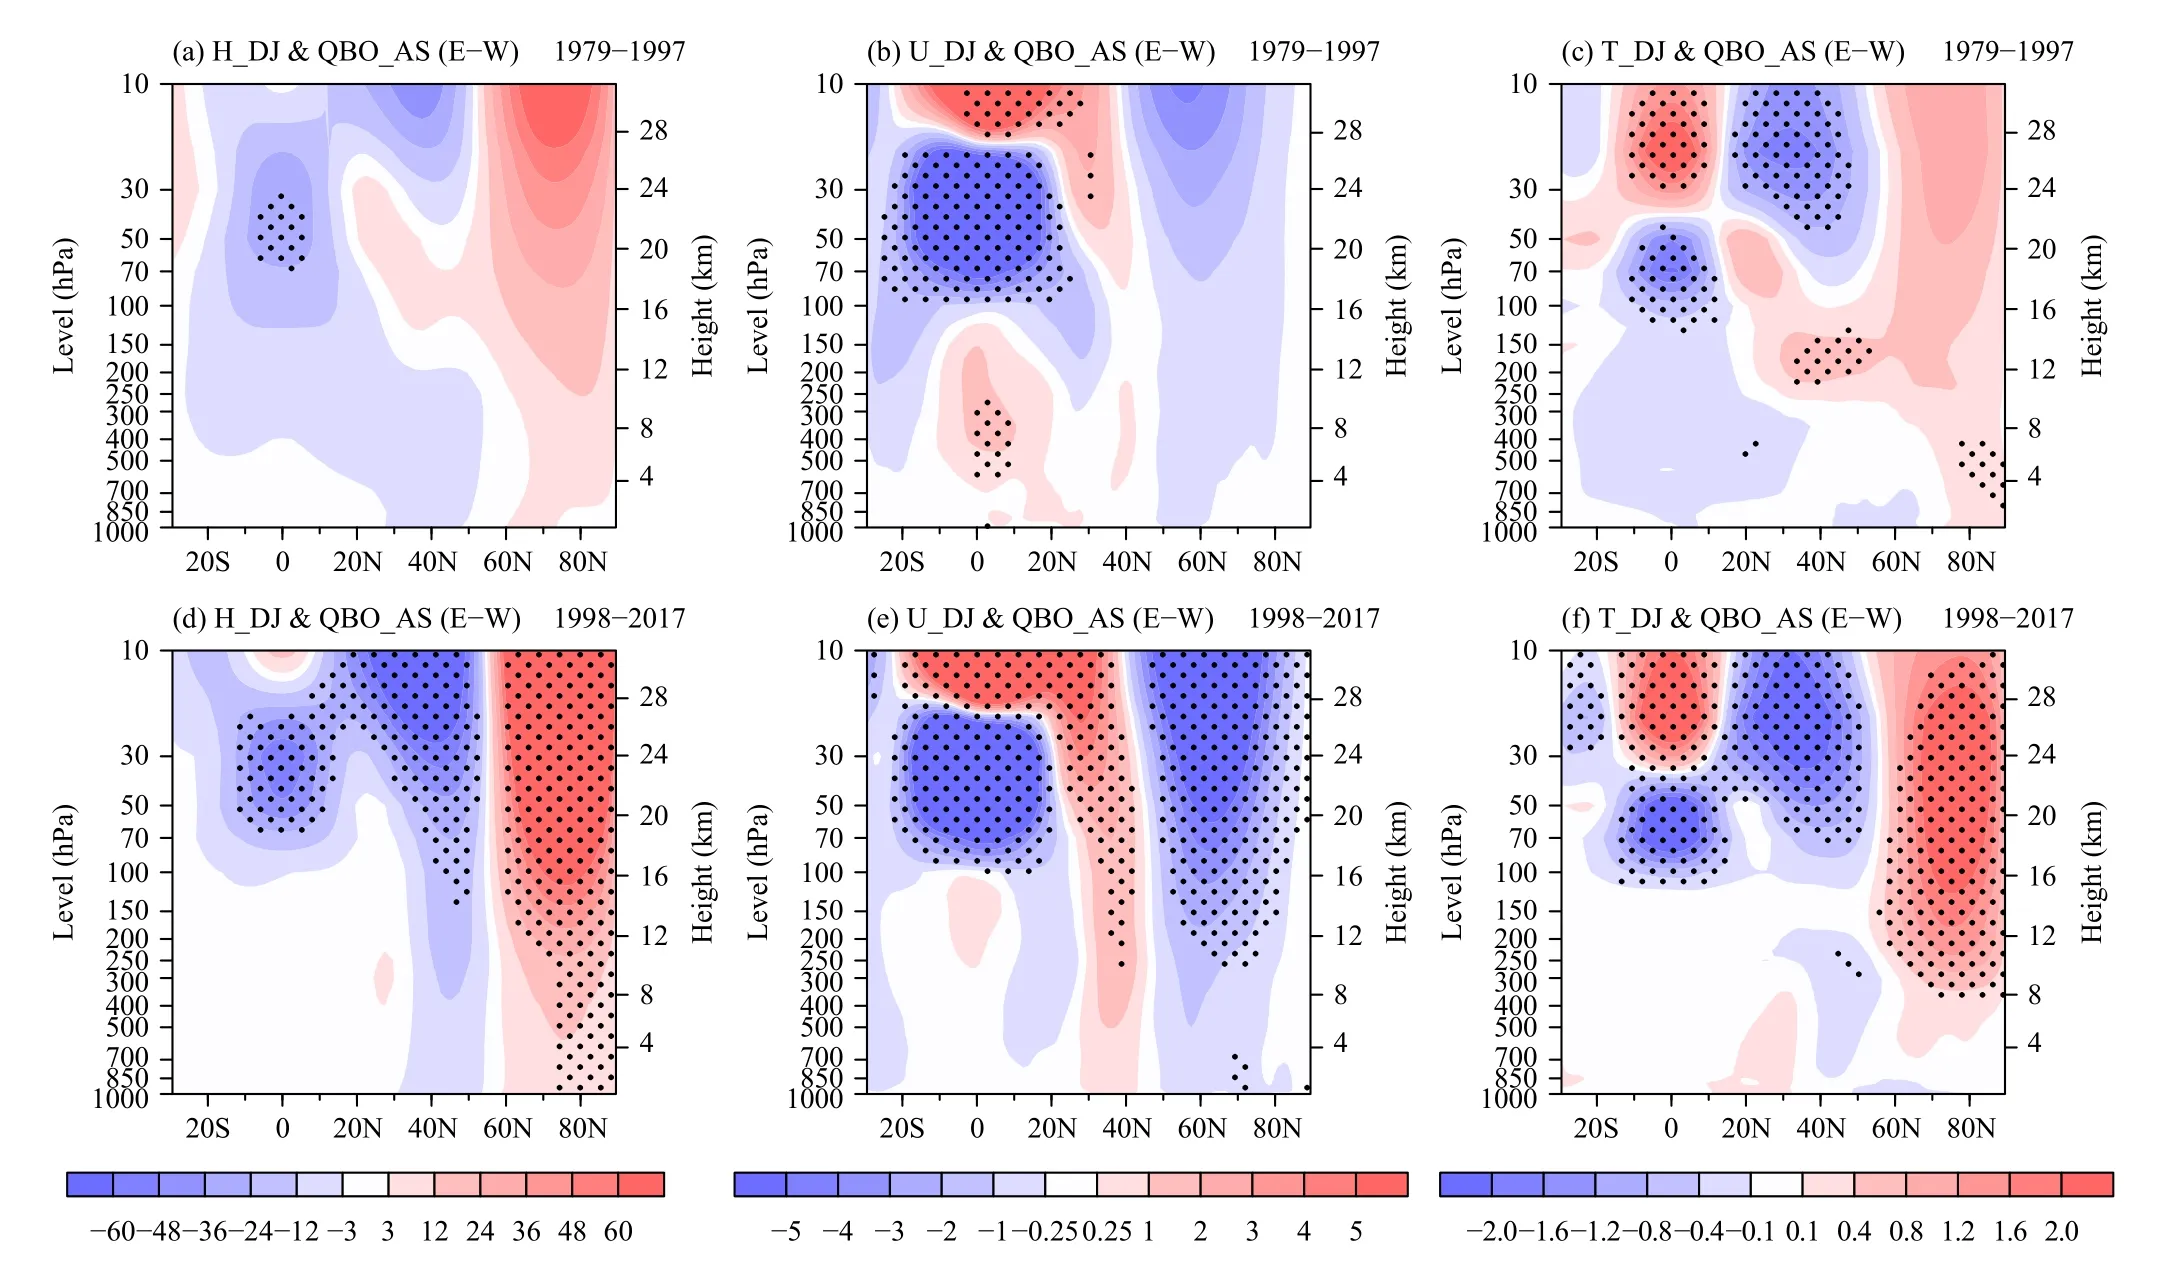
Fig. 5. As in Fig. 4, but for the JRA-55 data.

Fig. 6. (a, c, e) Composite differences between EQBO_AS and WQBO_AS for (a) OLR (W m-2), (c) precipitation (mm day-1), and (e) temperature (°C) at 100 hPa in ON during 1979–1997. The black dotted areas indicate statistical significance at the 90% confidence level based on the Student’s t-test. (b, d, f) As in (a, c, e), but for 1998–2017.
In addition to the differences in the polar regions,there are also significant differences in the subtropical tropopause and lower stratosphere between the two periods. The significant differences, especially for temperature, in the subtropical tropopause and lower stratosphere are related to the influence of the QBO-induced meridional circulation. It is marked by the two-vertical-cell structure of temperature anomalies both at the equator and in the subtropics (Figs. 4c, f; 5c, f). The EQBO_AS in the lower stratosphere corresponds to a vertically sheared tropical wind structure with a westerly shear near 20–10 hPa and an easterly shear near 100–20 hPa in DJ(Figs. 4b, e; 5b, e). The westerly and easterly shear regions have warm and cold temperature anomalies, respectively. These temperature anomalies are maintained by the QBO-induced meridional circulation, with upwelling/downwelling at the equator and downwelling/upwelling in the subtropics (Plumb and Bell, 1982). Enhanced by the residual mean meridional circulation of the stratosphere, the QBO-induced meridional circulation intensifies and extends into the northern winter midlatitudes. Thus, the temperature anomalies at the subtropical branches become larger than their tropical counterparts(Kinnersley and Tung, 1998). As shown in Figs. 4, 5,compared to 1979–1997, the westerly and easterly shear at the equator in the lower stratosphere is stronger during 1998–2017, corresponding to the abnormally larger magnitude of the temperature in the subtropics during this period.
3.2 Differences in the tropical convection anomaly in October–November related to the QBO_AS pre- and post-1998
The QBO can directly influence tropical deep convective activity. To maintain the thermal wind balance in the presence of strong vertical wind shear, an adiabatic meridional circulation is induced, with anomalous upward/downward motion over the equator under EQBO/WQBO conditions, and anomalous downwelling/upwelling motion at subtropical latitudes. At equatorial latitudes, this results in corresponding cold/warm anomalies that influence the temperature and static stability of the tropical tropopause, and thus the tropical deep convective activity. Both observations and modeling show that the tropical deep convective activity and precipitation are affected by the QBO (Giorgetta et al., 1999; Collimore et al.,2003; Ho et al., 2009; Liess and Geller, 2012; Son et al.,2017).
To reveal the possible mechanism underpinning the interdecadal changes of the Holton–Tan effect in terms of the role played by the deep convection over the tropical western Pacific and Indian Oceans, we analyze the differences in the tropical convection anomaly in October–November (ON) corresponding to QBO_AS in the two periods. The correlation coefficient between QBO_AS and QBO_ON is 0.95, exceeding the 99% confidence level. Figure 6 displays the composite differences between EQBO_AS and WQBO_AS for OLR, precipitation, and temperature at 100 hPa in ON during 1979–1997 and 1998–2017. In the tropics, lower OLR corresponds to more high cloud, generally more convection,and more precipitation. During 1998–2017, the prominent negative OLR anomalies in ON related to the EQBO_AS are observed over the tropical western Pacific (Fig. 6b), which indicates enhanced convective activity over the region, corresponding to more anomalous precipitation (Fig. 6d). Meanwhile, the significant positive OLR anomalies over the Indian Ocean (Fig. 6b)correspond to fewer precipitation anomalies (Fig. 6d).The tropical western Pacific is climatologically the coldest region in the tropics (figure omitted). Furthermore,the EQBO_AS is accompanied by cold tropopause temperature anomalies in ON over this region (Fig. 6f),which is conducive to enhancing convective activity over the tropical western Pacific. In summary, during 1998–2017, EQBO_AS is accompanied by a colder tropical tropopause in ON, which enhances the convective activity over the tropical western Pacific and suppresses it over the Indian Ocean, thus enhancing the Walker circulation. However, during 1979–1997, the intensity of the tropical deep convection anomalies in ON related to EQBO_AS is weaker, and its significant area shifts more eastward compared to that during 1998–2017 (Figs. 6a,c, e).
In addition, the longitude–pressure cross-sections of composite differences between EQBO_AS and WQBO_AS for the vertical velocity at the equatorial belt(10°S–10°N) in ON (Fig. 7) also clearly indicate that,compared to 1979–1997, a stronger upward motion anomaly extending from the surface to 100 hPa is observed over the tropical western Pacific (120°–170°E), as an ascending branch of the Walker circulation; and meanwhile, there is a compensating downward branch with a stronger deep descending motion anomaly over the Indian Ocean (10°–90°E) (Fig. 7b). All these results show that the tropical deep convection anomaly in ON related to the EQBO_AS in the two periods is different: Compared to 1979–1997, the intensity of the deep convection anomaly over the tropical western Pacific and Indian Oceans in ON related to EQBO_AS is stronger during 1998–2017, and its significant area shifts more to the west.
3.3 Differences in the planetary-scale wave anomalies in October–January related to the QBO_AS pre- and post-1998
The above analyses reveal that there are significant differences in the deep convection anomaly over the tropical western Pacific and Indian Oceans in ON corresponding to the QBO_AS in 1979–1997 and 1998–2017.Previous studies have revealed that the tropical deep convection anomaly related to the QBO can excite an anomalous Rossby wave train spanning the northern tropics and extratropics (Collimore et al., 2003; Garfinkel and Hartmann, 2011; Liess and Geller, 2012; Nie and Sobel,2015; Gray et al., 2018). Therefore, what are the differences in the northern tropospheric wave-train structure in the two periods? Figure 8 displays the composite differences between EQBO_AS and WQBO_AS for Rossby wave activity flux and geopotential height anomalies at 200 hPa in ON in the two periods. During 1998–2017,corresponding to the QBO_AS, the anomalous Rossby waves in ON propagate from the tropical western Pacific to the northern mid-to-high latitudes along the greatcircle path, thus causing circulation anomalies over the northern mid-to-high latitudes (Fig. 8b). The anomalous Rossby wave train in ON excited by the QBO_AS propagating from the tropics to the northern mid-to-high latitudes is also observed during 1979–1997. However,compared to 1998–2017, its position is shifted farther to the east, and the centers of the circulation anomalies are also shifted eastward correspondingly (Fig. 8a). For example, compared with 1998–2017, the center of the positive height anomaly in southern China moves eastward to eastern Japan during 1979–1997; the center of the negative height anomaly located over Lake Baikal shifts eastward to Northeast China during 1979–1997, and its intensity weakens and its extent decreases; and besides,the center of the positive height anomaly over the Bering Strait moves eastward to the central and eastern Pacific(30°N, 150°W) during 1979–1997.
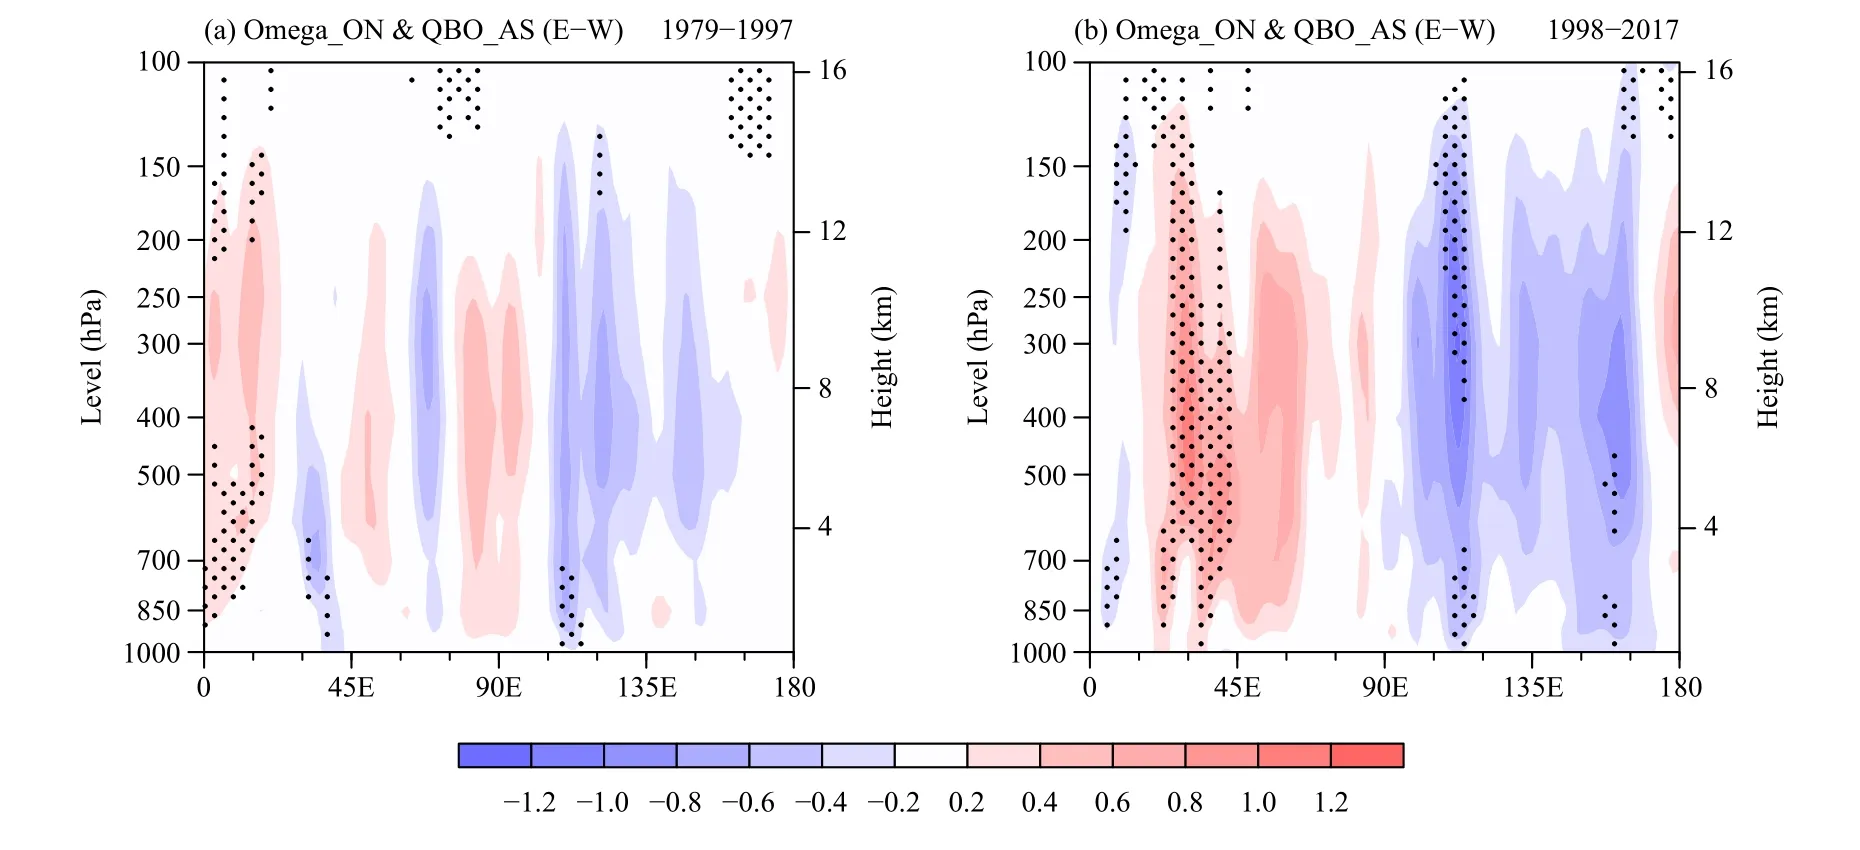
Fig. 7. Longitude–pressure cross-sections of the composite differences between EQBO_AS and WQBO_AS for vertical velocity (10-2 Pa s-1)averaged from 10°S to 10°N in ON during (a) 1979–1997 and (b) 1998–2017. Negative and positive values indicate upward and downward motion, respectively. The black dotted areas indicate statistical significance at the 90% confidence level based on the Student’s t-test.
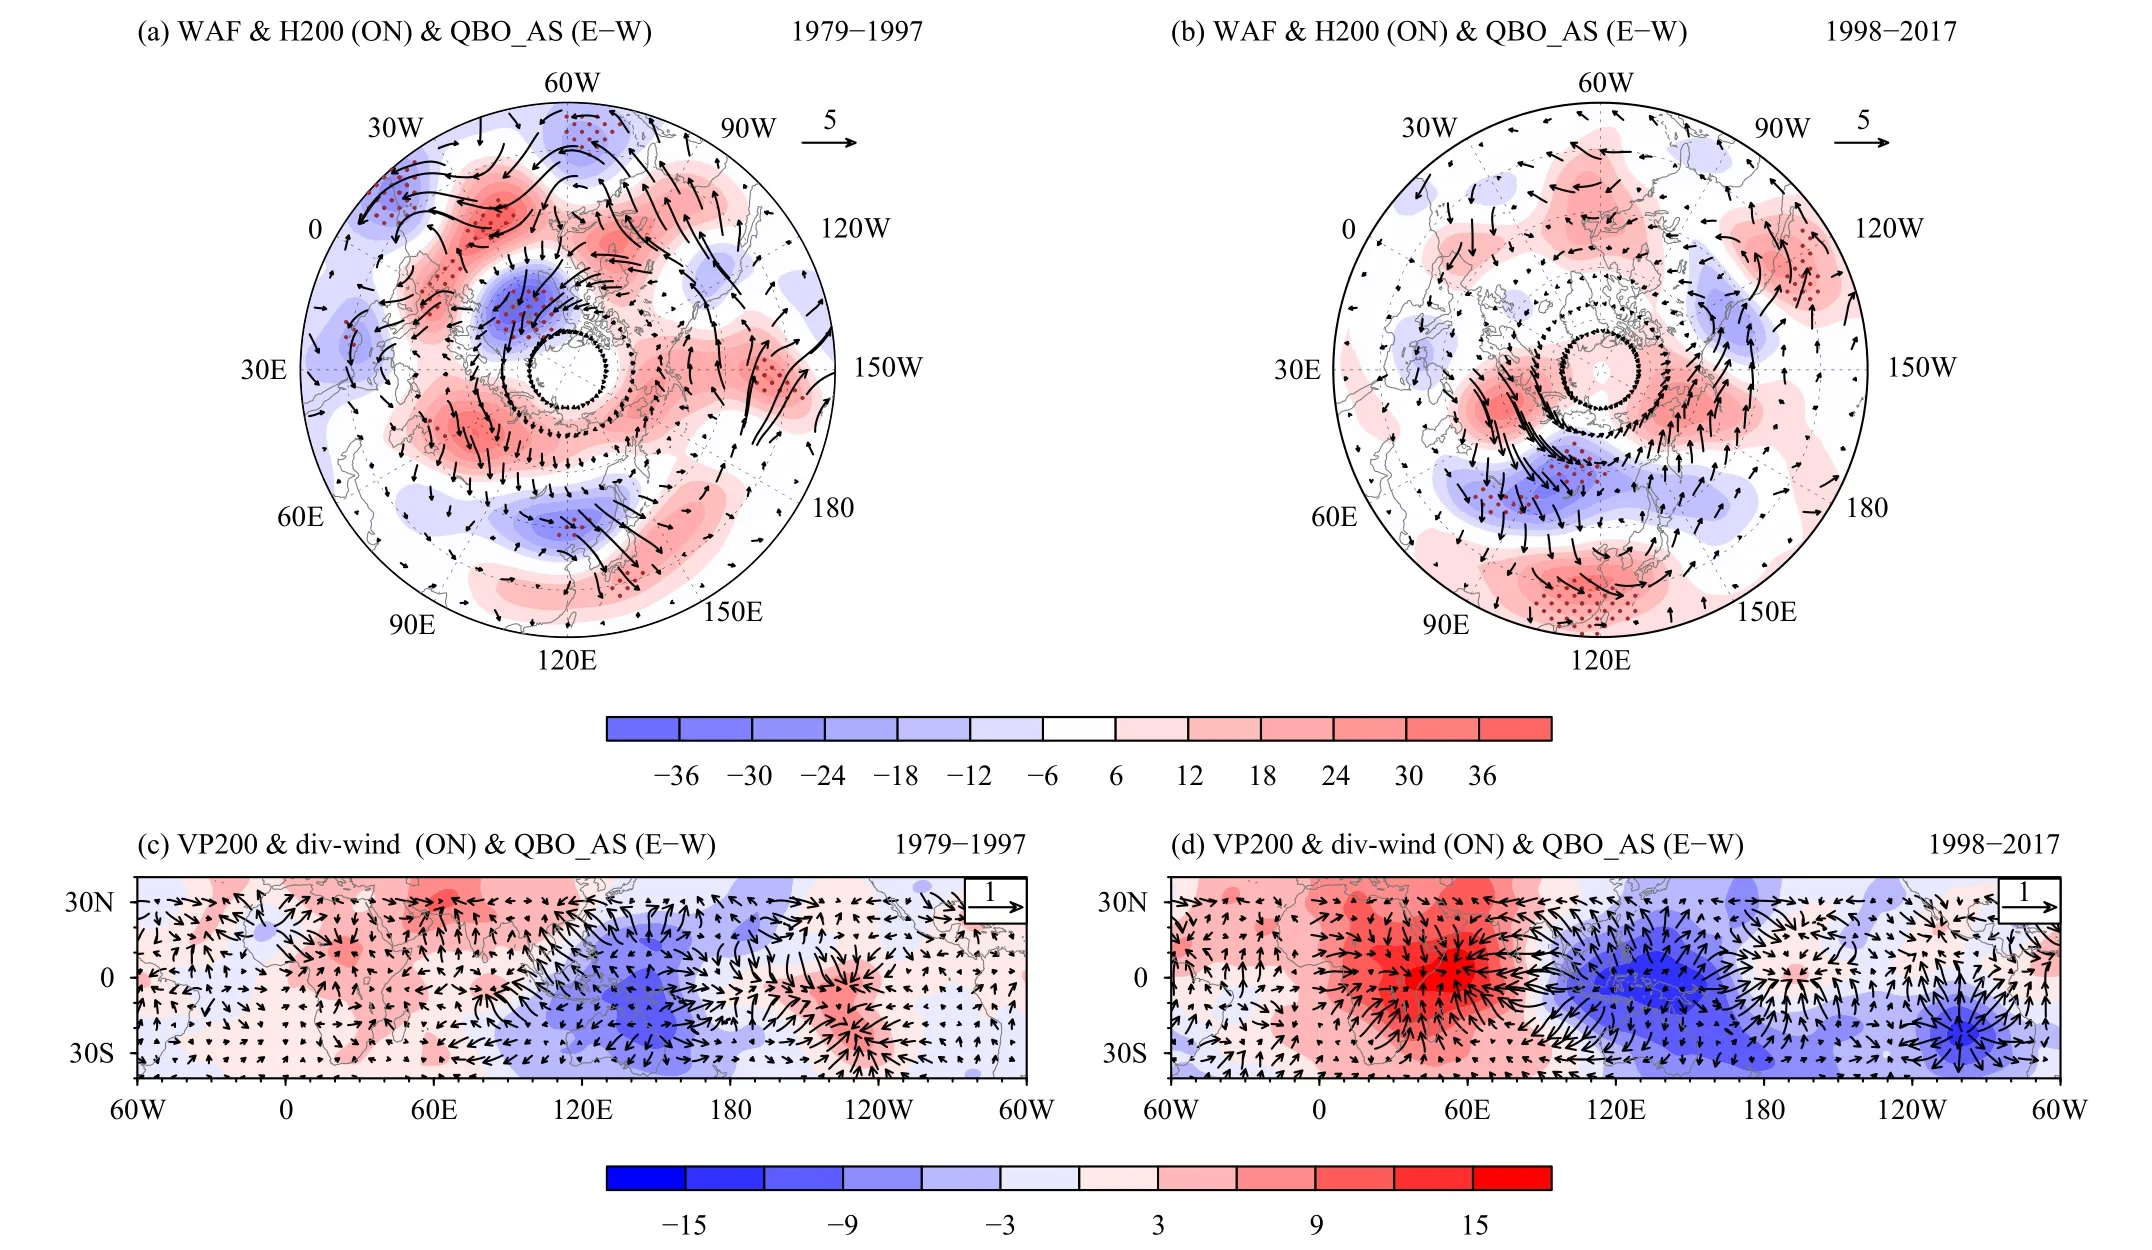
Fig. 8. Composite differences between EQBO_AS and WQBO_AS for geopotential height (shading; gpm) and Rossby wave activity fluxes(vectors; m2 s-2) at 200 hPa in ON during (a) 1979–1997 and (b) 1998–2017. The red dotted areas indicate statistical significance at the 90% confidence level based on the Student’s t-test. (c, d) As in (a, b), but for velocity potential (shading; 105 m2 s-1) and divergent wind (vectors; m s-1) at 200 hPa.
During 1998–2017, the 200-hPa divergent wind anomalies over the tropical western Pacific in ON related to the EQBO_AS are stronger and their center shifts westward (Fig. 8d), which corresponds to the anomalously stronger precipitation in the region and westward shift of the anomalous precipitation center (Fig. 6d). This anomalous precipitation leads to a stronger positive geopotential height anomaly at 200 hPa over South China (Fig.8b) by exciting a Gill-type atmospheric response, and affects the downstream region through Rossby wave energy dispersion. However, the 200-hPa divergent wind anomalies over the tropical western Pacific in ON related to the EQBO_AS are relatively weaker, and their center moves eastward, during 1979–1997 (Fig. 8c),which corresponds to the anomalously weaker precipitation in the region and eastward shift in the precipitation’s center (Fig. 6c). The contribution of this convection anomaly to the positive height anomaly at 200 hPa over South China is weaker (Fig. 8a).
The differences in the tropospheric wave-train structure in the two periods may lead to differences in the intensity of the upward propagation of tropospheric planetary-scale waves. Many studies have revealed that the tropospheric wave-train structure anomaly is the main driver of the enhanced/weakened upward-propagating tropospheric planetary-scale waves (Kim et al., 2014;Rao and Ren, 2016; Zhang et al., 2018; Hu et al., 2019;Xu et al., 2021). Meanwhile, the linear interferences of wavenumber-1 and wavenumber-2 between anomalous and climatological planetary-scale waves largely determine the vertical wave activity of planetary-scale waves(Garfinkel et al., 2010; Nishii et al., 2010; Smith et al.,2010; Fletcher and Kushner, 2011; Rao and Ren, 2016).Besides, some studies have demonstrated an emergence and gradual increase in vertical wave activity before the occurrence of the weakened polar vortex anomalies(Polvani and Waugh, 2004; Kim et al., 2014; Dai et al.,2019; Xu et al., 2021).
To examine the structures of tropospheric planetaryscale waves anomalies in ON induced by the QBO_AS propagating into the stratosphere, the tropospheric wavetrain structure displayed in Figs. 8a, b is decomposed into its wavenumber components using a Fourier transformation along the latitudinal circle. Figures 9a, 9b, 9d, and 9e display the zonal wavenumber-1 and wavenumber-2 components of the height at 200 hPa in ON of 1979–1997 and 1998–2017. The planetary-scale wave anomalies(contours) are compared with the climatology (shading).During 1998–2017, the zonal wavenumber-1 and wavenumber-2 of the height anomalies are in phase with their corresponding climatological planetary-scale waves components (Figs. 9d, e). Since the wave energy is proportional to the square of wave amplitude, the EQBO_AS tends to enhance upward-propagating planetary-scale waves in ON during 1998–2017 (Fig. 9f), and the anomalous planetary-scale wave activities can persist to DJ (Fig. 10b), which subsequently contributes to increasing the stratospheric geopotential height in the polar region in DJ (Figs. 4d, 5d). The positive stratospheric height anomalies coincide with a deceleration of the stratospheric polar jet (Figs. 4e, 5e) according to the wavemean flow interactions and an increase in the Arctic stratospheric temperature anomalies (Figs. 4f, 5f), corresponding to a weak SPV_DJ anomaly. Meanwhile, it can be seen that the planetary-scale wave, particularly wavenumber-1, is enhanced due to the tropical convection anomalies over the tropical western Pacific and Indian Oceans in ON. That is, the EQBO_AS tends to deepen the Aleutian low in ON (Fig. 9c). Such anomalies associated with the QBO partly come from the tropical convection. According to Rao and Ren (2016), the convection over the tropical western Pacific and Indian Oceans shows opposite signals. Enhanced convection over the Pacific can indeed deepen the Aleutian low. However,enhanced convection over the Indian Ocean tends to weaken it. Thus, considering that the Indian Ocean convection is suppressed in the composite analysis in this study, the enhanced extratropical wave pattern can be caused by forcing of the tropical western Pacific and Indian Oceans.

Fig. 9. (a) Wavenumber-1 component of the geopotential height (gpm) at 200 hPa during ON for 1979–1997. Composite differences between EQBO_AS and WQBO_AS for geopotential height (contours) are compared with the climatology (shading). (b) As in (a), but for the wavenumber-2 component. (c) Latitude–pressure cross-section of the composite differences between EQBO_AS and WQBO_AS for the zonal-mean EP flux for wavenumbers 1–2 (vectors; 108 m2 s-2) and EP divergence (shading; m s-1 day-1) in ON for 1979–1997. (d–f) As in (a–c), but for 1998–2017. The yellow dotted areas in (c, f) indicate statistical significance at the 90% confidence level based on the Student’s t-test.
During 1979–1997, however, the zonal wavenumber-1 of the geopotential height anomalies at high latitudes in ON related to the composite differences between EQBO_AS and WQBO_AS are out-of-phase with its climatology, whereas its anomalies at midlatitudes are inphase with the climatology (Fig. 9a). This means that the EQBO_AS tends to reinforce the climatological wavenumber-1 wave at high latitudes in ON in the troposphere, but cancel the climatological wavenumber-1 wave at midlatitudes in ON. Meanwhile, the zonal wavenumber-2 of the height anomalies is out-of-phase with the climatological wavenumber-2 wave in some regions but in-phase with its climatology in other regions(Fig. 9b). This distribution makes anomalous upwardpropagating planetary-scale waves weak in ON, especially near the stratospheric polar region (Fig. 9c), and the anomalous planetary-scale waves activities can persist to DJ (Fig. 10a), which thus weakens the relationship between QBO_AS and SPV_DJ during this period.
From the above analysis, the results show that the troposphere may partly account for the interdecadal changes of QBO_AS and SPV_DJ. The reason for the interdecadal changes initially comes from the differences in the deep convection anomaly over the tropical western Pacific and Indian Oceans in ON corresponding to the QBO_AS in the two periods. But why is the intensity of the deep convection anomaly over the tropical western Pacific and Indian Oceans and upward-propagating tropospheric planetary-scale wave anomalies in ON stronger during 1998–2017 than 1979–1997? To address this question, we analyze the possible causes from the climatological perspective. Figure 11 displays the differences (1998–2017 minus 1979–1997) of OLR, precipitation, temperature at 100 hPa over the tropical region, vertical velocity at the equatorial belt, and zonal-mean EP flux and its divergence in ON. It can be seen that, compared with 1979–1997, the prominent negative OLR anomalies in ON are observed over the tropical western Pacific and Indian Oceans (Fig. 11a), which corresponds to significantly more anomalous precipitation (Fig. 11b), a colder tropical tropopause (Fig. 11c), and a stronger upward motion anomaly extending from the surface to 100 hPa over the tropical western Pacific and Indian Oceans during 1998–2017 (Fig. 11d). Meanwhile, the upwardpropagating tropospheric planetary-scale wave anomalies are also stronger (Fig. 11e). The deep convection over the tropical western Pacific and Indian Oceans and the upward-propagating tropospheric planetary-scale waves in ON have interdecadal differences between the two periods, which may be the reason for the stronger deep convection anomaly over the tropical western Pacific and Indian Oceans in ON related to QBO_AS, and thus the enhanced relationship between QBO_AS and SPV_DJ during 1998–2017.

Fig. 10. (a, b) As in Figs. 9c and 9f, but for EP flux and EP divergence in DJ.

Fig. 11. Differences (1998–2017 minus 1979–1997) of (a) OLR (W m-2), (b) precipitation (mm day-1), (c) temperature (°C) at 100 hPa, (d) longitude–pressure cross-section of vertical velocity (10-2 Pa s-1) averaged from 10°S to 10°N, and (e) latitude–pressure cross-section of zonal-mean EP flux for wavenumbers 1–2 (vectors; 108 m2 s-2) and EP divergence (shading; m s-1 day-1) in ON. The dotted areas indicate statistical significance at the 90% confidence level based on the Student’s t-test.
4. Summary and discussion
Several studies have investigated the interdecadal changes of the equational QBO with the SPV and pointed out that the main causes are rooted in the influence of the stratosphere. The present study extends this line of research further by analyzing this phenomenon in terms of the role played by deep convection over the tropical western Pacific and Indian Oceans. First, we reveal that QBO_AS is most significantly positive correlated with SPV_DJ during 1979–2017. However, this relationship has a significant interdecadal difference in that no significant correlations are observed before the late 1990s, but significantly positive correlations are detected after the late 1990s.
This unstable relationship may be related to the differences in the deep convection anomaly over the tropical western Pacific and Indian Oceans in ON corresponding to the QBO_AS in the two periods. During 1998–2017,the EQBO_AS is accompanied by colder temperatures in the tropical tropopause layer in ON, which enhances the convective activity over the tropical western Pacific and suppresses it over the Indian Ocean. The convection anomaly generates a Rossby wave train that propagates into the mid-to-high latitudes of the troposphere and constructively interferes with the climatological planetaryscale wavenumber-1 and wavenumber-2 components,resulting in enhanced vertically propagating tropospheric planetary-scale wave anomalies that subsequently weaken the SPV_DJ. During 1979–1997, however, the deep convection anomaly over the tropical western Pacific and Indian Oceans in ON related to the EQBO_AS is weak and its significant area shifts eastward, which stimulates the anomalous Rossby waves to constructively/destructively interfere with the climatological wavenumber-1 component at in the midlatitudes/high latitudes, thereby weakening the upward-propagating planetary-scale waves and leading to a weaker linkage with SPV_DJ.
From the above analyses, the results show that the troposphere also has an important influence on the interdecadal changes of QBO_AS and SPV_DJ. The possible reason for this initially comes from the differences in the deep convection anomaly over the tropical western Pacific and Indian Oceans in ON corresponding to the QBO_AS in the two periods. Further analyses reveal that, in terms of the interdecadal changes, compared with 1979–1997, the deep convection anomaly over the tropical western Pacific and Indian Oceans in ON are stronger during 1998–2017, and the upward-propagating planetary-scale wave anomalies in ON are also stronger;and these interdecadal variabilities may be the reason for the stronger deep convection anomaly over the tropical western Pacific and Indian Oceans in ON corresponding to the EQBO_AS, and thus the enhanced relationship between QBO_AS and SPV_DJ during this period.However, it should be noted that we just try to explain the interdecadal changes of QBO and SPV from the perspective of the troposphere in this study, not to deny the previous research results from the perspective of the stratosphere, but to supplement this interdecadal change. Besides, this mechanism needs further study.
Acknowledgments.The authors are grateful to the editors and anonymous reviewers for their constructive comments.
 Journal of Meteorological Research2022年5期
- Journal of Meteorological Research的其它文章
- Assessing 10 Satellite Precipitation Products in Capturing the July 2021 Extreme Heavy Rain in Henan, China
- Refined Evaluation of Satellite Precipitation Products against Rain Gauge Observations along the Sichuan–Tibet Railway
- Direct Radiative Effects of Dust Aerosols over Northwest China Revealed by Satellite-Derived Aerosol Three-Dimensional Distribution
- Assimilation of All-Sky Radiance from the FY-3 MWHS-2 with the Yinhe 4D-Var System
- Stochastically Perturbed Parameterizations for the Process-Level Representation of Model Uncertainties in the CMA Global Ensemble Prediction System
- Interannual Relationship between Summer North Atlantic Oscillation and Subsequent November Precipitation Anomalies over Yunnan in Southwest China