
Improved sensitivity on detection of Cu and Cr in liquids using glow discharge technology assisted with LIBS
2022-09-14 08:18:08DuixiongSUN孫對(duì)兄YaruiWANG王亞銳MaogenSU蘇茂根WeiweiHAN韓偉偉andChenzhongDONG董晨鐘
Plasma Science and Technology 2022年8期
關(guān)鍵詞:晨鐘
Duixiong SUN (孫對(duì)兄),Yarui WANG (王亞銳),Maogen SU (蘇茂根),2,Weiwei HAN (韓偉偉) and Chenzhong DONG (董晨鐘)
1 Key Laboratory of Atomic and Molecular Physics &Functional Material of Gansu Province,College of Physics and Electronic Engineering,Northwest Normal University,Lanzhou 730070,People’s Republic of China
2 Joint Laboratory of Atomic and Molecular Physics,Northwest Normal University and Institute of Modern Physics of Chinese Academy of Sciences,Lanzhou 730070,People’s Republic of China
Abstract Laser-induced breakdown spectroscopy-assisted glow discharge (LIBS-GD) for analysis of elements in liquid was proposed,and it was applied to detect heavy metals in highly sensitive mixed solutions of Cu and Cr.During the experiments of GD and LIBS-GD,the experimental parameters have been optimized and the optimal voltage is 450 V,laser energy is 60 mJ,and the delay time is 4000 ns.Furthermore,the calibration curves of Cu and Cr under GD and LIBS-GD experiments have been established,and the limits of detection (LODs) of Cu and Cr were obtained with the method of GD and LIBS-GD,respectively.The LOD of Cu decreased from 3.37 (GD) to 0.16 mg l?1 (LIBS-GD),and Cr decreased from 3.15 to 0.34 mg l?1.The results prove that the capability of elemental detection under LIBS-GD has improved compared with the GD method.Therefore,LIBS-GD is expected to be developed into a highly sensitive method for sewage detection.
Keywords: laser-induced breakdown spectroscopy,glow discharge,heavy metal,limits of detection
1.Introduction
With the efficient development of agriculture and the acceleration of industrialization,the extensive use of chemical fertilizers,the discharge of industrial wastewater and flue gases have caused the pollution of copper,chromium,lead and other heavy metals,thereby destroying the hydrological environment.Heavy metals are enriched through the food chain,which can seriously threaten the safety of humans,animals and plants [1,2].Therefore,it is necessary to evaluate water pollution by monitoring heavy elements in water.There are many traditional detection methods such as atomic spectrophotometry [3],chromatography [4],electrochemical methods [5],etc,which can obtain good quantitative results,the advantages and disadvantages have been summarized in many works [6,7].In brief,the outstanding performance of these methods is limited in the laboratory,and requires relatively complex sample pretreatment.Therefore,it is essential to explore a method that enables the detection of heavy metal elements with high sensitivity and rapidly in the liquid without complex or only simple sample pretreatment.
Liquid cathode GD is a technique for producing quasisteady plasma in liquid [8].In principle,two electrodes are immersed in a liquid solution,and if the voltage of the emitter is high enough,the tip of the thin electrode can produce gas.Metal ions at the gas-liquid interface will be excited,then a specific wavelength radiation signal is generated,and the analysis of metal elements can be carried out by analyzing the radiation signal[8,9].This technique has been widely used to analyze the metal elements in water [10–13],as well as hydrogen production,synthesis,and wastewater treatment due to the production of hydroxyl radical (·OH) and hydrogen radical (·H) [14–16].However,traditional GD technology has low excitation efficiency for heavy elements,many improvements to the discharge configuration for electrolyte cathode discharge have been developed according to the original design by Cserfalvi[17,18],including direct current atmospheric pressure glow discharge(DC-APGD) [19],solution-cathode glow discharge (SCGD)[20],liquid sampling-atmospheric pressure glow discharge(LSAPGD) [21],and alternating current driven-liquid discharge(ACD-LD) [22].
As a rapid detection technique,LIBS has the advantages of online,multi-elements analysis and in-situ detection[23–26],it has been applied in the fields of biomedical applications,material analysis,cultural heritage,ecology,military security,etc [27–29].However,when LIBS technology is directly used for elemental analysis inside liquids,since a larger percentage of the laser energy is consumed for liquid vaporization,the efficiency of atomization and excitation is greatly reduced [30–33].Therefore,in this work,we explore the combining of LIBS and GD technique in terms of LIBS-GD,GD is used to produce stable plasma and then a laser pulse is focused on the plasma to make further excitation for achieving enhancement of emission signal.The LIBS-GD technique was used to realize the high-sensitivity detection of Cu and Cr in liquid.By comparing the spectral intensity of emission lines Cu and Cr in GD and LIBS-GD,the calibration curves and LODs in GD and LIBS-GD were obtained.
2.Experiment
2.1.Reagents and samples
Deionized water (18.50 MΩ cm) was produced by a water purification instrument (Sanshen Medical Devices Co.,Ltd,Shanghai),which was utilized to prepare all solutions.For the selection of solutes,different forms of salts corresponding to the same metal element have different effects on GD technology.For chloride salts,the ionization degree in water is higher than those of other forms of salts [34],so Cl salt is selected in this work.CuCl2,CrCl3and Zn (NO3)2are of superior-reagent grade,the first two reagents were supplied by Shanghai Guangnuo Chemical Technology Co.,Ltd (Shanghai,China),and the last reagent was provided by Tianjin Kaixin Chemical Industry Co.,Ltd (Tianjin,China).HNO3was purchased from Ningbo Sinopharm Chemical Reagent Co.,Ltd.The blank solution with pH=1.0 containing 0.75 mg l?1Zn(NO3)2was prepared by HNO3.The pH value of the solutions was obtained using an acidimeter (PHS-3E,INESA,China).However,the essence of GD is electrolytic water,which requires knowing the conductivity of electrolytes.It is necessary to ensure that there are sufficient cation ions in the solution,the cations mainly come from H+in aqueous solution and HNO3solution.A certain mass of Zn(NO3)2is added to make the cation ions in the solution rich,the conductivity of the solution increases (~59.6 μs cm?1),and the discharge stability is further improved.The blank solution was used to prepare a mixed stock solution(500 mg l?1)of Cu and Cr.The stock solution was diluted by the blank solution,and a series of standard solutions of Cu and Cr(0.7,1.5,3,6.25,12.5,50,100,200,300,400 mg l?1)were prepared.Finally,we compared the configured solution with Inductive Coupled Plasma (ICP) measurement results,and ICP measurement results were basically consistent with the configured solution concentration,with an error of less than 2%.
2.2.Experimental setup
The experimental device of LIBS-GD is shown in figure 1(a).A reactor with a dimension of 100 mm × 50 mm × 50 mm quartz vessel was used to contain the solution.A graphite rod cathode with a diameter of 5 mm and a needle(Pt)anode with a diameter of 0.5 mm sealed into a quartz tube were immersed in the solution,and the GD plasma can be produced in an aqueous solution around the Pt anode.The anode was close to the quartz window in order to reduce the light absorption and scattering.The high-voltage DC unit (DH 1720A,Shanghai Liyou Radio Factory)is a power supply that provides voltage from 0 to 1000 V and current from 0 to 0.5 A.The output voltage can be continuously adjusted according to the experimental desire,and the minimum resolution of the current is 0.1 mA.
A Q-switched Nd:YAG laser ((LaPa-80,Be Amtech Optronics Co.,Ltd)generated a pulse laser with a wavelength of 1064 nm and pulse width of 8 ns,with a 5 mm beam diameter and 3 mrad divergence.The maximum output laser pulse energy is 100 mJ/pulse,which can be continuously adjusted according to the experimental requirements.The energy meter(Nova II,Ophir)was used to detect the stability of laser energy during the experiment.The laser energy fluctuation range is 0–5 mJ.A convex lens with a 100 mm focal length was used to focus the laser beam on the GD plasma.Plasma radiation is collected through a 200-micron fiber core,coupled with a 50 mm fused silica lens mounted at 90° with respect to the incident laser beam,and the optical fiber connected with the entrance slit of an echelle spectrometer (Aryelle-200,Laser Technik Berlin,LTB) to transfer light.The resolution of a spectrometer is a measure of the ability to separate two adjacent lines.The resolution of the LTB spectrometer in the range of 200–800 nm can reach 50000.An intensified charge-coupled device (ICCD) camera(PI Max-400,Princeton Instrument) records the spectral information of the plasma.The synchronization of laser output time and detector opening time is realized by a digital delay generator(DG535,Stanford Research Systems).During the experiment,the focusing position of the laser pulse after focusing is about 3 mm smaller than that of the focal point due to the larger refractive index of the liquid than that of the air.Therefore,it is difficult to ensure that the focusing position of the laser is in the focus of the lens in the liquid experiment.In order to align the laser focus and GD plasma,we used two CCDs to observe the plasma events on the micro-scale from both sides parallel to the incident direction of the laser,namely,when there is no plasma event around the GD plasma,it indicates that the laser focus and GD plasma are aligned,so as to ensure the coincidence of the laser focus and GD plasma.
The timing sequential of the whole experiment process is shown in the lower right in figure 1(c).Firstly,with an increasing voltage between Pt anode and graphite cathode,weak GD plasma appears when the voltage reaches 410 V,with the increase of voltage,the brightness of GD plasma becomes stronger,and the scale in spatial also increases.When the voltage reaches 450 V,the plasma tends to be stable.At this time,the pulsed laser pulse generated by the laser is focused on the GD plasma by the focusing lens,so that the GD plasma is further excited,and the brightness and size of the plasma are further increased.The characteristic line of Cu and Cr can be measured by an ICCD spectrometer with a delay time of 1.5 μs and a gate width of 5 μs.Because the laser frequency is set to 10 Hz during the experiment,the pulse laser will interact with GD plasma according to the fixed frequency,which makes the experiment proceed continuously.
3.Results and discussion
3.1.Optimization of experimental parameters for GD and LIBS-GD
In the electrolyte cathode GD experiment,the discharge voltage has an important influence on the spectral intensity and stability of the plasma.Based on our optimization for experimental parameters and previous works[11,30,35],it was found that if the discharge voltage was lower than 410 V,the radiation of the plasma was weak and the stability was not good.However,when the discharge voltage is over 460 V,GD will become unstable and even violent due to the boil of the solution in the quartz vessel under longtime discharge.When the discharge voltage exceeds 650 V,GD will become arc discharge,and hence the continuous radiation will become very strong,resulting in a bad signalto-noise ratio.Moreover,the Pt electrode becomes quite hot,which results in damage to the Pt in a short time.Therefore,the effect of discharge voltage on plasma radiation was studied in the range of 410–460 V.Two emission lines of Cu I 324.75 nm and Cr I 357.87 nm were selected to optimize the discharge voltage.Considering that 324.75 nm and 327.45 nm are atomic resonance lines of primary ionization emission of the Cu element,the optimized experimental parameters with a concentration of 200 mg l?1were selected to avoid the self-absorption effect.At the same time,the spectral line without self-absorption was also selected.Figure 2 shows the variation of the spectral intensities and signal-to-background ratio (SBR)with discharge voltage.As can be seen,the spectral intensities of these two elements increase as the increase of discharge voltage,and the SBR reaches the maximum at 450 V.In addition,the stability of the emission signal has been verified at different discharge voltages.Figure 3 shows the intensities of the emission line of Cu I 327.45 nm within 10 min,each dot represents the average of 10 measurements.When the discharge voltage is 450 V,the emission line has good stability and relatively strong intensity within 10 min.Therefore,the study of this work on the detected capability of GD and LIBS-GD was carried out under the discharge voltage of 450 V.
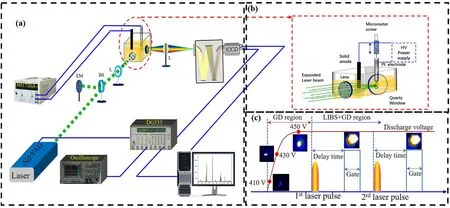
Figure 1.(a)LIBS-GD experimental device,(b)the enlarged view of the coupling of laser and GD plasma,(c)the timing sequential of LIBSGD experimental apparatus.(LIBS,laser-induced breakdown spectroscopy;GD,glow discharge).

Figure 2.The relations between the intensities and SBR of Cu and Cr characteristic lines with discharge voltage.The delay time 1.5 μs,and the gate width 5 μs.The electrolyte with a concentration of 200 mg l?1 for Cu,and pH=1.0.The error bars represent the standard deviation from 10 measurements.

Figure 3.The intensities of emission line Cu I 327.45 nm within 10 min,each dot represents the average of 10 measurements,and the error bars represent standard deviation.The delay time 1.5 μs,and the gate width 5 μs.The electrolyte with a concentration of 200 mg l?1 for Cu,and pH=1.0.
During the laser interaction with GD plasma,the process is different from LIBS carried out inside liquid [36],laser energy is more easily absorbed by electron–neutron atoms and electron–ion counter bremsstrahlung radiation.The vaporization of liquid consumes a lot of laser energy.Furthermore,GD plasma can reduce the breakdown event and successive cavitation formation in multiple sites along the incident laser beam will occur,and therefore,this is favorable to the optical collection system.In fact,the above events depend on laser energy.In the case of weak laser energy,the liquid will absorb a large amount of energy.The higher laser energy will lead to the formation of bubbles and the release of shock waves,and even make the emission of plasma irradiation poor.Therefore,the laser energy was optimized in LIBS-GD experiments on the basis of the intensities of the characteristic emission line and its SBR.Figure 4 shows the intensities of the emission line of Cu I 327.45 nm and SBR at different incident laser energies under a discharge voltage of 450 V.It approved that while the laser energy is 60 mJ,not only a relatively strong intensity is obtained,but also the SBR of the line is the best.In addition,the SBR of the spectral line in the case of LIBS-GD is significantly higher than that in the case of GD,this implies that the ability of detection has been improved.
When the laser pulse ends,the final plasma state evolves into GD plasma instead of being quenched.Therefore,this work mainly studies the time-resolved characteristics of emission line intensity when a laser focuses on GD plasma.Figure 5 shows variations of the intensities of emission lines Cu I 327.45 nm and the SBR as the increase of the delay time.The intensities reached the maximum at 1500 ns,and the delay time for the best SBR was 4000 ns.Therefore,the study of the detected limit was carried out under this time window in the LIBS-GD experiment.

Figure 4.The intensities of the emission line Cu I 327.45 nm and SBR at different incident laser energies under discharge voltage of 450 V.The delay time 1.5 μs,and the gate width 5 μs.The electrolyte with a concentration of 200 mg l?1 for Cu,and pH=1.0.The error bars represent the standard deviation from 10 measurements.

Figure 5.The intensities of emission lines Cu I 327.45 nm and the SBR at different delay time under discharge voltage of 450 V.The electrolyte with a concentration of 200 mg l?1 for Cu,and pH=1.0.The delay time 1.5 μs,and the gate width 5 μs.The error bars represent the standard deviation from 10 measurements.
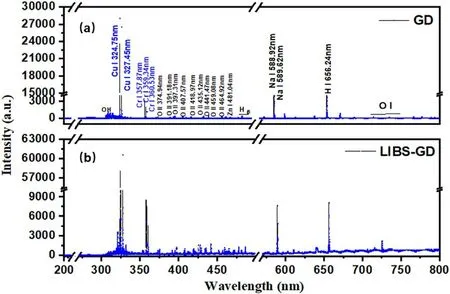
Figure 6.Spectra of 400 mg l?1 mixed solution in the wavelength range from 200 to 800 nm under (a) GD experimental conditions,and (b) LIBS-GD experimental conditions.
The typical spectra of the GD and LIBS-GD are shown in figure 6.The characteristic emission lines and bands were detected.The main excited species arise from O II,OH,H I,Cr I,Cu I,Zn I and Na I,which are marked on the GD graph.The emission signal of 283–309 nm is attributed to the radiation of OH (A2Σ+→X2Π).Due to a portion of the water being vaporized during discharge,OH+was produced by a collision between electrons and water molecules,and further resulted in a large number of clusters OH by the interaction of electrons with OH+[33].The emission lines with higher intensities at 324.75 nm and 327.45 nm are ascribed to Cu,357.87 nm,359.34 nm and 360.53 nm belong to Cr.The emission lines of Hαand Hβstem from the electrolyte,which is from the collisional excitation of high-energy electrons.The emission lines of O II ranged from 391.2 to 470.1 nm,which were generated from water vapor by electron impact ionization and excitation.The emission line of Na I was indicated at 588.92 nm,which proves that a small number of impurities are in the blank solution.In LIBS-GD experiments,the intensity of the spectrum is enhanced,this is not only for the Cu and Cr,but for all species.The emission line of O I ranges from 770 to 800 nm and is generated by water vapor ionization and excitation through electron collision.

Table 1.Limit of detection of Cu and Cr in GD and LIBS-GD experiments and limit of detection of Cu and Cr by other methods.
3.2.Discussion on plasma temperature and degree density
In this work,the Stark broadening method was used to calculate plasma density and the Saha–Bolzman method was used to calculate plasma temperature.Figure 7 shows the Saha–Bolzman diagram of plasma temperature under the condition of LIBS-GD.
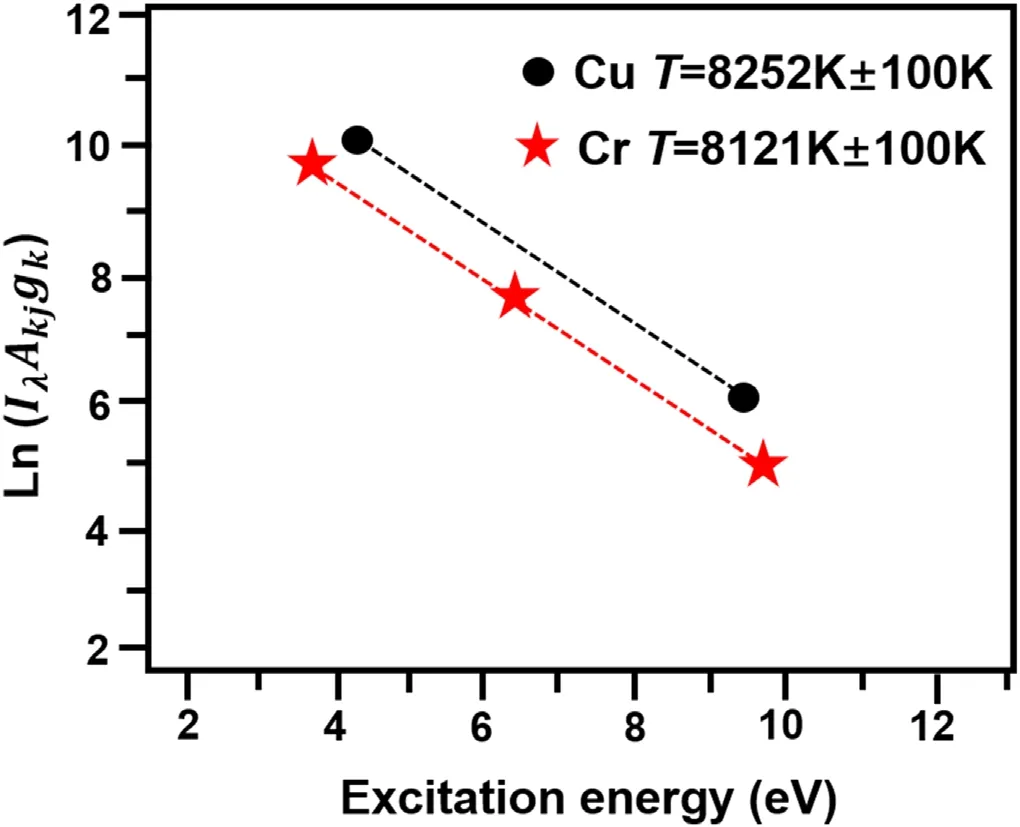
Figure 7.Saha-Boltzmann fitting curve of Cu and Cr in solution under LIBS-GD experiment.

Figure 8.Calibration curves in GD and LIBS-GD experiments.The error bars represent the standard deviation of 10 measurements.(a)Cu I 327.45 nm,(b) Cr I 357.88 nm.
Considering that the GD plasma is a non-LTE model,the plasma temperature of GD is less than 5000 K,and the plasma temperature calculated by the curve of Saha–Bolzman method is about 8000 K in the LIBS-GD joint test.The plasma density calculated by the Stark broadening method is 6.25 × 1012cm?3for GD and 8.18 × 1017cm?3for LIBSGD.The plasma density increases significantly after LIBS technology is added.We found that the plasma temperature and density in the liquid were relatively low compared with the solid sample,but we found that the plasma temperature and density were significantly increased after the addition of LIBS compared with GD.
3.3.Limit of detection
Under the above experimental conditions,GD and LIBS-GD experiments were carried out in mixed solutions with different Cu and Cr concentrations.The correction curves of Cu I 327.45 nm and Cr I 357.88 nm were established,as shown in figure 8.It was found that the slope of the calibration curve under LIBS-GD experiments increases for both Cu I 327.42 nm and Cr I 357.88 nm,and the correlation coefficients under the LIBS-GD are better than those under the GD experiment.Based on the calibration curves,the limit of detection (LOD) can be obtained according to the definition of the IUPAC [37]by equation

where K=3,σ is the standard deviation of the blank solution,and S is the slope of the fitting curve.The LODs for Cu and Cr were obtained by utilizing equation (1) in GD and LIBS-GD experiments,respectively.The results are shown in table 1.The LOD for both Cu and Cr decreased around by an order of magnitude,this implies that the capability of detection was improved by the LIBS-GD method.In addition,as shown in table 1,the standard deviationσof the blank solution in the LIBS-GD experiment was smaller than that in the GD experiment although the correlation coefficients changed little,this indicates that the stability of the plasma is better under LIBS-GD than that of GD in the measured time window.
4.Conclusions
In this work,the mixed solutions of Cu and Cr with different concentrations were analyzed by the LIBS-GD experiment.The LOD values of Cu and Cr were measured under GD and LIBSGD conditions,and the plasma temperature and density under the two experimental methods were compared.The results prove that the LIBS-GD can achieve better detection results,it is expected to overcome the defect of LIBS in the detection of the liquid.But the use of nitric acid and zinc nitrate to prepare and control the conductivity of the solution,as well as the applied voltage (and its control),makes the advantages of LIBS-GD technology not outstanding compared to LIBS technology.However,the GD experiment is only optimized in terms of discharge voltage,but not in terms of detection ability.The purpose of this work is to compare the improvement of GD measurement performance by LIBS-GD.In fact,the detection capability of GD also depends on the conductivity of the solution,pH value and discharge mode,etc.If some trace elements need to be detected in the solution,the experimental parameters should be further optimized under the GD experiment,and then the LIBS-GD experiment is utilized to improve the measurement ability,the specific optimization of the experiments should be considered according to the accuracy and requirements of the measured elements.
Acknowledgments
This work was supported by National Natural Science Foundation of China (Nos.61965015,11564037,and 161741513),the Industrial Support Program for Colleges of Gansu Province(No.2020C-17),the Science and Technology Project of Gansu Province (No.21JR7RA131),and the Young Teachers Scientific Research Ability Promotion Plan of Northwest Normal University (No.NWNU-LKQN2019-1).
猜你喜歡
Chinese Physics B(2024年3期)2024-03-25 09:30:16
當(dāng)代作家(2023年3期)2023-04-23 21:26:58
中國(guó)造紙(2022年9期)2022-11-25 02:20:48
中國(guó)造紙(2022年8期)2022-11-24 09:43:40
Plasma Science and Technology(2022年8期)2022-09-14 08:18:02
Plasma Science and Technology(2021年12期)2022-01-10 14:51:10
Chinese Physics B(2021年4期)2021-05-06 08:54:46
Chinese Physics B(2021年4期)2021-05-06 08:54:46
東坡赤壁詩(shī)詞(2021年1期)2021-03-24 18:25:35
學(xué)生天地(2020年12期)2020-08-25 09:16:52
 Plasma Science and Technology2022年8期
- Plasma Science and Technology的其它文章
- A new stage of the Asian laser-induced breakdown spectroscopy community
- Analysis of non-ionized substance losses in experiments on plasma mass separation
- A novel fault current limiter topology design based on liquid metal current limiter
- A simple derivative spectrophotometric method for simultaneously detecting nitrate and nitrite in plasma treated water
- Wideband radar cross-section reduction using plasma-based checkerboard metasurface
- Effect of rotating liquid samples on dynamic propagation and aqueous activation of a helium plasma jet