
Detection and Attribution of Changes in Summer Compound Hot and Dry Events over Northeastern China with CMIP6 Models
2022-03-12 07:52:20WeiLIZhihongJIANGLaurentLIJingJiaLUOandPanmaoZHAI
Wei LI, Zhihong JIANG, Laurent Z. X. LI, Jing-Jia LUO, and Panmao ZHAI
1 Key Laboratory of Meteorological Disaster of Ministry of Education/Joint International Research Laboratory of Climate and Environment Change/Collaborative Innovation Center on Forecast and Evaluation of Meteorological Disasters, Nanjing University of Information Science &Technology, Nanjing 210044, China
2 Laboratory of Severe Weather, Fujian Institute of Meteorological Sciences, Fuzhou 350001, China
3 Laboratoire de Météorologie Dynamique, Centre National de la Recherche Scientifique, Sorbonne Université,Ecole Normale Supérieure, Ecole Polytechnique, Paris 75252, France
4 State Key Laboratory of Severe Weather, Chinese Academy of Meteorological Sciences,China Meteorological Administration, Beijing 100081, China
ABSTRACT
Key words: compound hot and dry event (CHDE), detection and attribution, northeastern China, future projection
1. Introduction
Concurrent hot and dry meteorological sequences, also called as compound hot and dry events (CHDEs), have received much attention due to their strong impacts on both human society and natural environment. They are often much devastating than simple events occurring independently (Hao et al., 2018; Zscheischler et al., 2018;Yu and Zhai, 2020a). High temperature is favorable for increase of potential evapotranspiration, leading to faster water loss and thus aggravating the severity of dryness.Meanwhile, a deficit of surface water reduces evaporation, increases the sensible heat flux, and thereby enhances temperature.
Many regions of China are reported to suffer from more frequent CHDEs and with increasing intensity in the past decades (Kong et al., 2020; Wu et al., 2020; Yu and Zhai, 2020b). For instance, Wu et al. (2019) found a significant increase in the frequency of CHDE in China during 1988–2014 relative to 1961–1987. Their results were shown robust, insensitive to precise thresholds used to define CHDE. Wu et al. (2020) further assessed the severity of CHDE with a multivariate multi-index approach and found a significant increase in most parts of China except a few central and northwestern regions.
Northeastern China is the main agricultural area in China and is sensitive to global warming. A significant decreasing trend of precipitation (Zhai et al., 2005; Li and Chen, 2021) and a significant increasing trend of temperature (Zhou et al., 2016) have been observed in this region. This hotspot, in terms of CHDE, becomes a serious threat to the regional agricultural production and sustainable development. A research topic of high interest is consequently to investigate whether the anthropogenic signal can be detected in the long-term trend of CHDE and to eventually quantify the relative contributions of different external forcings (e.g., anthropogenic greenhouse gases, anthropogenic aerosol, and natural) in this region. A thorough assessment of this issue is helpful,not only for our understanding of the compound events,but also for our confidence in their future projection.
Climatologists have developed a series of detection and attribution (D&A) methods to answer the question whether the climate has changed in the statistical sense(detection), and how much of that change could be attributed to anthropogenic influence (attribution) (Hegerl et al., 2010; Zhai et al., 2018). The optimal fingerprinting is a classical approach, frequently used for climate change D&A analysis (Hasselmann, 1997; Allen and Tett, 1999;Allen and Stott, 2003; Ribes and Terray, 2013). It is a generalized multivariate regression, with observed change accounted for by a linear combination of externally forced signals. Many efforts have been made to conduct D&A analysis of climate change using the optimal fingerprint approach over China (Sun et al., 2014; Xu et al., 2015; Zhang et al., 2019). Li et al. (2020) found that the anthropogenic influence can be detected by using the historical simulations (1961–2005) of CMIP5 models.However, lack of adequate simulations forced by individual external forcings makes it difficult to quantify their contribution to the long-term trend of CHDE. Recently, simulations made available by the detection and attribution model intercomparison project (DAMIP) under the sixth phase of the Coupled Model Intercomparison Project (CMIP6; Eyring et al., 2016) were released,and provided a variety of external forcing experiments,e.g., with sole anthropogenic greenhouse gases and with sole anthropogenic aerosol. This exceptional multimodel dataset allows us to conduct the D&A analysis for the long-term trend of CHDE over northeastern China,and to provide relevant expertise and scientific basis for policy makers to formulate optimal climate policies and adaptation strategies (Knutson et al., 2017).
In this study, we conduct the detection and attribution analysis of severity of CHDE using the newly released CMIP6 multi-model simulations during 1961–2014. The future projections of CHDE under different warming levels are also analyzed. This paper is structured as follows. Observation and model data are described in Section 2. Section 3 introduces the method used. D&A results are provided in Section 4. Future projections of CHDE are given in Section 5. Finally, the conclusions and discussion are presented in Section 6.
2. Data
2.1 Observational data
The 1° × 1° gridded monthly surface air temperature(SAT) and precipitation observation dataset over China are used. This gridded dataset was developed from over 2400 meteorological stations in China by using thinspace smoothing splines and angular distance weighted interpolation methodology, referred to as CN05.1 (Wu and Gao, 2013). This dataset is widely used in climate change studies (You et al., 2015; Zhou et al., 2016).
2.2 Model simulation data
To investigate the anthropogenic influence on the severity of CHDE over northeastern China, monthly SAT and precipitation simulated by different experiments from CMIP6 are analyzed. Firstly, we use the historical simulations during 1961–2014, where models are forced with both anthropogenic (greenhouse gas, aerosol, land use, etc.) and natural (solar and volcanic) external forcing (ALL), to examine the performance of models in simulating the observed trend in SAT and precipitation.To distinguish the influence of individual components of external forcing on CHDE, we use historical simulations including greenhouse gas-only forcing (GHG), aerosolonly forcing (AER), and natural-only forcing (NAT) experiments (Gillett et al., 2016). Simulations from eight CMIP6 models providing those experiments are used in this study. The preindustrial control simulations (CTL)forced with the external forcing fixed at the level of year 1850 are also used to estimate the internal climate variability. Finally, there is a total of 42 runs for ALL, NAT,GHG, and AER, respectively and 118 chunks of 54-yr length from the CTL experiments. Table 1 provides afew details on the climate models and simulations used in this study. Impacts of anthropogenic forcing (ANT) are estimated from the differences between ALL and NAT.We mainly focus on CHDE during summer, so seasonal(June, July, and August) means of SAT and precipitation are firstly calculated.

Table 1. List of multi-model simulations used in this study, together with the center year when global mean surface temperature (GMST)reaches 1.0, 1.5, and 2.0°C relative to the preindustrial period under the SSP2-4.5/SSP5-8.5 scenarios. Also shown is the ensemble size of simulations in ALL, GHG, AER, and NAT or the number of 54-yr chunks for CTL
We also estimate the time when the global mean surface temperature (GMST) reaches 1.0, 1.5, and 2.0°C higher than the preindustrial period (1860–1900), respectively. The time series of GMST anomalies relative to preindustrial climatology is firstly smoothed with a 9-yr moving average. The first year when the smoothed GMST curve crosses the specific warming level is then considered as the center for the target warming window,which comprises 21 yr in total. The center years of the models from CMIP6 under two SSP (shared socioeconomic pathway–representative concentration pathway)scenarios (SSP2-4.5 and SSP5-8.5) are listed in Table 1. The 1.0°C warming level is used to represent the current climate since GMST actually has warmed up by about 1°C compared with the preindustrial world (World Meteorological Organization, 2020).
3. Method
3.1 Definition of CHDE
The bivariate copula method is used to construct the joint cumulative-probability distribution of SAT and precipitation to define CHDEs and identify them in both observation and simulation. The copula model (C) of precipitation (X) and SAT (Y) can be expressed as (Nelsen et al., 2008):

whereF(X)=P(X≤x) andG(Y)=P(Y≤y) are the marginal cumulative-probability distributions of precipitation and SAT, respectively;xandyrepresent the thresholds of precipitation and SAT; and the value ofF(x,y)can be regarded as the case corresponding to the low precipitation and low SAT. To simplify the calculation of the joint distribution and concurrent events, the precipitation time series is reversed by a factor (?1). The compound hot and dry events can be characterized as the precipitation reversal higher (drier condition) than or equal tox, and SAT larger (hotter condition) than or equal toyat the same time. The complementary part of their cumulative probability can be expressed as:
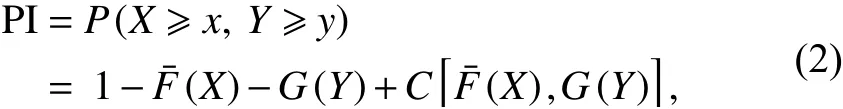
whereFˉ(X)=1?F(X). PI can serve as a measure of the severity of compound hot and dry events. As in Li et al.(2020), we will also call PI the probability-based index for measuring CHDE. In this study, the marginal distributions of precipitation and SAT are calculated based on the empirical Gringorten plotting formula (Cunnane,1978). We use the Gaussian copula to construct the joint distribution of precipitation and SAT, which is suitable to model both positive and negative dependence between those two variables. Accordingly, PI values range from 0 to 1, with higher values representing less severe CHDEs and lower values more severe ones.
The model-simulated PI is calculated at each model’s original grid and for individual runs. It is then bilinearly interpolated onto the 1.0° × 1.0° grid of CN05.1. The interpolated model dataset is masked according to the availability of observation data. For the D&A analysis,the anomaly of the PI series relative to 1986–2005 at grid boxes is averaged, with grid size as weight, over northeastern China to reduce the spatial dimension. Since we mainly focus on long-term trend of CHDE, nonoverlapping 5-yr means of PI averaged over northeastern China are calculated, which produces 11 temporal points of PI values over the 54 yr. It is noted that the last point represents the mean of the four years 2011–2014.
3.2 Relative contribution analysis
The influence of SAT and precipitation, two key factors, on the variation of PI merits further research. We use the multiple linear regression to explore their relative contribution at each grid point. The multiple linear regression is applied on each forcing as well as observation. In the multivariate regression method, the relation of precipitation (P) and SAT (T) satisfies the following regression equation:
3.3 Optimal fingerprinting analysis
The optimal fingerprinting method is employed to detect and attribute changes in CHDE, which regresses observed variableuonto multi-model simulated signal patternsv, plus internal climate variability :
ε
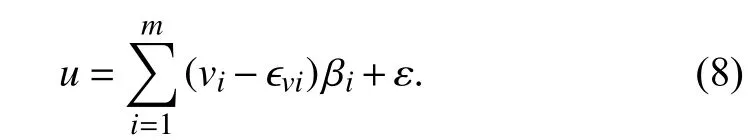
Here,urepresents the observed PI values,videnotes the PI response to theith individual external forcing assessed by the ensemble mean, ?virepresents the internal variability for the ensemble mean, andεis the internally generated residual variability. The value ofviis estimated from CMIP6 multi-model ensemble mean (MME)for a given forcing (ALL, GHG, AER, and NAT). The regression coefficient βi(also called “scaling factor”) is estimated by using a total least square (TLS) method. It is assumed thatεand ?viare Gaussian and share the same covariance structure estimated from the CTL chunks. A residual consistency test is performed by following Allen and Stott (2003), in which the modeled internal variability was compared to the variability of the observational residual. The total 118 nonoverlapping 54-yr chunks of the CTL simulations are divided into two sets.One is used to obtain the best estimation of the scaling factorβand the other is used to carry out a residual consistency test as well as the 90% confidence interval ofβ(Ribes et al., 2013). The detection is declared when the 90% confidence interval of the scaling factor is above zero, which implies that there is a significant relationship between the observed changes and the fingerprint.
We conduct single-signal, two-signal, and three-signal detection analyses for the regional averaged PI time series. For the single-signal analysis, the scaling factor and its 90% confidence interval are estimated by regressing the observed PI changes to individual external forcing (ALL, ANT, GHG, AER, and NAT). Meanwhile,the attributable trend of PI in response to a certain forcing can be derived by multiplying the MME trend of the original PI series and the corresponding scaling factor.The observed trend of PI is calculated by the ordinary least square method. In the two-signal analysis, the observed PI is regressed onto anthropogenic signal (ANT)and natural forcing (NAT) simultaneously to distinguish the ANT and NAT forcings in driving the observed changes. For the three-signal analysis, the observed PI is regressed onto GHG, AER, and NAT simultaneously.The two- or three-signal analysis enables us to examine whether multiple signals are jointly detected and whether the detected signal is separable from other external factors. Similarly, the attributable changes due to each forcing are estimated by multiplying the long-term trend of PI in GHG, AER, and NAT by the corresponding scaling factorβobtained from the multi-signal analysis(Hegerl and Zwiers, 2011).
3.4 Projection of the risk of compound events
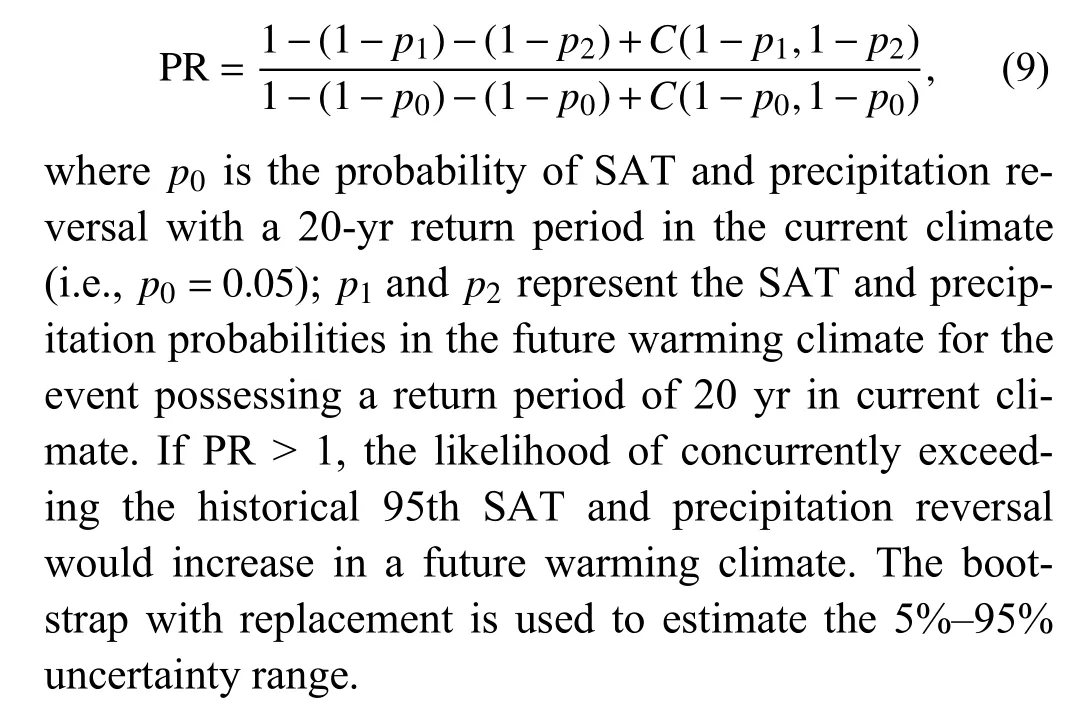
We use probability ratio ( PR) to explore the future risk changes of CHDE. The future change in the PR of CHDE can be expressed as:
4. Results
4.1 Observed and simulated trends in CHDE
Figure 1 shows spatial patterns of the observed and CMIP6 MME simulated trends of SAT, precipitation,and PI during 1961–2014 over northeastern China. The observation shows a significant increasing trend of SAT especially over the north area of northeastern China. The observed warming trend of SAT is well captured by the MME of ALL. Like ALL, the results based on the MME of ANT also simulate well the warming trend. The MME from GHG can equally present the warming pattern,while the MME of AER and NAT shows an opposite trend to the observation. These results demonstrate that the warming trend is mainly due to the influence of anthropogenic greenhouse gases.
As for precipitation, a significant decreasing trend is observed over the southwestern region, while the northern domain exhibits an increasing trend. Eight individual models exhibit a quite large diversity in simulating the trend patterns of precipitation (figures omitted). Both ALL and ANT forcings (MME) show a weak increasing trend across the region, except a decreasing trend over the eastern region in the ANT forcing simulation. The MME of GHG forcing shows a large magnitude with maximum trend in the south. It is noted that the trend pattern is consistent among individual models in GHG forcing with a widespread increasing trend across the region. A decreasing trend is seen across almost the whole region in AER, except the western region. The trend shows a large diversity among individual models under the AER forcing. An increasing trend is found in almost the whole region in BCC-CSM2-MR. However, a widespread decreasing trend across the region is found in CanESM2 (figures omitted). The NAT simulation exhibits a weak increasing trend. Our results are consistent with previous research works (Qian and Zhang, 2019).

Fig. 1. Observed and simulated trends of summer (June–August) mean (a–f) SAT (°C per 54 yr), (g–l) precipitation (mm per 54 yr), and (m–r)PI during 1961–2014 over northeastern China. The dotted grid boxes represent areas significant at the 95% confidence level based on the Mann–Kendall test.
The severity of CHDE tends to increase significantly(corresponding to decreasing PI) over northeastern China with a maximum increasing trend over the central region.ALL, ANT, and GHG forcings (MME) all exhibit a consistent pattern with the observation but with a weaker trend for the case of GHG. The PI trend based on the MME of AER and NAT shows much reduced similarity to the observation with a weak increasing trend across northeastern China.
Now we examine relative contributions of the two key ingredients, SAT and precipitation, to the long-term trend of the severity of CHDE. Figure 2 shows their spatial distributions in ALL, ANT, and GHG as well as in observation, results being deduced from the multiple linear regression. As for the observation, the contribution is dominated by warming SAT across the whole domain, except the southwestern region where reduced precipitation is dominant. The spatial distributions of the relative contributions in ALL, ANT, and GHG are generally close to each other. SAT is the dominant factor for changes in PI in these three forcings over the whole domain of northeastern China, with values larger than 90%in ALL and ANT and larger than 80% in GHG.
Figure 3 displays the area-averaged PI time series from observations and CMIP6 MME in northeastern China. The observed PI exhibits statistically significant(p< 0.01) decreasing trends (?0.28 per 54 yr) but with a quite large decadal variability. The observed decreasing PI trend can be captured by the MME of ALL (?0.27 per 54 yr), ANT (?0.28 per 54 yr), and GHG (?0.20 per 54 yr). The PI trends in AER (0.001 per 54 yr) and NAT(0.02 per 54 yr) are not obvious, but they do show weak decadal variability.
4.2 Detection and attribution of CHDE changes

Fig. 2. Relative contributions (%) of (a–d) SAT and (e–h) precipitation to the trend of the severity of CHDE (PI index) over northeastern China during 1961–2017 in (a, e) observation, (b, f) ALL, (c, g) ANT, and (d, h) GHG forcings.

Fig. 3. Time series of 5-yr non-overlapping mean area-averaged PI anomalies (relative to the mean of 1986–2005) over northeastern China from the observation (OBS; black) and CMIP6 MME with anthropogenic plus natural (ALL; red), anthropogenic (ANT; purple), greenhouse gas only(GHG; pink), anthropogenic aerosol (AER; blue), and natural (NAT; green) forcings, respectively.
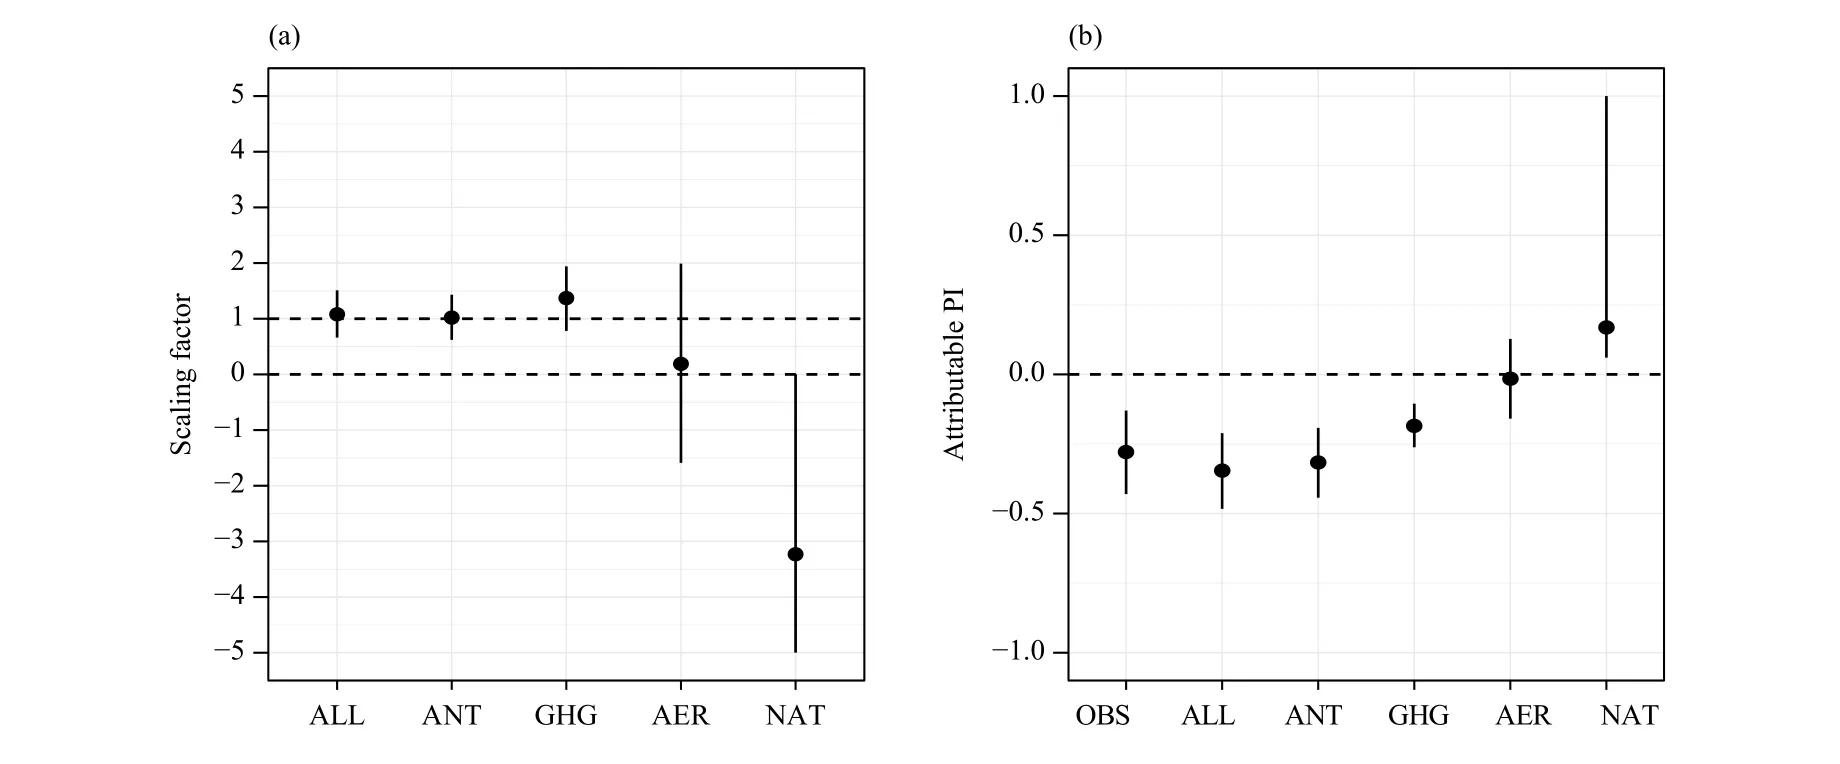
Fig. 4. (a) Best estimation of the scaling factor and the 5%–95% uncertainty range from the single-signal analysis for the PI series. (b) The observed PI trend estimated by the ordinary least square method and the attributed PI trend in response to different external forcings. The error bar indicates the 5%–95% uncertainty range.
We further investigate the influence of the given external forcing on changes in CHDE over northeastern China using the optimal fingerprinting method. In the case of single-signal analysis, the observed PI series is regressed onto the MME of ALL, ANT, GHG, AER, and NAT separately. Figure 4a shows the best estimates and 5%–95% uncertainty ranges of the scaling factors for ALL, ANT, GHG, AER, and NAT. It is found that the 5%–95% uncertainty range of the scaling factors for ALL (0.66–1.51), ANT (0.62–1.43), and GHG (0.78–1.94) is greater than zero, indicating that those signals are robustly detected at the 5% significance level. The best estimation of the scaling factors of ALL (1.08), ANT(1.02), and GHG (1.37) are close to unity, indicating that they exhibit a good performance to simulate the observed PI. However, the impacts of AER (0.19, ?1.59 to 1.99) and NAT (?3.23, ?5 to 0) fail to be detected, as the lower bounds of the 5%–95% uncertainty range of their scaling factors are below zero. The best estimate of the scaling factor is lower than zero for AER, which indicates the negative effect of AER on the changes of CHDEs over northeastern China.
The attributable changes in the trend of PI in response to different forcings are also calculated with the method described in Section 3 (Fig. 4b). The observed PI has decreased by 0.28 (0.13–0.43 for the 90% confidence interval) during the past 54 yr (1961–2014). A similar trend is found in the simulations with ALL, ANT, and GHG. PI is estimated to decrease by 0.26 (90% confidence interval: 0.10–0.42) for ALL, by 0.28 (0.11–0.45) for ANT,and by 0.24 (0.07–0.41) for GHG. However, the attributable trend of PI to AER (?0.01) and NAT (0.1) is quite small.
In summary, the anthropogenic impacts (ALL, ANT,and GHG) can be robustly detected in the observed intensified trend in the severity of CHDE over northeastern China. However, the observed trend cannot be explained by the AER and NAT forcings. Furthermore, the attributable trends of PI in response to ALL, ANT, and GHG are consistent with the observation.
Figure 5 shows the two-signal and three-signal detection results for the PI series. In the two-signal detection analysis, observations are regressed onto ANT and NAT simulations simultaneously. The best estimation and 5%–95% uncertainty range of the scaling factors for ANT and NAT are displayed in Fig. 5a. It is notable that the ANT signals can be clearly detectable in northeastern China (i.e.,βexceeds zero), and the observed PI changes are consistent with ANT-induced PI changes(i.e.,βincludes unity). It is noted that the best estimation ofβfrom ANT (1.09, 0.63–1.60) is larger than unity, indicating that CMIP6 models underestimate the observed changes in the severity of CHDE over northeastern China. However, the NAT impact on the PI changes is undetectable since the 90% confidence interval of scaling factors (1.10, ?2.77 to 5.84) includes zero. This indicates that the observed intensification of CHDE over northeastern China can be largely attributed to the ANT forcing rather than to the NAT forcing.
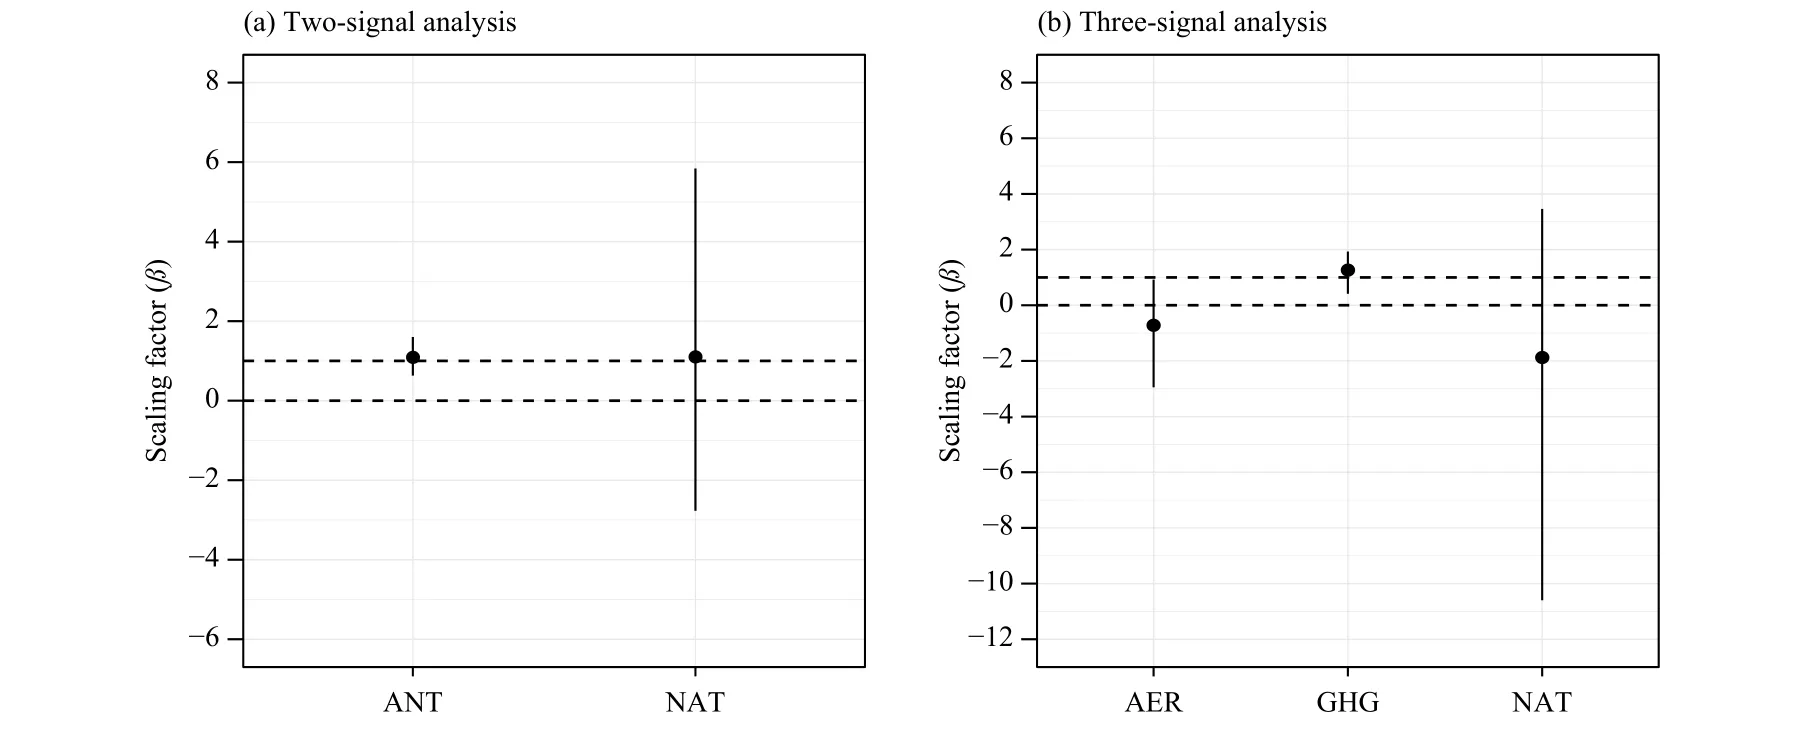
Fig. 5. Results from (a) two-signal and (b) three-signal optimal fingerprint detection analyses of the PI change over northeastern China over 1961–2014. Best estimation (data points) and 5%–95% uncertainty ranges (error bars) of the scaling factor (β) from the two-signal (ANT and NAT) and three-signal (GHG, AER, and NAT) analyses are shown respectively. In (a), the observed PI time series is regressed onto the model simulation in response to ANT and NAT forcings simultaneously. In (b), the observed PI time series is regressed onto the model simulation in response to GHG, AER, and NAT forcings simultaneously. The dashed horizontal lines indicate β values of 0 and 1.
To further investigate the influence of GHG and AER forcings, i.e., the two main factors of the anthropogenic forcing, we conduct a three-signal detection analysis by regressing the observed changes onto GHG, AER, and NAT simultaneously (Fig. 5b). Results show that the GHG forcing is significantly detected and separable from AER and NAT. The 90% confidence interval of the scaling factors for GHG includes unity, indicating that the observed changes are largely explained by the GHG forcing. It is noted that the best estimation of the scaling factor and its 90% confidence interval for GHG (1.26,0.41–1.93) is slightly larger than that for ANT (1.19,0.63–1.60). However, the impacts of AER (?0.72, ?2.95 to 0.92) and NAT (?1.88, ?10.60 to 3.46) on the CHDE changes cannot be significantly detected.
The contributions from the different forcings to the observed PI trend can be quantified by multiplying the model simulation trend with the corresponding scaling factors and their 90% confidence interval. Figure 6 shows the PI trend attributed to a forcing component in the two-signal (Fig. 6a) and three-signal (Fig. 6b) analyses, respectively. ANT explains most of the observed trend, accounting for ?0.33 (?0.59 to ?0.17) per 54 yr,while the trend attributed to NAT is quite small, accounting for 0.06 (?0.06 to 0.28) per 54 yr. According to the scaling factors in the three-signal analysis, the observed trend of the PI attributed to GHG is ?0.26 (?0.48 to?0.07), which is very close to the observed trend.However, the PI trend attributable to AER and NAT is relatively small, with only ?0.02 (?0.07 to 0.03) and 0.01(?0.15 to 0.17) per 54 yr, respectively.
5. Future projection of CHDE over northeastern China
The above findings demonstrate that the observed PI trend is largely explained by the ANT forcing. How would the severity of CHDE over northeastern China change under different emission scenarios in the future?The future simulations under SSP2-4.5 and SSP5-8.5 are used to explore this issue.
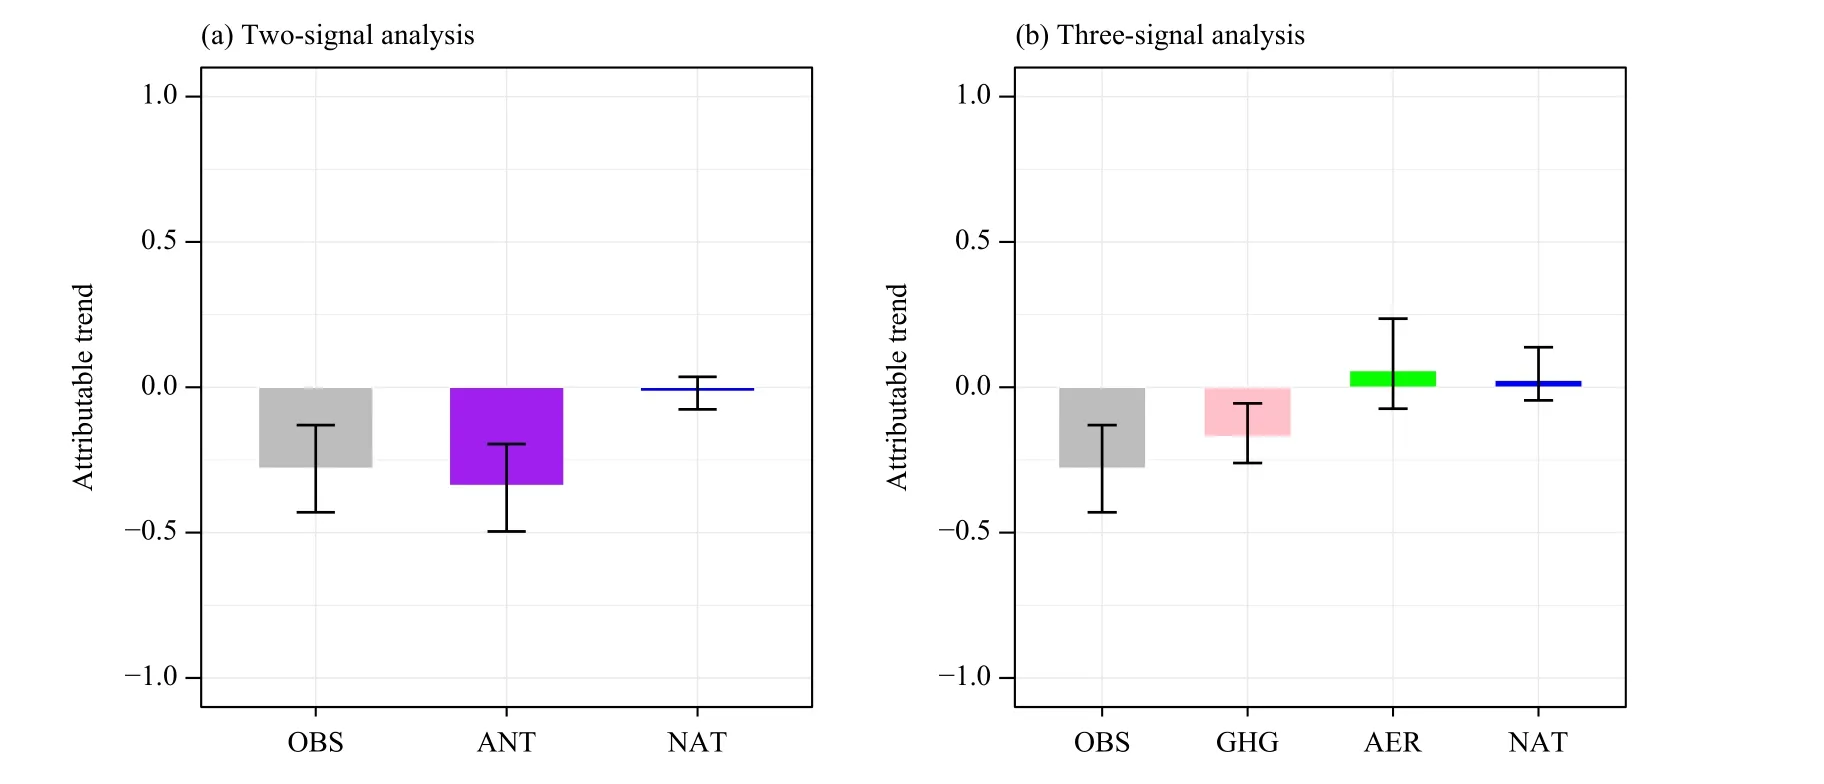
Fig. 6. Attributable trends of PI to different forcings in the (a) two-signal and (b) three-signal analyses compared with the observed trends(OBS; black) for northeastern China.
Because there is an underestimation of PI in ANT, we use the above attribution result to constrain the future projection of PI by simply multiplying the scaling factor of ANT in the two-signal analysis, as practiced in previous studies (Zhou and Zhang, 2021). The raw and constrained time series of regional averaged PI from 1961 to 2100 are given in Fig. 7, where the part 1961–2014 is derived from the historical simulation and the part from 2015 to 2100 is from either SSP2-4.5 or SSP5-8.5. Generally, PI continues to decline in the two future warming scenarios with a higher decrease in the high-emission scenario. This means that northeastern China will experience more and more severe compound hot and dry events in the future, especially under high emission scenarios. It is to be noted that the raw and constrained series exhibit little difference since the scaling factor of ANT (1.09) is close to 1.0. We calculated the PR of the compound hot and dry events under 1.5 and 2.0°C global warming levels relative to current climate (1.0°C) with raw data from SSP2-4.5 and SSP5-8.5. The probability of compound events concurrently exceeding the 95th percentile of SAT and precipitation reversal exhibit little increase under 1.5°C warming, while the probability is projected to increase by a factor of 2 (0.7–5.0) under 2.0°C warming climate. It is noted that the probability changes of CHDE between SSP2-4.5 and SSP5-8.5 show little difference between the 1.5 and 2.0°C warming levels.
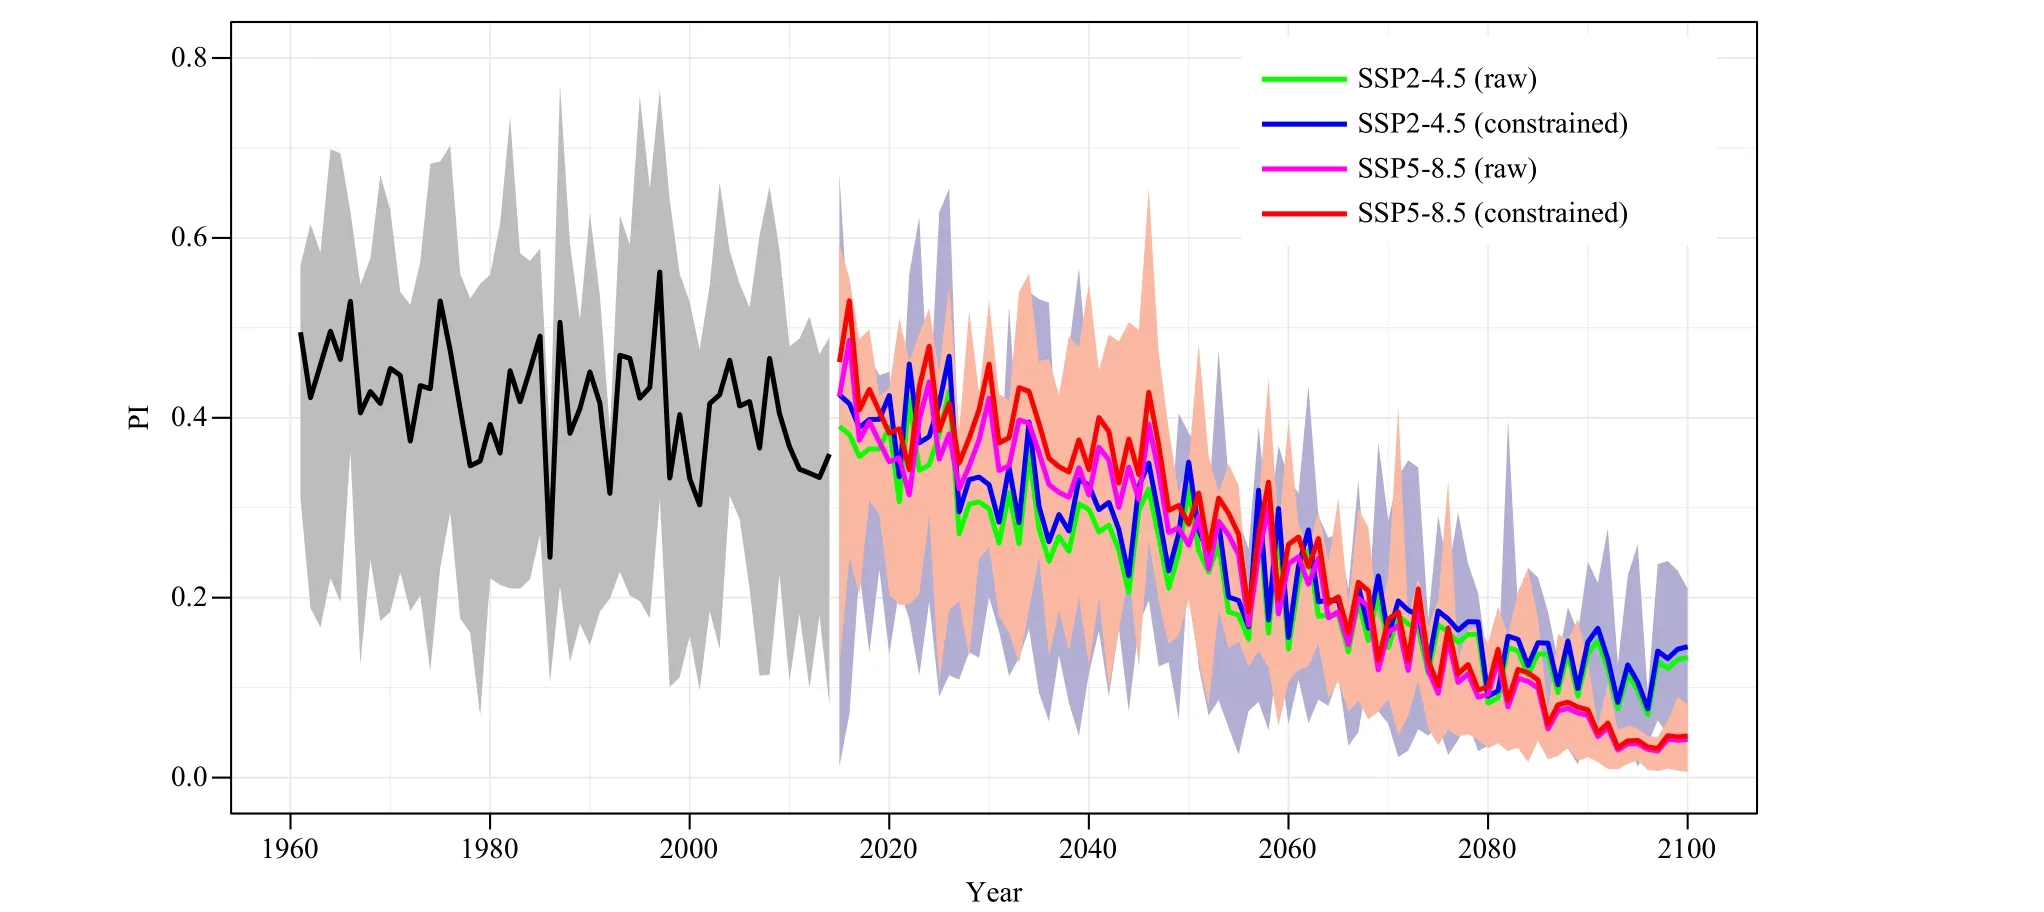
Fig. 7. Area-weighted time series of PI over northeastern China from 1961 to 2100 during the historical period (black) and future projections under SSP2-4.5 and SSP5-8.5 scenarios. The solid line represents the multi-model ensemble means and the corresponding shadings denote the model spread derived from the raw model output. The blue (green) and red (magenta) curves indicate the constrained (raw) projection by multiplying the MME with the scaling factor of ANT in the two-signal analysis under SSP2-4.5 and SSP5-8.5, respectively.
The projected patterns of PI, derived from the multimodel ensemble mean under 1.5 and 2.0°C warming compared to 1.0°C warming under SSP2-4.5 and SSP5-8.5, are shown in Fig. 8. Larger changes in PI are found in warmer climate with the largest decrease over the northern region. The changes of PI under the same warming level but with different SSP scenarios are close to each other, a conclusion also reported in previous works (Li et al., 2018; Shi et al., 2018).
6. Conclusions and discussion
This study presents detection and attribution analyses on the observed increasing trend (1961–2014) in the severity of summer compound hot and dry events over northeastern China. Data are from CMIP6 multi-model ensemble simulations, and the method of analysis and diagnostics is based on the optimal fingerprinting technique. The multi-signal detection analysis is used to separate different forcing signals and quantify their contribution to the observed changes. Future changes in the severity of CHDE under continued anthropogenic warming climate are also analyzed. The main results are given as follows.
(1) A significant increasing trend in the severity of CHDE is found over northeastern China during the past decades. The trend of regional averaged PI is ?0.28(?0.43, ?0.13) per 54 yr. The CMIP6 ALL simulations can well reproduce such a trend.
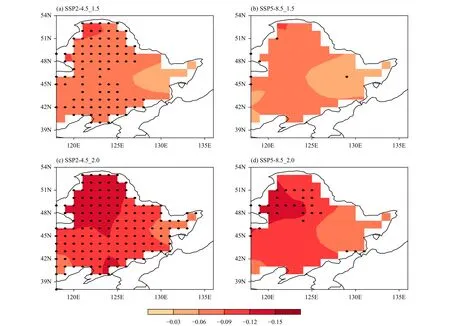
Fig. 8. Spatial patterns of the PI changes under (a, b) 1.5 and (c, d) 2.0°C warming levels compared to the 1.0°C warming level under the (a, c)SSP2-4.5 and (d, e) SSP5-8.5 scenarios. The dotted areas indicate that the changes are significant at the 95% confidence level based on the twoside Student’s test.
(2) Two-signal analysis from the optimal fingerprinting method reveals that the ANT signal is robustly detected in the observed changes of CHDE. The ANT forcing explains most of the observed trend, accounting for?0.33 (?0.59 to ?0.17) per 54 yr over northeastern China. By using the three-signal analysis, the GHG signal in the observed changes is well detected, while AER and NAT have almost no contribution to the observed changes in the PI trend.
(3) The severity of CHDE will continue to increase in the future with a higher magnitude in SSP5-8.5 than in SSP2-4.5. The two scenarios both demonstrate that the likelihood of regional historical compound event concurrently exceeding the 95th percentile of SAT and precipitation reversal exhibits little changes at 1.5°C warming,while this compound event is almost 2 times more likely to occur in the 2.0°C warming climate.
In this study, we found that the observed intensification of CHDE is mainly due to the GHG forcing. It is noted that the increasing trends of SAT and PI both are much stronger in ANT than in GHG, which is also found in CMIP5 models (Li et al., 2020). Two factors may explain this phenomenon: 1) the important influence of land use changes (LU) in the SAT changes; 2) nonlinear response of SAT to individual external forcing. However,no available adequate simulations from CMIP6 DAMIP allow us to conduct the right detection and attribution analysis. More works with regional climate models employing the observed LU changes and relevant research on the nonlinear effect of external forcings, are needed to ameliorate our understanding on the compound hot and dry events in this region.
We have used a probability-based index to define the compound hot and dry events at the monthly scale. This definition fails to measure the full properties of the events such as their frequency, duration, and intensity(Yu and Zhai, 2020b; Li et al., 2021). Therefore, submonthly scale indices are needed to conduct the detection and attribution, which can improve our understanding of the compound events at multiple timescales and provide more detailed information for policy and decision makers and stakeholders. Finally, we only used eight available models in our work; more models are needed to assess the robustness of our conclusions in future studies.
Acknowledgments. We would like to acknowledge the World Climate Research Programme’s Working Group on Coupled Modelling, which is responsible for CMIP.We thank the climate modeling groups for producing and making their model outputs available.
 Journal of Meteorological Research2022年1期
- Journal of Meteorological Research的其它文章
- Feature Construction and Identification of Convective Wind from Doppler Radar Data
- Understanding Differences in Event Attribution Results Arising from Modeling Strategy
- Global Rainstorm Disaster Risk Monitoring Based on Satellite Remote Sensing
- Spatial and Temporal Validation of In-Situ and Satellite Weather Data for the South West Agricultural Region of Australia
- Uncertainty in TC Maximum Intensity with Fixed Ratio of Surface Exchange Coefficients for Enthalpy and Momentum
- QpefBD: A Benchmark Dataset Applied to Machine Learning for Minute-Scale Quantitative Precipitation Estimation and Forecasting