
Quantitative Secretome Analysis Reveals Clinical Values of Carbonic Anhydrase II in Hepatocellular Carcinoma
2021-12-03 09:02:02XiaohuaXingHuiYuanHongzhiLiuXionghongTanBixingZhao
Xiaohua Xing, Hui Yuan, Hongzhi Liu, Xionghong Tan, Bixing Zhao,
Yingchao Wang2, Jiahe Ouyang2, Minjie Lin2, Xiaolong Liu1,2,*, Aimin Huang1,*
1 Department of Pathology and Institute of Oncology,School of Basic Medical Sciences of Fujian Medical University,Fuzhou 350004,China
2 The United Innovation of Mengchao Hepatobiliary Technology Key Laboratory of Fujian Province, Mengchao Hepatobiliary Hospital of Fujian Medical University, Fuzhou 350025, China
KEYWORDS
Abstract Early detection and intervention are key strategies to reduce mortality, increase longterm survival, and improve the therapeutic effects of hepatocellular carcinoma (HCC) patients.Herein, the isobaric tag for relative and absolute quantitation (iTRAQ)-based quantitative proteomic strategy was used to study the secretomes in conditioned media from HCC cancerous tissues,surrounding noncancerous tissues,and distal noncancerous tissues to identify diagnostic and prognostic biomarkers for HCC. In total, 22 and 49 dysregulated secretory proteins were identified in the cancerous and surrounding noncancerous tissues, respectively, compared with the distal noncancerous tissues. Among these proteins, carbonic anhydrase II (CA2) was identified to be significantly upregulated in the secretome of cancerous tissues; correspondingly, the serum concentrations of CA2 were remarkably increased in HCC patients compared with that in normal populations.Interestingly,a significant increase of serum CA2 in recurrent HCC patients after radical resection was also confirmed compared with HCC patients without recurrence, and the serum level of CA2 could act as an independent prognostic factor for time to recurrence and overall survival. Regarding the mechanism, the secreted CA2 enhances the migration and invasion of HCC cells by activating the epithelial mesenchymal transition pathway.Taken together,this study identified a novel biomarker for HCC diagnosis and prognosis,and provided a valuable resource of HCC secretome for investigating serological biomarkers.
Introduction
Hepatocellular carcinoma (HCC) has a high incidence and mortality,making it the sixth most common malignant cancer worldwide[1].Although surgical strategy was proven to be the most suitable option for HCC therapy, most HCC patients were not diagnosed or intervened until the advanced stage,rendering them unsuitable for surgical treatments[2]or resulting in a poor prognosis after surgical excision. Currently, the five-year survival rate of HCC patients is less than 20%,while the five-year recurrence and metastasis rates are even higher than 80% [3–6]. So far, alpha fetoprotein (AFP) and desgamma-carboxy prothrombin (DCP) are the most widely accepted and clinically applied biomarkers for HCC diagnosis and monitoring. However, the sensitivity and specificity of AFP and DCP in the early diagnosis as well as prognosis evaluation of HCC are insufficient [7–9]. Therefore, it is urgently required to find novel biomarkers that are highly specific and sensitive for early diagnosis and prognosis evaluation of HCC.
Proteomics-based technology has become a very useful and powerful analytical tool for biomarker screening [10–13]. A desirable biomarker for HCC diagnosis or monitoring should allow measurement using body fluid samples such as serum and plasma [14], since these samples are low-cost and easy to collect and process, and are amenable to repeat sampling whenever it is necessary. Therefore, the serum and plasma are also the ideal targets for proteomic studies that aim to identify diagnostic or prognostic biomarkers for HCC[15,16]. However, the complex nature of serum and plasma,as well as their large dynamic concentration range of different proteins, significantly hinders the progress of proteomicsbased biomarker screening.
Secretory proteins play important roles in signal transduction, cell growth, proliferation, and apoptosis, and even in tumorigenesis, development, invasion, and metastasis, and are ideal sources for biomarker screening [17]. Investigating the secretome of HCC tissues or cells may provide valuable information for identifying potential biomarkers. Recently,the application of secretomics in screening diagnostic or prognostic protein biomarkers in HCC cell lines has been reported by many groups [18–20]. However, these results still must be clinically validated [21]. Therefore, it would be more straightforward and convincing to analyze the secretome of primary tumor tissue cultures to identify the diagnostic or prognostic biomarkers for HCC.For example,Yang et al.[22]have established an in vitro tissue culture system for HCC and identified matrix metalloproteinase 1(MMP1)as a diagnostic biomarker for HCC; however, the influence of hepatitis B virus (HBV)infection was not analyzed in this study.
In the present study, we collected serum-free conditioned media (CM) from the tissue cultures of cancerous (C) tissues,surrounding noncancerous (SN)tissues, and distal noncancerous (DN) tissues of HCC patients, respectively, and analyzed their secretomes to identify potential diagnostic and prognostic biomarkers for HCC via an isobaric tag for relative and absolute quantitation (iTRAQ)-based quantitative proteomic approach. Meanwhile, the sensitivity, specificity, and clinical significance of the identified biomarkers were also carefully validated in a large-scale HCC patient cohort by enzyme linked immunosorbent assay(ELISA)and targeted proteomics of parallel reaction monitoring (PRM). Furthermore, the molecular mechanisms of the identified biomarker, carbonic anhydrase II (CA2), were also carefully explored.
Results and discussion
Cells in the in vitro-cultured tissues were alive and secretory
To ensure that the cells in the in vitro-cultured tissues were alive and the secretome was not contaminated by intracellular proteins, a series of analyses were performed (Figure 1A). We used haematoxylin and eosin (H&E) staining to evaluate the cell morphology changes of tissues cultured for 0 day, 1 day,and 2 days. As revealed in Figure 1B, the H&E stained tissue sections showed corresponding characteristic anatomical details of HCC C, SN, and DN tissues in all respective cultures. With the extension of incubation time, cells in the cultured tissues were starved and showed necrosis or apoptosis due to lack of nutrients. The morphology of tissues cultured for 1 day was still very similar to that of the fresh tissues (cultured for 0 day). By contrast, the number of cell nuclei in tissues cultured for 2 days significantly decreased compared with the fresh tissues due to cell necrosis or apoptosis during the culture process. TdT-mediated dUTP nick-end labeling(TUNEL) staining was further used to evaluate the apoptosis rates of tissues cultured for 0 day, 1 day, and 2 days. As revealed in Figure 1C,the tissues cultured for 2 days had a significantly higher apoptosis rate compared with tissues cultured for 0 day or 1 day.In addition,the proteins extracted from culture supernatants with different culture times were examined by SDS-PAGE. As shown in Figure 1D,the molecular weight distribution of the extracted proteins was significantly changed with the increase of culture time, especially when the culture time was more than 1 day. Furthermore, Western blot assays clearly demonstrated the prevention of contamination by intracellular proteins(Figure 1E).Taken together,these results suggested that the 1-day culture time was the optimal time point for collecting culture supernatants.
The overall characteristics and Genetic Ontology enrichment of the secretory proteins identified from tissue secretomes
iTRAQ labeling combined with mass spectrometry was applied to investigate the secretome difference of the three types of tissues from primary HCC patients. The features of the ten HCC patients in current study are listed in Table S1.Total proteins separately extracted from the supernatants collected from the CM of HCC C,SN,and DN tissues were analyzed using two-dimensional liquid chromatography–tandem mass spectrometry (2D LC–MS/MS), as shown in Figure 2.We quantified 2388 proteins in total using Scaffold_4.3.2, of which 1312 proteins were annotated or predicted as secretory proteins. This result covered 75.7% of the secretory proteins previously reported by Yang and colleagues[22](Figure S1A),and the percentage of secretory proteins in our dataset(54.9%;1312/2388) was much higher than that in the human protein database (23%) (Figure S1B). The complete list of quantified secretory proteins, as well as their detailed features including the NN-score, MetazSecKB characteristic, isoelectric point(pI), molecular weight, hydrophobicity, and quantification results, is shown in Table S2. Among these secretory proteins,936 were commonly found in 5 biological replicates, which accounted for 71.3% of the quantified secretory proteins.
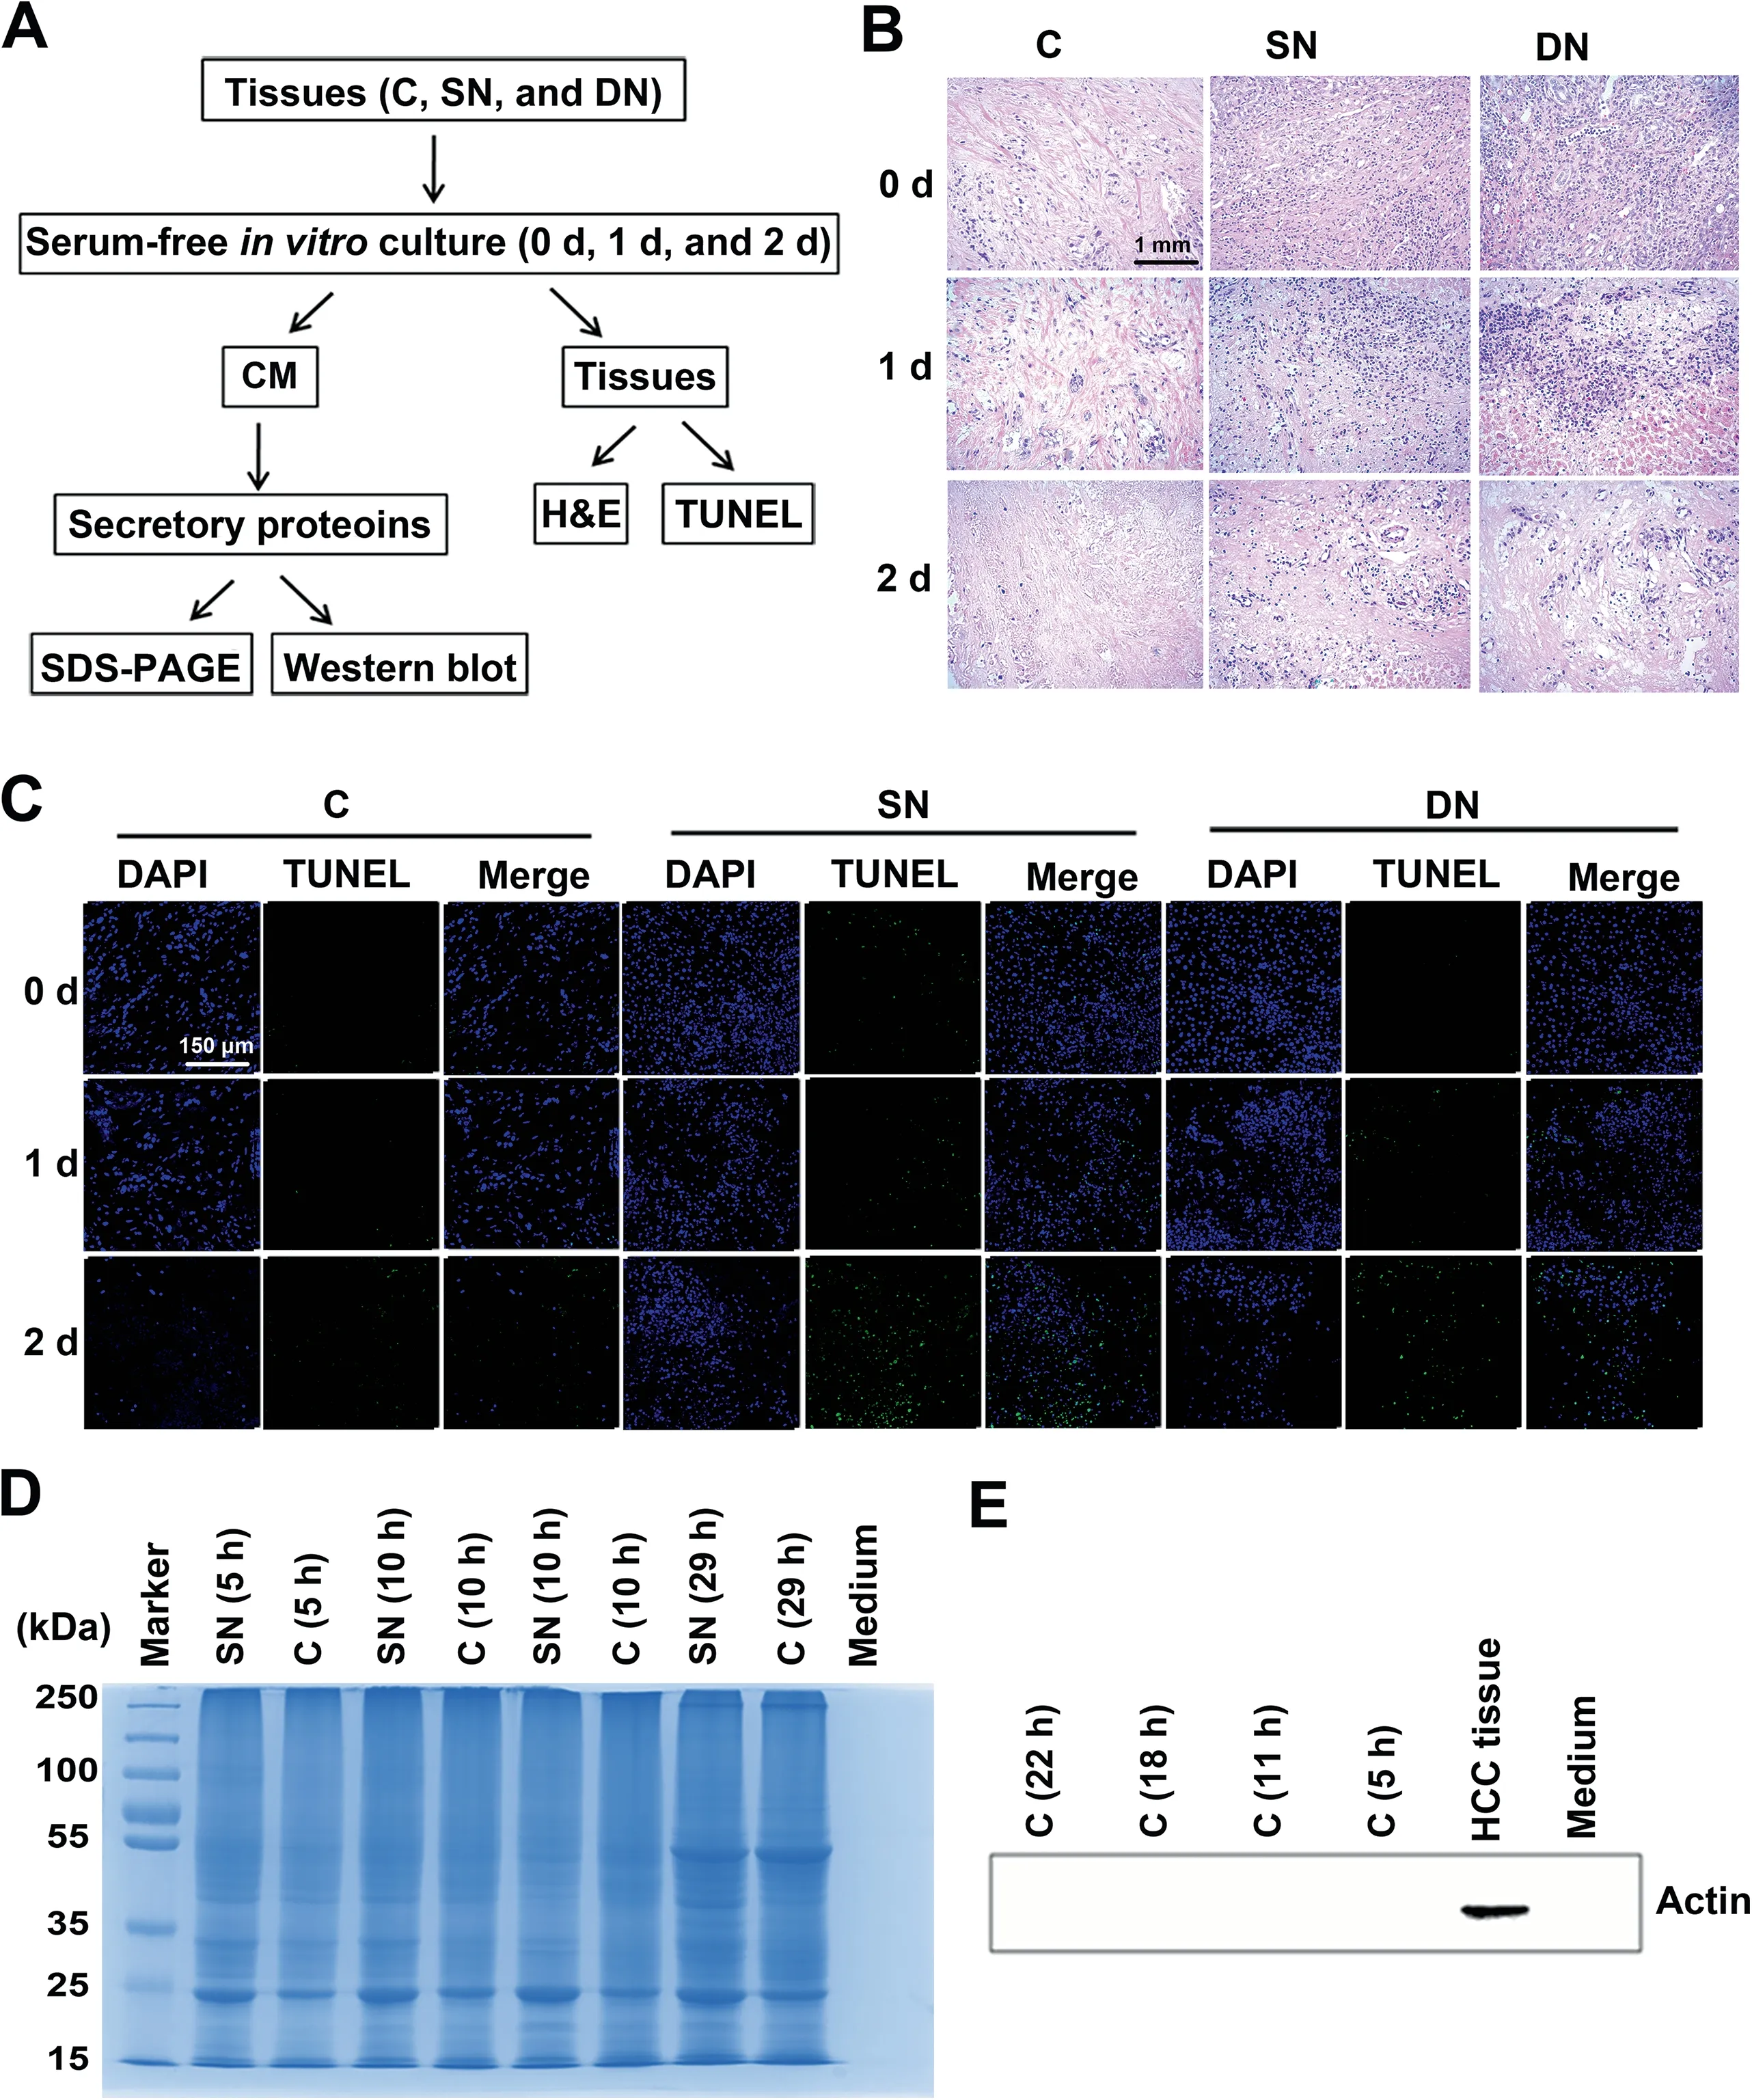
Figure 1 Strict quality control of the secretory proteins from the cultured HCC-related tissuesA. The quality control workflow for the cultured HCC-related tissues and the secretory proteins in the supernatant. B. H&E staining of cultured HCC-related tissues.Scale bar,1 mm.C.TUNEL staining of cultured HCC-related tissues.We examined the densities of DAPI(blue) and FITC (green) for each tissue. Scale bar, 150 μm. D. The molecular weight distribution of secretory proteins determined by SDS-PAGE.E.Western blot demonstrating the effective prevention of intracellular protein contamination in extracted secretory proteins.Actin was used as a control. HCC, hepatocellular carcinoma; C, cancerous tissue; SN, surrounding noncancerous tissue; DN, distal noncancerous tissue; CM, conditioned medium; H&E, haematoxylin and eosin; TUNEL, TdT-mediated dUTP nick-end labeling.
The molecular weight distribution of the secretory proteins ranged from 7396 Da to 628,685 Da, with a primary range of 10–40 kDa, indicating smaller molecular weight of the secretory proteins (Figure 3A). The pI values ranged from 3.67 to 12.56 and were mainly in the range of 4.4–7.6,which coincided with the microenvironment of liver tissues (Figure 3B). The hydrophobicity of the secretory proteins ranged from 1.2 to 3.3 and was mainly in the range of 1.8–2.2, which implied the enrichment of membrane or transmembrane proteins(Figure S1C).
We also investigated the Genetic Ontology (GO) annotations containing cell components, molecular functions, and biological processes of the secretory proteins. Cell component category showed that the secretory proteins were primarily extracellular, which suggested excellent purity of the HCCrelated tissue secretomes (Figure 3C). The biological process category indicated that these secretory proteins were mainly involved in biosynthetic process, signal transduction, and transport process (Figure 3D). The molecular function category indicated that these secretory proteins played major roles in RNA binding, enzyme binding, DNA binding, and transmembrane transporter activity (Figure 3E).These results were consistent with those of previously reported secretory proteins from HCC tissues [22].
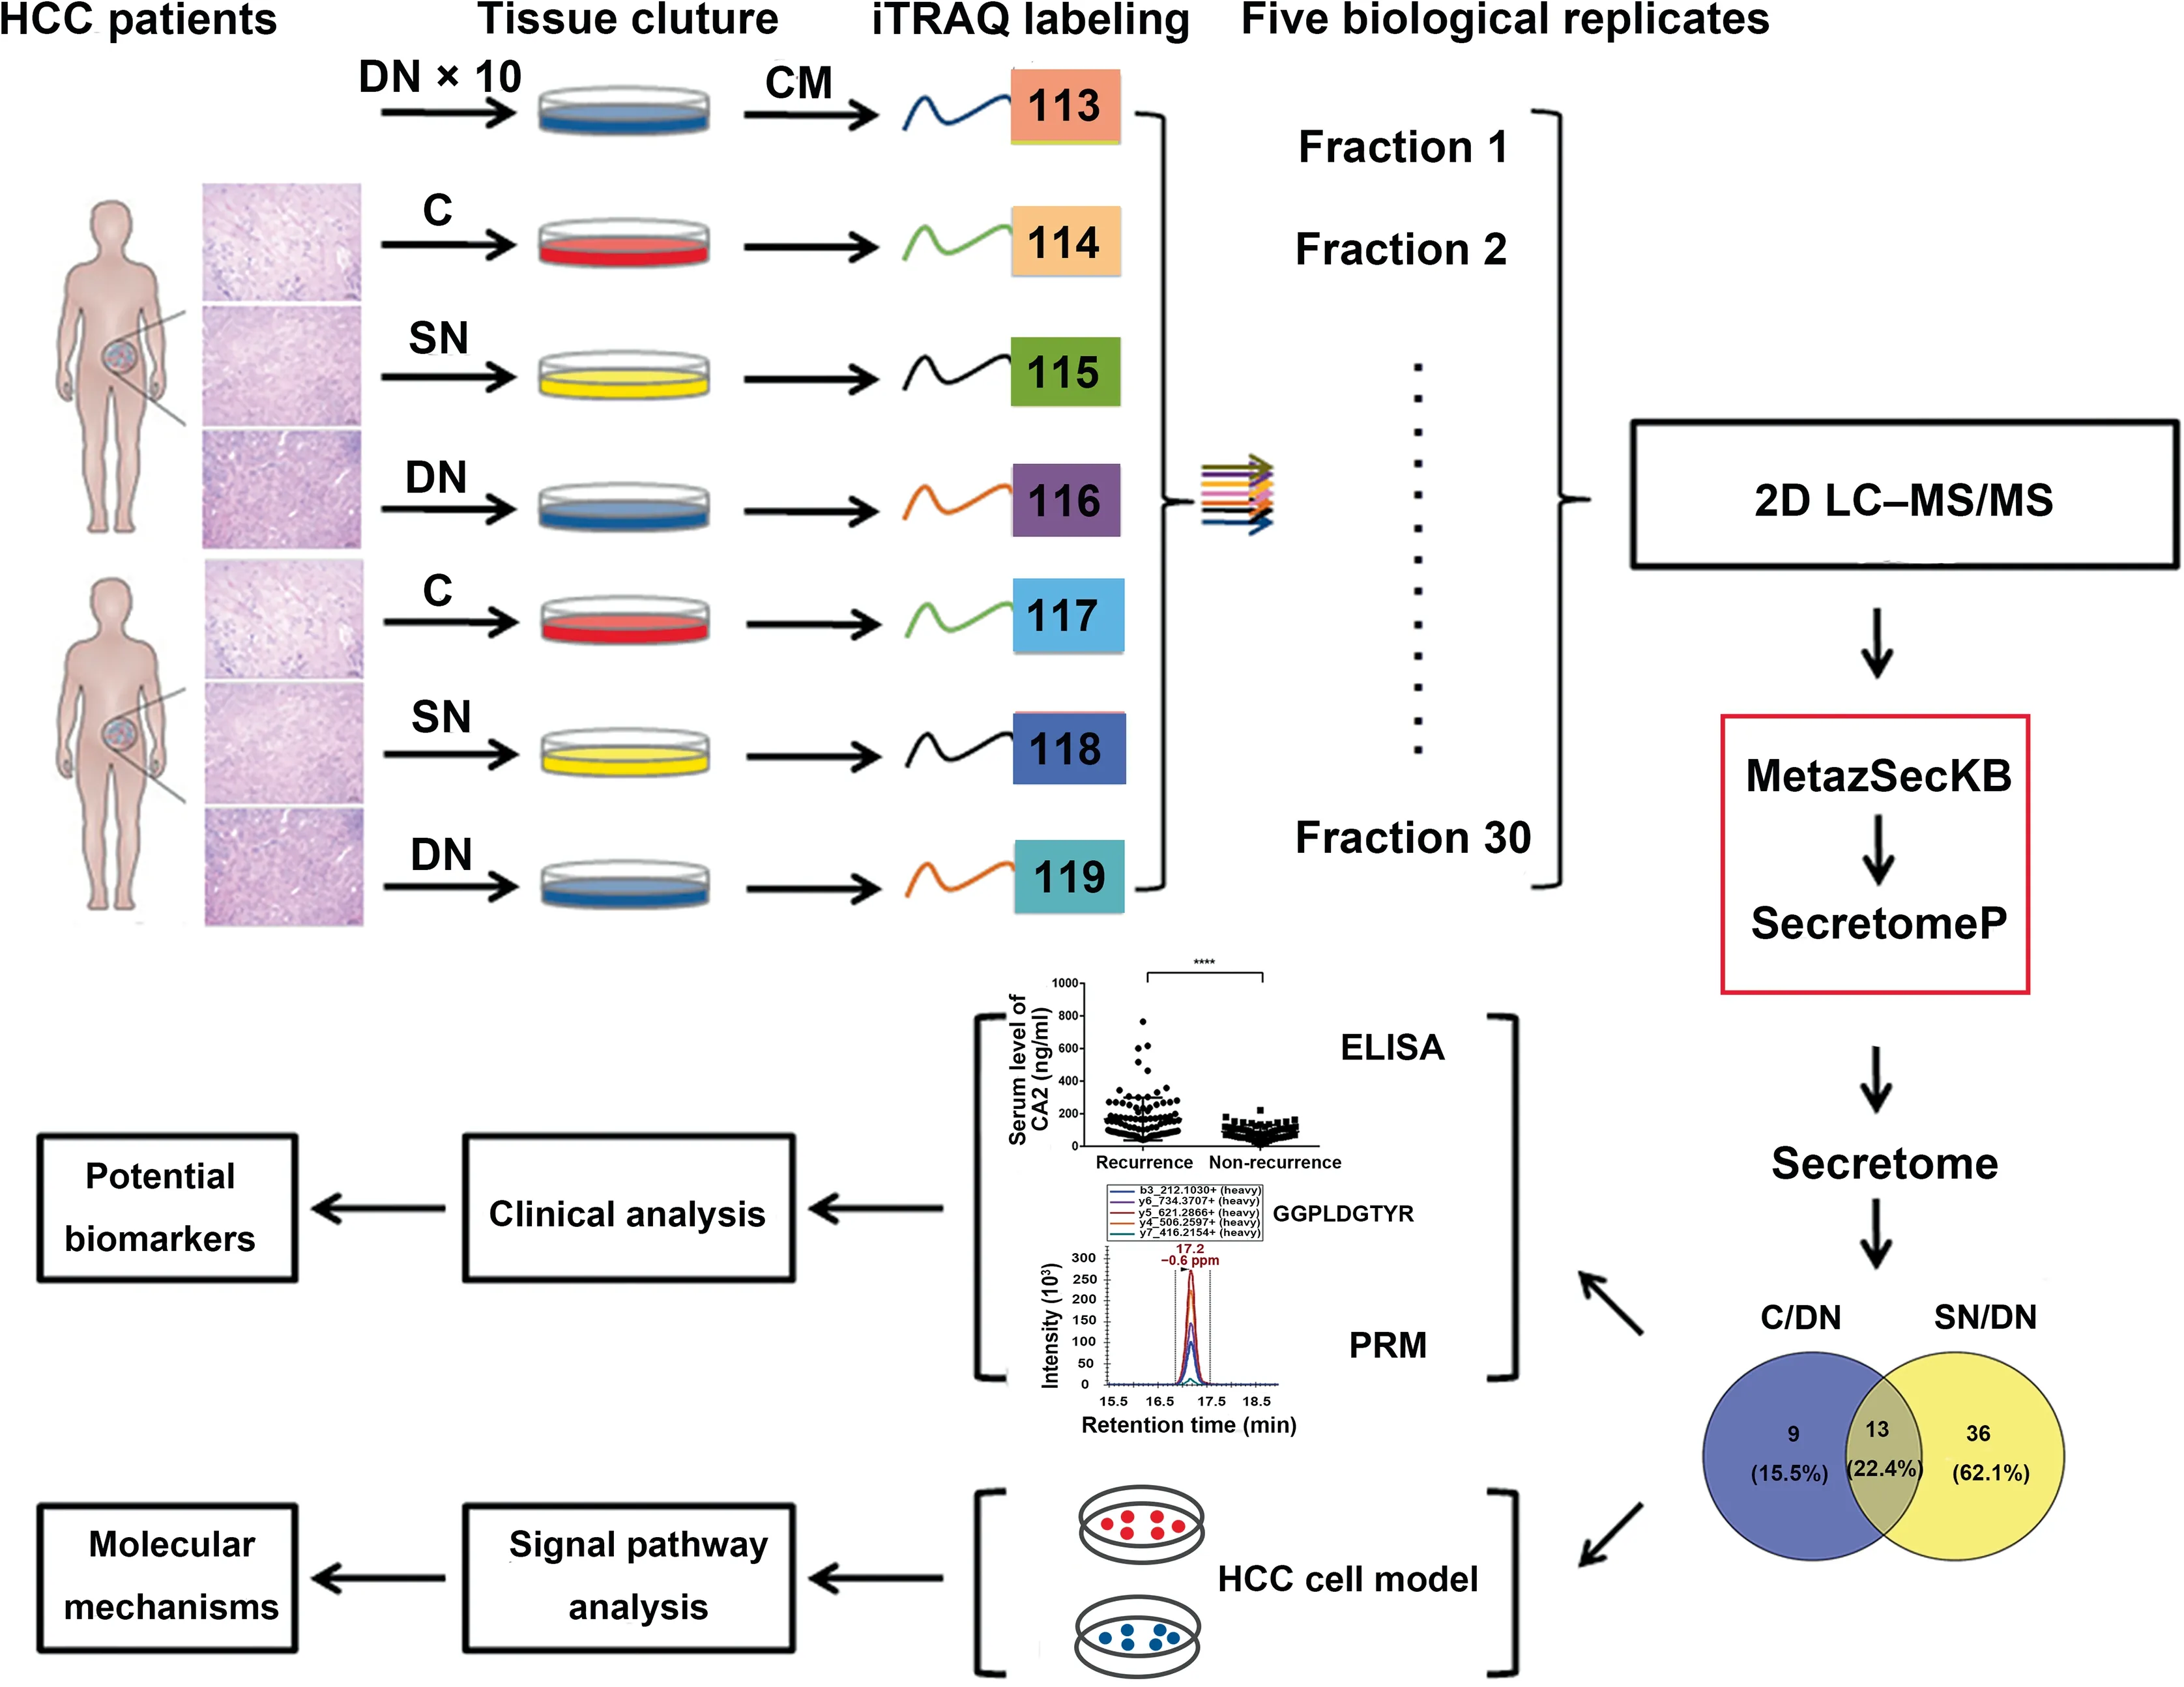
Figure 2 Experimental workflow for the secretome analysis of HCC-related tissuesThe three types of tissues (C, SN, and DN) from HCC patients were cultured in vitro, and the CM was collected to extract secretory proteins. Secretory proteins were digested with trypsin, directly labeled using iTRAQ-8plex, and analyzed through 2D LC–MS/MS. The target proteins screened by bioinformatics were then verified in vitro to find potential biomarkers of HCC and to investigate the molecular mechanisms of HCC recurrence. iTRAQ, isobaric tag for relative and absolute quantitation; 2D LC–MS/MS, two-dimensional liquid chromatography–tandem mass spectrometry; ELISA, enzyme linked immunosorbent assay; PRM, parallel reaction monitoring.
Various functions of secretory proteins in different HCC-related tissues
Next, we identified the differentially abundant secretory proteins in C and SN tissues by comparing with the DN tissue,which should have the same change tendency in all 10 biological replicates and presented fold change>1.5 or<0.67 in at least 5 biological replicates.Under this standard,there were 22 differentially abundant secretory proteins in the C/DN group(Table S3), and 49 differentially abundant secretory proteins in the SN/DN group (Table S4). Among these differentially abundant secretory proteins, 13 were shared between the two comparison groups(Figure 3F).GO biological process enrichment analysis indicated that these shared proteins mainly participated in extracellular matrix organization, extracellular structure organization,and tissue morphogenesis(Figure S1D),which might be contributing factors for HCC development.In addition,9 differentially abundant secretory proteins that were only found in the C/DN group mainly participated in the disorder of primary metabolism (Figure S1E), which is tightly linked to the development, and even invasion and metastasis of HCC. Meanwhile, 36 differentially abundant secretory proteins that were only found in the SN/DN group mainly participated in acute-phase response, acute inflammatory response, and post-transcriptional regulation on gene expression(Figure S1F),suggesting that the SN tissues are distinctly different from DN tissues. Interestingly, these processes were all related to primary metabolism, suggesting that changes in primary metabolism might play a crucial role in the occurrence of HCC.
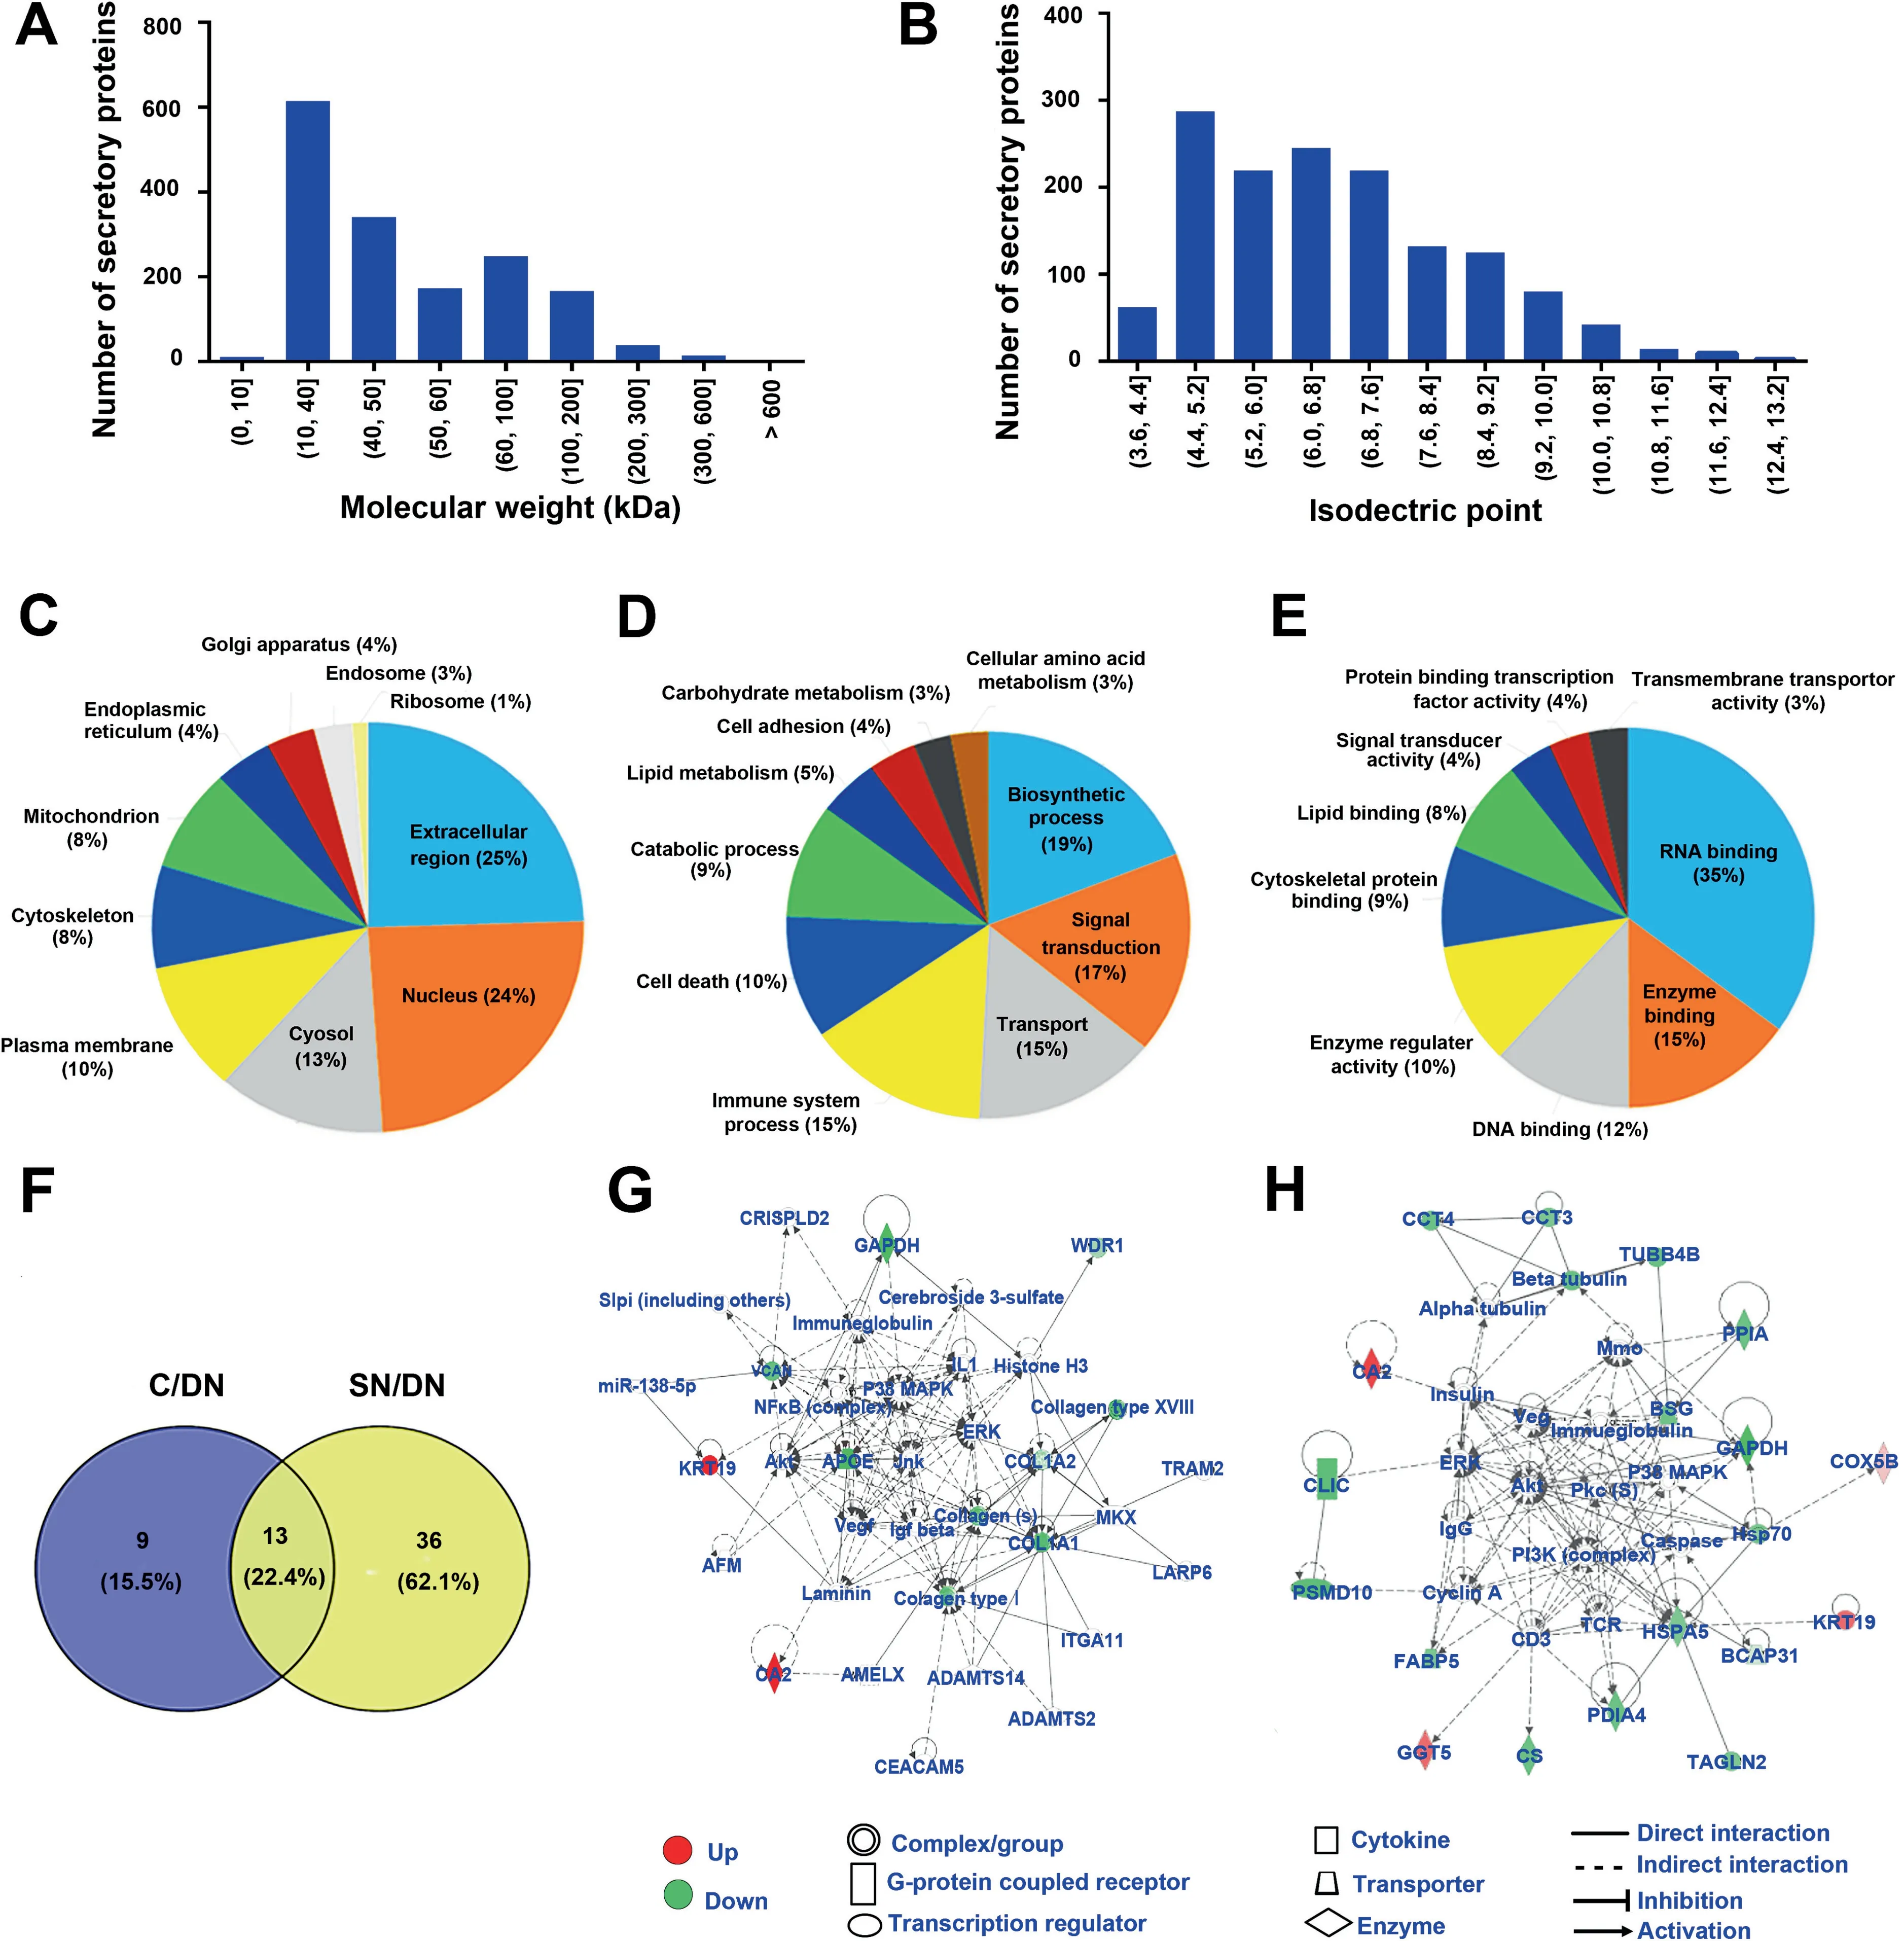
Figure 3 The overall characteristics and GO enrichment analyses for the secretory proteins identified from HCC tissue secretomesA. and B. The distribution of molecular weight (A) and isoelectric point (B) of the identified secretory proteins. C.–E. GO enrichment analyses of the cell components (C), biological processes (D), and molecular functions (E) of the secretory proteins. F. Venn diagrams showing the numbers of differentially abundant secretory proteins in the two comparison groups (the C/DN group and the SN/DN group).G.and H.The signaling pathway networks in which the differentially abundant secretory proteins of the C/DN group(G)and the SN/DN group (H) involved. GO, Genetic Ontology.
To further study the potential molecular mechanisms of the occurrence and development of HCC, Ingenuity Pathways Analysis (IPA) was applied to investigate the signaling pathways in which the differentially abundant secretory proteins participated. The results showed that the two comparison groups (the C/DN group and the SN/DN group) indeed had unique dysregulated signaling pathways, although they also had shared signaling pathways.As shown by IPA,the differentially abundant secretory proteins in the C/DN group were mostly involved in ERK/MAPK signaling, while the differentially abundant secretory proteins in the SN/DN group mainly participated in PI3K-Akt signaling (Figure 3G and H). There were 11 differentially abundant secretory proteins (2 upregulated and 9 down-regulated)participating in ERK/MAPK signaling (Figure 3G). The ERK/MAPK pathway can transduce extracellular signals through intracellular signal transduction cascades to control the expression of proteins that regulate tumorigenesis and aggressive behaviors [23,24].The dysregulation of ERK/MAPK signaling pathway in the C/DN group revealed that the secreted factors from HCC C tissue might modulate tumor microenvironment to exert important roles in tumorigenesis.In the SN/DN group,20 differentially abundant secretory proteins (4 up-regulated and 16 down-regulated) participated in PI3K-Akt signaling(Figure 3H).PI3K-Akt signaling plays a crucial role in the regulation of inflammation and metabolism[25–27].Hence,alterations in the PI3K-Akt pathway might be closely linked to the occurrence and development of tumors. The dysregulation of PI3K-Akt pathway in the secretory environment of HCC SN tissues compared with that of DN tissues suggested the importance of changing microenvironment in tumorigenesis.Targeting these important effectors in tumor microenvironment might be a promising therapeutic strategy.
CA2 might be a valuable biomarker for HCC diagnosis
According to the IPA results, we found that CA2 was upregulated in both the C/DN and SN/DN groups. CA2, a zinc metal enzyme, carries out the reversible hydration of carbon dioxide, and plays a key role in adjusting the pH of tumor microenvironment [28–33]. It is frequently abnormally expressed in different cancers[34–40].Here,the relative intensity of the iTRAQ reporter ions related to CA2 in the MS/MS spectra was in good agreement with the protein level of CA2. As shown in Figure S2,the relative intensities of the iTRAQ reporter ions related to CA2 were remarkably increased in C and SN tissues compared with those in DN tissues(iTRAQ-114> iTR AQ-115 > iTRAQ-116 and iTRAQ-117 > iTRAQ-118 >iTRAQ-119). Therefore, CA2 might be a potential interesting biomarker for HCC diagnosis and prognosis prediction.
Next, we verified the clinical significance of CA2 on HCC diagnosis and prognosis in two additional serum cohorts via the PRM targeted proteomics method and traditional ELISA.The CA2 serum concentration was monitored in 49 HCC patients and 23 healthy volunteers through PRM targeted proteomics. A total of nine peptides from CA2 were identified,seven of which were commonly found in the five iTRAQ-8plex experiments with one carrying a miscleavage site(Table S5). Therefore, only six peptides from CA2 could be used for PRM analysis. The annotated spectra and detailed peptide spectrum match (PSM) information for the six identified CA2 peptides were provided in Table S5 and Figure S3,respectively.Using Skyline,the peak contributions of the individual fragment ions from the unique peptide were determined(Figure S4A), and the representative quantification information based on peak areas of the peptides including endogenic and synthetic heavy peptides is displayed in Figure S4B. The average serum concentration of CA2 in HCC patients was remarkably higher than that in healthy volunteers (HCC patients 13.72 pg/ml vs. healthy volunteers 7.01 pg/ml;P < 0.01). The receiver operating characteristic (ROC) curve analysis of CA2 revealed that the area under the curve(AUC)was 0.715 for HCC patients relative to the healthy volunteers(Figure 4A).These results were consistent with the data from the proteomic studies, indicating that CA2 might be a valuable biomarker for HCC diagnosis.
CA2 is a novel prognostic biomarker for HCC
By analyzing our previous protemoics data of a series of serum samples collected at different time points from four HCC patients after radical resection [41], we found that the serum levels of CA2 in the patients with short-term recurrence were steadily increased from 3 months to 9 months after radical resection compared with the patients with long-term recurrence (Figure S5A). Thus, we cellected the serum samples of 159 HCC patients, containing 94 relapsed patients and 65 relapse-free patients, at 5 months after surgery to analyze the association between CA2 serum concentration and HCC prognosis by ELISA. As shown in Figure 4B, the average serum concentration of CA2 was remarkably upregulated in HCC patients with recurrence compared with HCC patients without recurrence (P < 0.0001). According to the ROC curve, the AUC reached 0.708 in the validation cohort, indicating that CA2 might be a HCC prognostic biomarker. To evaluate the prognostic significance of serum CA2 in HCC,we further studied the cumulative recurrence rate and overall survival rate of patients with low and high serum levels of CA2 using the 159 samples.The median concentration(105.3 ng/mL)was used as the optimal cutoff value to stratify patients into low-CA2 (≤105.3 ng/ml)and high-CA2(>105.3 ng/ml)groups.As shown by the Kaplan-Meier analysis,HCC patients with a high serum CA2 level had a higher recurrence rate than those with a low serum CA2 level. Moreover, the overall survival rate of HCC patients who had a high serum CA2 level was remarkably lower than those with a low CA2 level (Figure 4C). Furthermore, we repeated this study using a training cohort of 49 HCC patients and obtained similar results (Figure S5B). In addition, we found a strong negative linear correlation between CA2 serum concentration and recurrence time, i.e.,the higher the CA2 serum concentration,the shorter the recurrence time(Figure S5C). These results suggested that the CA2 serum concentration might be a novel prognostic biomarker for HCC.
CA2 is a novel prognostic biomarker for AFP-negative HCC patients
As the gold standard for clinical diagnosis and monitoring in HCC, the average serum concentration of AFP was remarkably higher in relapsed HCC patients than that in relapse-free patients (P < 0.001) (Figure S5D). Although the cumulative recurrence rate was substantially lower and the overall survival rate was remarkably higher in AFPnegative patients(AFP serum concentration<20 ng/ml)than those in AFP-positive patients (AFP serum concentration≥ 20 ng/ml) in general, some AFP-negative patients still experienced rapid recurrence or metastasis(Figure S5E).However, there was no significant difference in the average serum concentration of AFP between the relapsed and relapse-free AFP-negative HCC patients (Figure S5F). Therefore, there is an urgent need to identify novel biomarkers that can predict the recurrence/metastasis in AFP-negative HCC patients.Interestingly, among the AFP-negative HCC patients, the average serum concentration of CA2 in relapsed patients was remarkably higher than that in relapse-free patients(P < 0.001) (Figure 4D). Furthermore, in the AFP-negative HCC patients, the cumulative recurrence rate was also higher in patients with a high serum CA2 level, suggesting the prognostic value of CA2 in AFP-negative patients (Figure 4E).However,the overall survival rate did not show significant differences between the high- and low-CA2 groups in the AFPnegative HCC patients (Figure S5G).
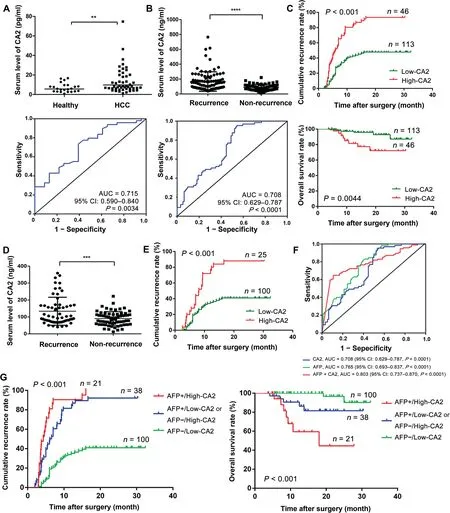
Figure 4 Clinical values of serum CA2 in HCC diagnosis and prognosisA.Distribution(upper panel)and ROC curve(lower panel)of serum CA2 levels in HCC patients and healthy volunteers from the training cohort through PRM targeted proteomics. B. Distribution (upper panel) and ROC curve (lower panel) of serum CA2 levels in HCC patients, with and without recurrence, from the validation cohort assessed by ELISA. C. Comparison of cumulative recurrence rate and overall survival rate between the high-and low-CA2 groups in the validation cohort by Kaplan-Meier analysis.D.Distribution of serum CA2 levels in AFP-negative HCC patients.E.Comparison of cumulative recurrence rate between the high-and low-CA2 groups in AFPnegative HCC patients by Kaplan-Meier analysis. F. AUC of the CA2/AFP combination in HCC patients. G. Prognostic value of the CA2/AFP combination in HCC patients. Two-tailed unpaired Student’s t-test (**, P < 0.01; ***, P < 0.001; ****, P < 0.0001). CA2,carbonic anhydrase II; ROC, receiver operating characteristic; AUC, area under the curve; CI, confidence interval; AFP, alpha fetoprotein.
Combination of serum CA2 and AFP improves prognostic performance in HCC
Considering the prognostic value of CA2 in AFP-negative patients, we then jointly considered the serum levels of CA2 and AFP. As shown in Figure 4F, when serum levels of CA2 and AFP were considered together, the AUC reached to 0.803 for the combination (AUC of 0.708 for CA2 and of 0.765 for AFP),suggesting the clinical values for the combination of these two markers. Next, we evaluated the prognostic value of the CA2/AFP combination for HCC patients in the validation cohort. As shown in Figure 4G, the cumulative recurrence rate of patients in the AFP-/low-CA2 group was remarkably lower than that of patients in the AFP+/high-CA2 group.Correspondingly,the overall survival rate of patients in the AFP-/low-CA2 group was substantially higher than that of patients in the AFP+/high-CA2 group.Patients of the AFP-/high-CA2 and AFP+/low-CA2 groups had moderate cumulative recurrence rate and overall survival rate in the validation cohort. Taken together, these results suggested an improved prognostic value when using the serum levels of CA2 and AFP in combination for HCC patients.
Serum CA2 significantly correlates with tumor size and microvascular invasion
To further study molecular mechanisms of CA2 on the prognosis of HCC, we checked the association of serum CA2 with various clinicopathologic features of HCC patients. As revealed in Table S6, the pearson’s Chi-square test indicated that higher serum CA2 level was significantly correlated with larger tumor size (P = 0.006), more advanced Barcelona Clinic Liver Cancer (BCLC) stage (P = 0.011), and higher post-operation level of AFP (P = 0.004), as well as microvascular invasion (MVI) (P = 0.008) and cirrhosis (P = 0.003),but was not associated with other clinicopathologic features.These results suggested that CA2 might be a metastasis/recurrence-related protein in HCC.
Secreted CA2 increases the migration and invasion abilities of HCC cells by activating epithelial-mesenchymal transition signaling
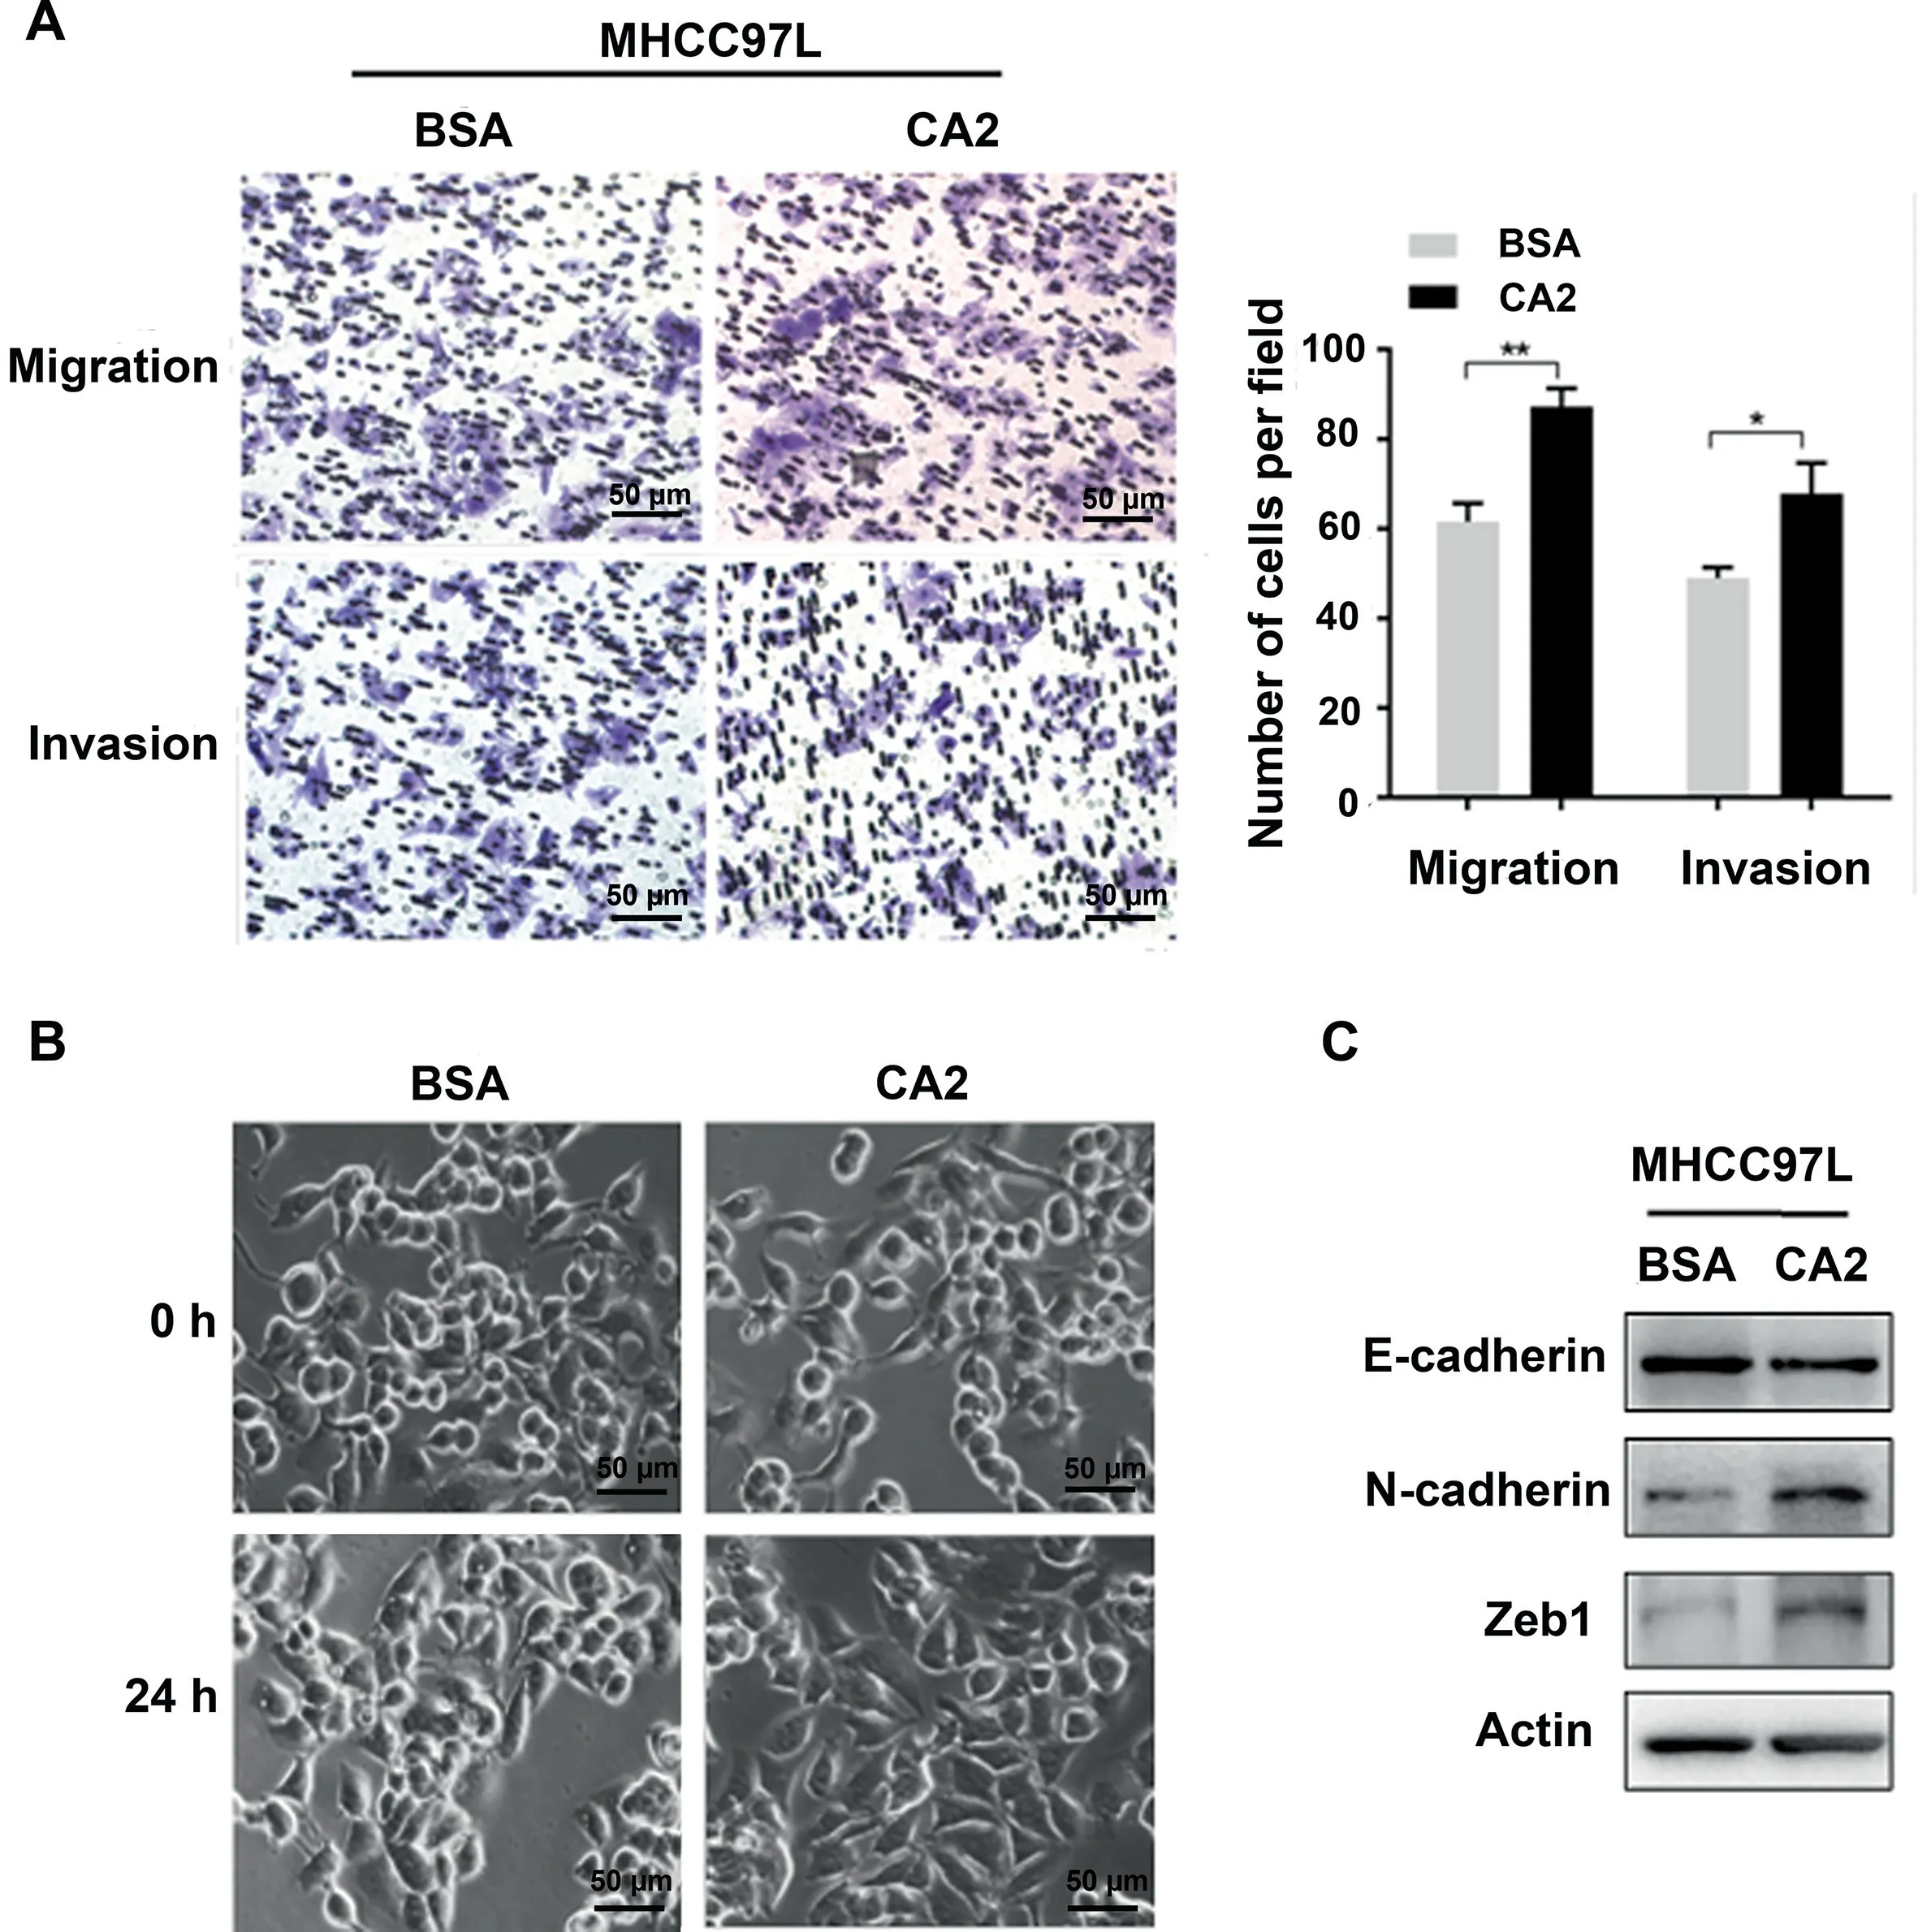
Figure 5 Extracellular CA2 promotes cell migration and invasion through activating EMTA. Representative images and quantification results of migration and invasion of MHCC97L cells treated with exogenous recombinant CA2. B. Cellular morphology of MHCC97L cells treated with exogenous recombinant CA2. Scale bar, 50 μm. C. Western blot showing the expression levels of E-cadherin, N-cadherin, and Zeb1 in MHCC97L cells treated with exogenous recombinant CA2. Two-tailed unpaired Student’s t-test (*, P < 0.05; **, P < 0.01).
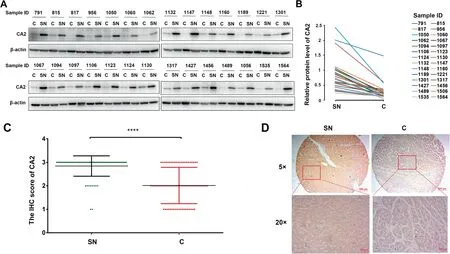
Figure 6 Expression pattern of intracellular CA2 is opposite to its extracellular formA.Western blot showing the intracellular CA2 expression in C tissues and their paired SN tissues in HCC patients.B.Quantification of the intracellular CA2 expression shown in (A). C. Statistical analysis of the intracellular CA2 expression in C tissues and their paired SN tissues on in-house TMAs determined by IHC.D.Representative images of CA2 IHC in a C tissue(score 1)and its paired SN tissue(score 3). Two-tailed paired Student’s t-test (****, P < 0.0001). TMA, tissue microarray; IHC, immunohistochemistry.
To investigate the molecular mechanism of extracellular CA2 in HCC recurrence/metastasis, exogenous recombinant CA2 protein (obtained from Abcam) was used to examine its influences on the migration and invasion of HCC cell line MHCC97L using a trans-well strategy.As shown in Figure 5A,exogenous recombinant CA2 treatment significantly promoted the migration and invasion of MHCC97L cells compared to the control group exposed to the same concentration of BSA(P < 0.05), suggesting that extracellular CA2 enhances cell migration and invasion in HCC, which could explain the observed clinical data. Epithelial-mesenchymal transition(EMT) is well known to be responsible for tumor metastasis.As shown in Figure 5B, the MHCC97L cells treated with exogenous recombinant CA2 exhibited a spindle-like fibroblastic morphology,while the control cells were round with a more epithelial morphology. Such morphological changes indicated that secreted CA2 might be involved in the EMT process. To further investigate the involved molecular mechanisms, the related key markers of EMT were also analyzed. As shown in Figure 5C, the addition of exogenous recombinant CA2 up-regulated N-cadherin (a mesenchymal marker) and downregulated E-cadherin (an epithelial maker); meanwhile, the expression level of Zeb1 (EMT-promoting transcription factor) was also significantly up-regulated by the addition of exogenous recombinant CA2. Taken together, these results demonstrated that secreted CA2 promoted EMT to further modulate the migration and invasion of HCC cells, in turn affecting HCC metastasis.
Intracellular CA2 may perform opposite functions from its extracellular form
We also analyzed the intracellular levels of CA2 in HCC patients. In this experiment, 28 pairs of C and SN tissues of HCC patients were detected by Western blot. As shown in Figure 6A and B,the intracellular CA2 expression was remarkably decreased in C tissues when compared with their paired SN tissues. Meanwhile, the down-regulated expression of intracellular CA2 in C tissues was further confirmed by immunohistochemistry (IHC) using in-house tissue microarrays (TMAs) containing 75 C tissues and their paired SN tissues (Figure 6C and D, Figure S6). These results were exactly opposite from those of the extracellular CA2 in the serum of HCC patients,suggesting that intracellular and extracellular CA2 might carry out opposite functions [42] and the involved molecular mechanisms should be further explored.
Conclusion
Herein, we applied the iTRAQ-based quantitative proteomic approach to investigate the secretome of primary cultures of HCC tissues, and identified secreted CA2 as a diagnostic and prognostic biomarker for HCC. In particular, CA2 showed good predicative performance in AFP-negative HCC patients,and the combination of CA2 and AFP improved the sensitivity and specificity of HCC prognosis. Regarding the mechanism,extracellular CA2 might regulate HCC cell migration and invasion by targeting the EMT signaling pathway to affect HCC patients’ prognosis. This secretome investigation enabled us to identify a novel HCC diagnostic and prognostic biomarker.The information from this study constitutes a valuable resource for further HCC investigation and for identifying potential serological biomarkers of HCC.
Materials and methods
Patients and follow-up
In total, 293 HCC patients and 23 healthy volunteers were enrolled in the current study.All the HCC patients underwent surgical procedures at the Mengchao Hepatobiliary Hospital of Fujian Medical University (Fuzhou, China). Computer tomography (CT) scanning and ultrasonography (US) were used to monitor the absence of intrahepatic recurrence and metastasis in the residual liver. All patients met the enrolment eligibility criteria as follows: 1) The patients were diagnosed with HCC through pathological examination after operation.2) Serum hepatitis B surface antigen (HBs Ag) was positive,and hepatitis B surface antibody (HBs Ab) and hepatitis C virus(HCV)were negative before surgery.3)Standard radical resection was performed:no distal metastasis was found before or during the operation; intraoperative US examination revealed no other liver lesions; no obvious tumor thrombus was found in the hepatic portal vein or primary venous branch;postoperative pathological examination showed no cancer cells at the cutting edge;and no recurrence/metastasis was found in the US and CT examination two months after the operation.4)Serum AFP was increased before operation and decreased to normal level two months after surgical operation. 5) The patient had not received any other intervention or treatment before surgery.
For the proteomic analysis, C, SN, and DN tissues were obtained from ten HCC patients who underwent surgical operation. Serum from 49 HCC patients before hepatectomy and 23 healthy volunteers in a health screening program at the Mengchao Hepatobiliary Hospital of Fujian Medical University were collected for PRM analysis. Another validation serum cohort from 159 HCC patients after hepatectomy with long-term follow-up that ended with death was used for ELISA.The collection of serum samples was strictly controlled following the in-house standard operating procedure, which was established on the basis of the previous study[43].In addition,a total of 75 formalin-fixed and paraffin-embedded C tissues and their paired SN tissues from HCC patients who underwent surgical resection were collected to generate the TMAs for IHC investigation.
In vitro tissue culture and quality control
Following surgical operation, the primary tissue specimens were immediately transferred into PBS on ice and sent to the laboratory within 30 min. The tissues were then rinsed and cut into 2–3 mm3pieces, and extensively washed several times at room temperature (RT) with PBS to eliminate major blood and serum contaminants. Subsequently, the samples were transferred to 10-cm cell culture dishes and incubated in serum-free DMEM medium supplemented with 1% penicillin and streptomycin at 37 °C. For protein extraction, the supernatants were centrifuged at 100 g for 2 min at 4 °C to further remove all remaining cells and debris; the samples were then concentrated with a 3 K cutoff centrifugal filter device (Catalog No. UFC500396, Millipore, Billerica, MA) and stored at-80 °C until further analysis.
Culture medium was collected every 4 h in following 72-h period (a total of 18 time points). The proteins extracted from every time point were subjected to 10%SDS-PAGE to analyze the molecular weight distribution, and Western blot was performed to determine any contamination by intracellular proteins. At the same time, the cultured tissues collected at every time point were evaluated by histological observations.The cultured tissues were fixed in 10% neutral formaldehyde,and paraffin sections were made in the conventional way.One slide was stained with H&E (Catalog No. D006, Nanjing Jiancheng Bioengineering Institute, Nanjing, China) and observed under an optical microscope (AE2000, Motic, Xiamen, China); another slide was biotin-labeled and stained by TUNEL to detect cell apoptosis during the culture period.Finally, the slides were observed under a confocal microscope(LSM 780, Carl Zeiss, Jena, Germany).
Bottom-up proteomics and data analysis
The proteomic studies and data analyses were modified from our previously reported protocols[44].Briefly,the thiol groups of the proteins extracted from the aforementioned culture supernatants of three groups (C, SN, and DN) were reducted with 8 mM DTT at 55 °C for 1 h, and alkylated with 50 mM iodoacetamide for 30 min in dark at RT. Then, the proteins were precipitated by ice-cold acetone (5× volume),and re-dissolved in 100 mM tetraethyl-ammonium bromide(TEAB). Subsequently, 100 μg of each protein sample was digested by trypsin (Catalog No. V511, Promega, Madison,WI) using filter aided sample preparation (FASP), and the peptides were labeled with the 8-plex iTRAQ reagent(Catalog No. 4381663, AB SCIEX, Boston, MA) as follows: C group,SN group, and DN group were labeled with 114, 115, and 116,respectively;and one biological replicate of the aforementioned three groups was labeled with 117,118,and 119,respectively. A, B, C, D, and E were defined as the five independent replicates of iTRAQ 8-plex labeling. In addition, ten DN group samples mixed in equal amounts were labeled with 113 and included in every 8-plex labeling reaction as an internal standard to balance each 8-plex labeling. The labeled peptides were mixed in equal amounts in every 8-plex labeling and desalted by sep-pak vac C18cartridges (Catalog No.WAT023590, Waters, Milford, MA). The samples were then dried by the vacuum centrifuge (Catalog No. 7310038,LABCONCO, Kansas, MO) for further use.
The peptide mixture was separated using an offline LC system (Acquity UPLC, Waters) via high-pH separation.High-pH (pH = 10) separation was performed in a reversephase column (C18, 2.1 mm × 50 mm, 1.7 μm; catalog No.186002350, Waters) using a 20-min linear gradient from 5%B buffer to 35% B buffer [A buffer: 20 mM ammonium formate in water; B buffer: 20 mM ammonium formate added in 90% acetonitrile (ACN), ammonium hydroxide was used to adjust the pH].Finally,a total of 30 fractions were collected and 2 equal-interval fractions were combined to reduce the MS running time, such as 1 and 16, and 2 and 17 [45]. In total, 15 fractions were dried and subsequently separated on a nano-LC system (Nano-Aquity UPLC, Waters) with a 75-min linear gradient from 2% D buffer to 40% D buffer (C buffer:0.1% formic acid in water; D buffer: 0.1% formic acid in ACN), which was performed on an analytical column (C18,75 μm×15 cm,3 μm;catalog No.164534,ThermoFisher Scientific, Waltham, MA). Next, the peptides were detected by MS(Q-Exactive,ThermoFisher Scientific)with 2.1 kV electrospray voltage at the mass spectrometer inlet.In addition,70 K mass resolution was applied in the full-scan of MS spectra processing (m/z 350–1200), and 17.5 K resolution was used in the following 15 sequential MS/MS scans of high energy collisional dissociation. In all studies, 1 microscan was recorded by using a dynamic exclusion of 30 s.
The data processing strategy was also carried out according to our previous publication,with certain modification[44].The LC–MS/MS data were processed using Proteome Discoverer(version 1.4, ThermoFisher Scientific) and searched using the Sequest HT (ThermoFisher Scientific) search algorithms against the human database(20,264 entries,UniProt,released at April 10, 2014). Proteome Discoverer was searched with trypsin for protease digestion and maximally we only allowed two missed cleavages. Ten parts per million (ppm) parent ion tolerance and 0.02 Da fragment ion mass tolerance were set according to MS precision. Fixed modifications included the iTRAQ labeling of lysine and the peptide N-terminus and the carbamidomethylation of cysteine,while the variable modifications included the iTRAQ labeling of tyrosine and the oxidation of methionine. In addition, Scaffold (version 4.3.2,Proteome Software, Portland, OR) was used to validate MS/MS-based peptide and protein identifications. Peptide identifications were accepted if they could be established at greater than 90.0%probability to achieve a false discovery rate(FDR) less than 1.0% by the Scaffold local FDR algorithm.Protein identifications were accepted if they could be established at greater than 92.0%probability to achieve a FDR less than 1.0%and contained at least two identified peptides. Protein probabilities were assigned by the protein prophet algorithm. Proteins that contained similar peptides and could not be differentiated based on MS/MS analysis alone were grouped to satisfy the principles of parsimony. For protein quantitation, we only considered peptides that were unique to a certain given protein. The fold change between different samples was calculated by the ratio between iTRAQ reporter ion intensity and MS/MS spectra (m/z 113–119).
Two complementary methods were combined to further characterize the secretory proteins. First, MetazSecKB, a secretome proteome knowledgebase of metazoan, was performed to screen secretory proteins, which is the most direct source to characterize the secretory proteins. Second, SecretomeP (version 2.0, DTU Health Tech, Lyngby, Denmark),a sequence-based prediction strategy for mammalian secretory proteins, was used to classify the secretory proteins:the classical secretory proteins could be correctly predicted with an N-terminal signal peptide; non-classical secretory proteins without an N-terminal signal peptide could be correctly predicted as secretory according to an NN-score> 0.6. The proteins without an N-terminal signal peptide but having a low NN-score would not be identified as secretory proteins.
The GO annotation and signaling pathway investigation of differentially abundant secretory proteins were performed using the free online tool DAVID (http://david.abcc.ncifcrf.-gov/). The enriched signaling pathways of the differentially abundant secretory proteins were analyzed using IPA (version 7.5, Ingenuity Systems, Redwood, CA).
Targeted proteomics and data analysis
Before applying the targeted proteomic method of PRM analysis, the 14 most abundant proteins in serum samples were depleted by an immunoaffinity column IgY14 LC20 (Catalog No. 5188-6557, Agilent, Santa Clara, CA). The depletion was performed on an Agilent 1260 HPLC system (1260 Infinity, Agilent) following the manufacturer’s protocol. The depleted serum was concentrated and the buffer was exchanged to 100 mM TEAB using amicon 3 K concentrators(Catalog No. UFC500396, Millipore). The procedures for serum protein denaturation, reduction, alkylation, and digestion were described above.
For PRM analysis, the unique peptides for CA2 were synthesized by fmoc solid-phase synthesis with isotope-labeled on the carboxyl side of the amino acid lysine (13C6,15N2) and purified by HPLC with purity > 99% (Anhui Guoping Pharmaceutical, Hefei, China). The heavy-labeled peptides were mixed and spiked into the tryptic digests of serum proteins at a concentration of 30 fg/μl. Detailed information for the unique CA2 peptides is displayed in Table S5.The unique peptides for CA2 should preferably have a narrow, symmetrical chromatographic peak,be 8–25 amino acids in length and ionize efficiently, provide a stable and intense signal without any modification, and not be eluted at the beginning or end time.
The PRM analyses were also performed on a mass spectrometer(Q Exactive Plus,ThermoFisher Scientific).LC separation was executed with a trap column (C18, 75 μm × 2 cm,3 μm; catalog No. 164946, ThermoFisher Scientific) and an analytical C18column (C18, 75 μm × 15 cm, 3 μm; catalog No. 164534, ThermoFisher Scientific) on a nano-LC system(EASY-nLC 1000,ThermoFisher Scientific).2 μl of the tryptic digests and depleted serum samples were injected,and a gradient of 2% D buffer up to 35% D buffer over 30 min was applied. In all experiments, a PRM scan was performed at m/z 200,with a resolution of 70 K,an automated gain control target of 1×10⁶,a maximum injection time of 200 ms,and an isolation window of ± 2. In addition, a normalized collision energy of 27% was used for ion dissociation, and a fixed first mass at m/z 120 was set. The inclusion list including the m/z and corresponding retention time of precursor peptides of interest is displayed in Table S5.
The PRM raw data were analyzed with Skyline software(version 4.2, MacCoss Lab Software, Washington, WA), and a 5-min window was used.The sum of peak areas of the 5 most intense product ions was considered for protein quantification.Some ions needed to be excluded, e.g., the ions that did not match the retention time of other monitored ions, or that showed interference signals, or that gave intense signals at other retention time.
ELISA
The serum levels of CA2 in HCC patients were analyzed using an ELISA assay kit (Catalog No. LS-F29508, LifeSpan BioScience,Seattle,WA)following the manufacturer’s instructions.Briefly, the standard proteins and patient serum samples were diluted with the sample dilution buffer and then 50 μl of the diluted standard proteins and serum samples were added to 96-well plates. Next, 100 μl of horseradish peroxidase(HRP)-conjugate solution was added to each well and incubated for 1 h at 37 °C. Then, the plate was washed four times with PBS,and 100 μl of chromogen solution(1:1 of solution A and solution B) was added to each well and further incubated for 15 min at 37 °C. Finally, 50 μl of stop solution was added to stop the reaction, and the optical density at 450 nm was measured by a spectrophotometer(SpectraMax M5e,Molecular Devices, San Jose, CA).
Western blot
Western blot was performed according to a previous publication [44]. Briefly, proteins were separated on 12%SDS-PAGE and then transferred to a nitrocellulose membrane. The membrane was blocked in 5% BSA at RT for 2 h, and then incubated with the primary antibody against CA2(1:1000;catalog No.ab226987,Abcam,Cambridge,England) at 4 °C overnight. Subsequently, the mambrane was washed four times with TBST buffer,and then incubated with the corresponding secondary antibody(Catalog No.HS101-01,TransGen Biotech,Beijing,China)at RT for 1 h.Next,the blot was washed four times with TBST buffer, revealed using enhanced chemiluminescence reagents (Catalog No. 34080,ThermoFisher Scientific), and visualized by autoradiography.
Immunohistochemistry
IHC was carried out on HCC TMAs according to a previous publication [46]. Briefly, after pre-treating at pH = 6 and blocking with peroxidase, the sections were further incubated with the primary antibody against CA2 (1:50; catalog No.ab226987, Abcam) for 0.5 h. The sections were then treated with EnVision FLEX/HRP reagent (Catalog No. K8000,Dako, Glostrup, Denmark) for 20 min, washed three times,treated with the EnVision FLEX-DAB chromogen (Catalog No. DM827, Dako) for 3 min, and stained by Mayer’s hematoxylin (Lille’s Modification) for 3 min. They were then washed in distilled water for 5 min. All pathological sections underwent double-blind scoring as follows: negative (0), weak(1),strong (2),or very strong(3)by two different pathologists double-blindly.A score of 0 or 1 indicates low expression,and a score of 2 or 3 indicates high expression.
Cell migration and invasion assays
Cell migration and invasion assays were carried out according to our previously published protocols [44]. The cell migration ability was investigated by using transwell units with 8-μm pores (Catalog No. 3428, Corning Incorporated, Corning,NY), and cell invasion was investigated by using 24-well transwell inserts that had been precoated with matrigel with 8-μm pores (Catalog No. 354480, BD Biosciences, Franklin Lake,NY).A total of 1×10⁵cells treated with exogenous recombinant CA2 (Catalog No. ab85484, Abcam) or BSA were cultured in serum-free medium in the upper chamber. To induce cell invasion and migration, DMEM supplemented with 10%FBS was placed in the lower chamber. The cells that adhered to the lower surface were then fixed with paraformaldehyde after 18 h of incubation and then stained by crystal violet(0.1%). The cells that adhered to the bottom surface were counted within 5 different views under a microscope using 20× magnification.
Statistical analysis
A threshold for the iTRAQ ratio was set to screen secretory proteins whose abundance was substantially changed in the C or SN tissue group compared with its corresponding DN tissue group.The proteins were defined as differentially dysregulated if the iTRAQ ratio was higher than 1.5 or lower than 0.67 in at least 5 patients, and they also must have the same direction of alteration in all 10 biological replicates. The iTRAQ ratio was based on a comparison of the reporter ion intensities between the C or SN tissue group and the corresponding DN tissue group.
SPSS 19.0 was used for statistical analysis. Two-tailed unpaired Student’s t-test was used to compare quantitative data of CA2 from PRM and ELISA between two groups.Fisher’s exact test was applied to analyze the relationships between CA2 and clinical-pathological features. The Kaplan-Meier method was applied to calculate survival curves, while the differences were determined by using a log-rank test.Two-tailed paired Student’s t-test was used to compare quantitative data of CA2 from IHC between C and SN groups. In all analyses, P < 0.05 was considered statistically significant.
Ethical statement
This project was approved by the Institution Review Board of Mengchao Hepatobiliary Hospital of Fujian Medical University, Fuzhou, China. Informed consent was obtained from each participant before the operation.The use of clinical specimens was completely in compliance with the ‘‘Declaration of Helsinki”.
Data availability
The MS-based proteomic data have been deposited to the integrated proteome resources (iProX: IPX0001425001) [47], and are publicly accessible at https://www.iprox.cn/.
CRediT author statement
Xiaohua Xing: Conceptualization, Methodology, Software,Validation, Formal analysis, Investigation, Data curation,Writing - original draft, Funding acquisition. Hui Yuan:Methodology,Validation.Hongzhi Liu:Methodology,Validation. Xionghong Tan: Methodology, Validation. Bixing Zhao:Methodology, Funding acquisition. Yingchao Wang: Methodology, Resources. Jiahe Ouyang: Validation, Data curation.Minjie Lin: Resources. Xiaolong Liu: Conceptualization,Methodology, Supervision, Writing - original draft, Writing -review & editing, Project administration. Aimin Huang: Conceptualization, Supervision, Funding acquisition. All authors read and approved the final manuscript.
Competing interests
The authors have declared no competing interests.
Acknowledgments
This work was supported by the National Natural Science Foundation of China (Grant Nos. 81702910 and 81672376),the Educational Commission of Fujian Province, China(Grant No. 2018B013), and the Natural Science Foundation of Fujian Province, China (Grant Nos. 2019J01298,2017J01159, and 2016J01417). We thank Prof. Ping Xu and Dr. Yang Zhang for their help in proteomics data analysis.
Supplementary material
Supplementary data to this article can be found online at https://doi.org/10.1016/j.gpb.2020.09.005.
ORCID
0000-0001-8971-8577 (Xiaohua Xing)
0000-0002-7858-3539 (Hui Yuan)
0000-0001-7102-6855 (Hongzhi Liu)
0000-0001-9113-4159 (Xionghong Tan)
0000-0002-0055-3989 (Bixing Zhao)
0000-0003-3590-9233 (Yingchao Wang)
0000-0001-9248-8805 (Jiahe Ouyang)
0000-0002-0523-2922 (Minjie Lin)
0000-0002-3096-4981 (Xiaolong Liu)
0000-0002-3141-0315 (Aimin Huang)
 Genomics,Proteomics & Bioinformatics2021年1期
- Genomics,Proteomics & Bioinformatics的其它文章
- Genome-wide 5-Hydroxymethylcytosine Profiling Analysis Identifies MAP7D1 as A Novel Regulator of Lymph Node Metastasis in Breast Cancer
- The Role of DNA Methylation Reprogramming During Sex Determination and Transition in Zebrafish
- DNA Methylation Reshapes Sex Development in Zebrafish
- Glycoproteogenomics: Setting the Course for Next-generation Cancer Neoantigen Discovery for Cancer Vaccines
- Computational Screening of Phase-separating Proteins
- PM2RA: A Framework for Detecting and Quantifying Relationship Alterations in Microbial Community