
Estimating Mechanical Vibration Period Using Smartphones
2021-10-22 08:24:34WANGJiacheng王佳程CHANGShan
WANG Jiacheng (王佳程), CHANG Shan (常 姍)
1 School of Computer Science and Technology, Donghua University, Shanghai 201620, China 2 Shanghai Key Laboratory of Computer Software Evaluating and Testing, Shanghai 201112, China
Abstract: Driven by a wide range of real-world applications, significant efforts have recently been made to explore facile vibration measurement. Traditional vibration inspection systems are normally sensed via accelerometers, laser displacement sensors or velocimeters, and most of them are neither non-intrusive nor wide-spread. This paper presents a novel solution based on acoustic waves of commercial mobile phones to inspect mechanical vibration. The core observation is that the Doppler effect occurs when acoustic waves pass through a vibrating object. The study leverages this opportunity to build a bridge between the Doppler frequency excursion and the vibrating frequency of objects. The solution of difference operation of the reassignment vector is used to make time-frequency domain images more readable. Finally, by processing time-frequency images, the system further accomplishes two reconstruction approaches to find out the energy concentration of acoustic signals respectively based on ridges and clustering. Simulation and real-life applications are employed to show the effectiveness and practicability of the proposed approaches. Our prototype system can inspect the vibration period with a relative error of 0.08%. Furthermore, this paper studies two practical cases in life to associate our measurement solution with the requirements of daily life.
Key words: vibration sensing; Doppler effect; density clustering; ridge extraction
Introduction
Mechanical vibration exists in every corner of life. Harmonic vibration is one of the simplest periodic vibration[1]. It refers that the object leaves the equilibrium position of displacement according to the law of cosine or sine which keeps reciprocating motion over time, such as the spring oscillator, pendulums. In engineering, the vibration of a car engine or fan rotation is ubiquitous, which has a profound impact on our daily life and work. Under normal circumstances, mechanical vibration maintains an inherent frequency called “fundamental frequency”. The vibration equipment can run steadily with repeated motion depending on the fundamental frequency. When the frequency of the vibrating object exceeds the threshold, the equipment cannot work normally, and may even cause dangerous consequences. Therefore, many applications should conduct a real-time monitoring on the frequency of vibrating objects[2].
Traditional approaches for vibration sensing require specialized sensors. Most of them usually use separate modules equipped with professional devices. However, the equipment is expensive and limited by the environment and the vision. The traditional sensing methods need special sensors (e.g., acceleration[3], velocity[4]and displacement sensor[5]), which need to be connected with the measured vibration objects. For example, the accelerometer is limited by frequency-selections. The vibration object with a higher frequency will generate greater acceleration, and the ordinary accelerometer cannot meet the requirement of the measurement of high-frequency vibration resulting in a large error rate. The laser displacement sensor is characterized by high straightness, beam concentration, and strong energy per unit beam. It can provide higher accuracy in detecting the position, displacement, vibration and other changes of the vibrating object. However, the disadvantage of laser sensors is that they cannot accurately measure mechanical vibration without line of sight. These are not universal solutions for vibration sensing because they are relatively complex and difficult to deploy in industry.
In this paper, we focus on the ubiquitous devices, mobile phones, for vibration measurement. With the continuous promotion and popularization of smartphones, there are more than one billion users of smartphones in the world, and the number is still increasing constantly. Many sensors are assembled into smartphones such as microphones, speakers, magnetometers, gyroscopes, accelerometers, photosensitizers and thermometers[6]. The speaker and microphone are the most widely used sensors among them. They are used to send and receive acoustic signals respectively. In this work, we use the speaker and microphone of the smartphone to inspect the vibration through the reflected ultrasound signals hitting from the vibrating object. We present a novel solution to make sense of vibration using mobile phones based on ultrasound signals. Our objective is to reach the target that the system can provide a convenient, low-cost and non-invasive method of vibration measurement. We combine speakers and microphone of the smartphone. The speaker sends an ultrasound signal of a fixed frequency which is reflected by the vibrating object and received by the microphone. Based on the Doppler effect, the echo contains the periodic frequency shift of the vibration object when it is moving forward and backward. We discern the vibration period through the shift of frequency. We establish the model of the corresponding relationship between the period of the vibrating object and the frequency shift of the echo signal.
To this end, after converting signals from the time domain to the time-frequency domain, we design a reassignment algorithm to enhance the readability of the time-frequency image. We further propose two reconstruction algorithms to find out the energy concentration of acoustic signals respectively based on ridges and clustering. We experiment on a vibrating platform to verify our methods and extend our system to two practical cases.
1 Proposed Method
1.1 Overview of the proposed system
Our system is a universal solution for inspecting the vibration of objects. In this paper, a general method based on mobile phone ultrasonic signals is proposed to solve the mechanical vibration measurement. Firstly, the smartphone sends a fixed frequency of acoustic signals. Then the microphone receives the reflected signal hitting from vibrating objects. Secondly, the reflected signal carry information of vibrating objects caused by Doppler frequency shift which can be shown in time-frequency images. However, the time-frequency images suffer from low resolution, which is to the disadvantage of analyzing and extracting the period of vibrating objects. Thirdly, after recovering the time-frequency images, two approaches are applied to obtain the fundamental frequency. The architecture of the system is shown in Fig. 1.
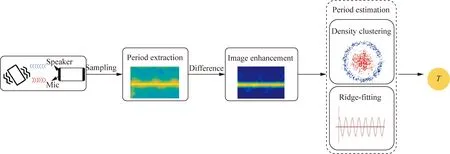
Fig.1 Architecture of the system
1.2 Enhancing time-frequency readability
Due to the acoustic multipath effect, the acoustic signals received by the microphone include two components of the signal. One is the direct path propagating directly from the loudspeaker to the microphone and the other is the reflected path representing the echo signal reflected by many objects. Assuming that the signal received by the microphone is the superposition of multiple signals. Mathematically, this is defined as
(1)
wheream(t) is the amplitude of each component,Fm(r) is the instantaneous frequency (IF),φmis the initial phase, andη(t) represents the noise. The amplitude and frequency of the components are slowly varying functions. The complex signal model in Eq. (1) is widely used in practical applications such as radar.
However, Eq. (1) cannot reveal the frequency of signals varying with time. We should obtain the time-frequency representation of the signal by time-frequency transforms. The short-time Fourier transform (STFT) is the sequence of the windowed signal through Fourier transform, which is a time series in essence. The STFT provides the information of the frequency of the signal varying with time, while the standard Fourier transform only provides the information of the frequency of the signal in the whole period[7]. The STFT convert signals from the domain frequency to the time-frequency domain and defined as
(2)
whereTstf(t,f) is the obtained time-frequency representation, andhw(τ) is a window with the length ofw.
Since the audible range of human voice is 0- 20 kHz, we select the 20 kHz sine signal as the sending acoustic wave. When the sound frequency exceeds 18 kHz, the human ear can hardly hear the voice in most environments.
The time-frequency image always has a problem of low resolution. To solve this problem, this paper adopts the method of reassignment to enhance the readability of the time-frequency image[8-10]. The basic idea is to move each pixel representing energy on the time-frequency graph from its initial point to the center of gravity of the local energy of the signal, which is called redistribution. The changes in signal frequency over time are usually related to the local maximum values on the time-frequency graph, which forms curves called ridges. To compensate for time-frequency deviation caused by two-dimensional smooth spectra, a meaningful time-frequency position is determined so that it can be allocated to the local energy given by the spectrum diagram. For a point whose coordinate on the time-frequency diagram is(t,f), the derivative of its energy in the direction of time and frequency can be derived from Eq. (2) as
(3)
(4)
(5)
whereVr(t,f) represents the reassignment vector.
According to Eq. (5), the ridge point corresponds to the rapidly changing position of theVr. However, it is random and unstable to find ridge points with high energy value in a discrete matrix. Therefore, this paper projectsVrto a specific direction, and then determines the changing position of the projection symbol. After finding the direction of the maximum value ofVr, it determines the position of the ridgeline. We segment the contour of the ridgeline according to the ridge point of the spectrogram sorting the contours in descending order. After getting a series of ridges corresponding to energy attenuation, we move the smaller energy points to the center of the ridge. This will concentrate the diffused energy on the ridgeline. Finally, the time-frequency signal is reconstructed on the time-frequency image to obtain higher resolution, which increases the readability of the time-frequency image. Figure 2 shows the result of the reassignment technique. The readability of the time-frequency domain has been enhanced.
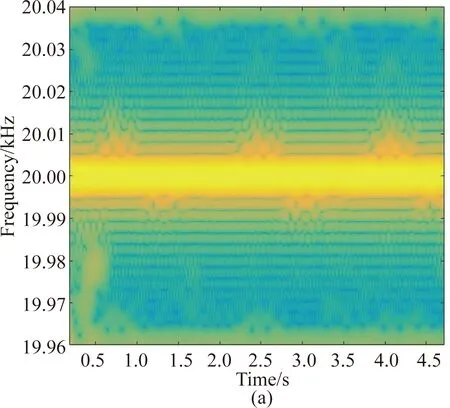
Fig. 2 Enhancing the readability of the time-frequency image by reassignment algorithm:(a) time-frequency image before filtering; (b) time-frequency image after filtering
1.3 Discovering the vibration period based on density clustering
Density-based spatial clustering of applications with noise (DBSCAN) clustering analysis is an unsupervised learning method[11-12]. It divides data points into specific clusters or groups, so that data points in the same cluster have similar properties, while data points in different clusters have different characteristics. This paper estimates the vibration period generated by the Doppler shift in the time-frequency domain. Compared with DBSCAN, we develop the density-and-location based (DLB-SCAN) algorithm conforms to the task of this paper more pertinently because it merges column cluster classesn. The DLB-SCAN can identify the number of clusters and outliers. The number of clusters represents the vibration period within a certain time frame.
The clustering result of the DLB-SCAN algorithm mainly depends on two parameters: optimal epsilon (OE) and minimum point (MP). OE represents the distance threshold of the ε-neighborhood. The sample points whose sample distance exceeds ε are not in the ε-neighborhood. MP represents the threshold of the ε-neighborhood samples so that the central point will become the core point.
This paper adopts an adaptive DBSCAN parameter selection method, which is based on the differential evolution algorithm. This method can quickly and automatically assign appropriate parameter values to OE and MinPts. The differential evolution (DE) algorithm algorithm is a new continuous space global optimization evolutionary synthesis method[13]. The differential evolution algorithm is composed of three basic operators: mutation, crossover and selection[14]. Mutation is the most important operator in the differential evolution algorithm because it generates new elements for the population, which may contain the optimal solution of the objective function. The differential evolution algorithm consists of the following parts.
(1) Initialization: creating anyn-dimensional initial population:
(6)
(2) Mutation: the differential evolution algorithm randomly selects three population vectorsxp1,xp2,xp3(p1≠p2≠p3) and the generated mutation vector is
hi=xp1+η(xp2-xp3).
(7)
(3) Crossover: by reorganizingxiandhi, generating a new individual expressed as
(8)
(4) Selection: using the greedy algorithm to choose a better one between the next-generation test individualUiand the parent vectorxithrough the fitness or cost functionf
(9)
According to the process of differential evolution algorithm, the adaptive parameter method of DBSCAN is constructed. DBSCAN based on differential evolution algorithm adopts a binary coding scheme, and the parameter MP of each individual is represented by a binary bit string. It calculates the optimal fitness function of each individual according to the purity metric, and keep the maximum purity as the optimal solution. Purity is defined as
(10)
In each iteration, the OE parameter will be calculated and compared with the OE value stored in the previous iteration. The combination of OE and MP values that maximizes the fitness function is selected. Figure 3 shows the result of purity based on the differential evolution algorithm under different combinations of OE and MinPts. It can be seen that the purity reaches the maximum when the OE value is 2.5 and the MP value is 40. The number of data sample points in this paper is 220 500 that is relatively large. According to the experience obtained from many experimental analyses, we should choose a larger value when choosing the initial value of MP to reduce the number of iterations.
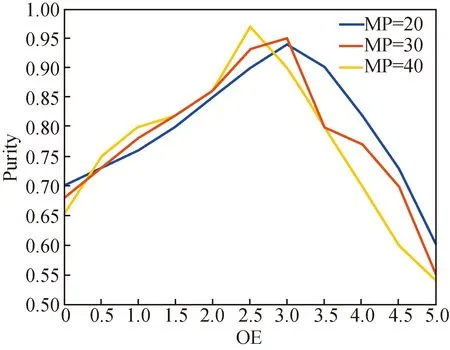
Fig. 3 Purity values of different OE and MP combinations
After the selection of two parameters, OE and MP, we verify the feasibility of the DBSCAN clustering method. Because the vibration of the vibrating object is a cyclic reciprocating motion, the Doppler effect causes the frequency shift on the frequency spectrum. In Fig. 2, it can be observed that the frequency of 20 kHz periodically shifts up and down, which means that the periodic feature of the frequency shift reflects the vibration frequency of the vibrating object. The paper intercepts the lower part of the 20 kHz frequency offset. To reduce the amount of calculation, we select 200 000 sample points, the sampling frequency is 44 100 Hz, and the time corresponding to 20 000 sample points is 4.5 s in Fig. 4(a).
Figure 4(b) shows that there are three periodic vibration changes. The parameters are set to OE and MP corresponding to the maximum purity in Fig. 3, which are 2.5 and 40, respectively. The result of clustering is shown in Fig. 4(c). The sample points in the concentrated areas are divided into clusters and marked with the same color. The clustering results divide the sample points with purple, red and yellow points to distinguish the different clusters. In the case of the ground truth, the vibration object of 40 r/min will vibrate 3 times in 4.5 s. On the time-frequency image, there will be three frequency shifts in 4.5 s, which is consistent with the clustering result.

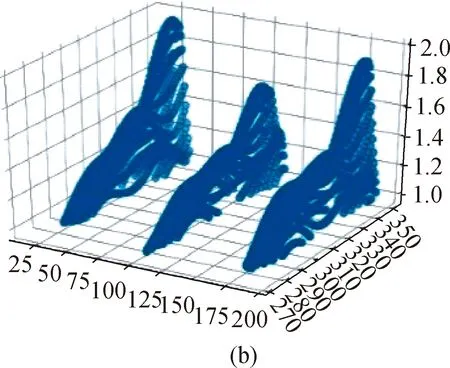
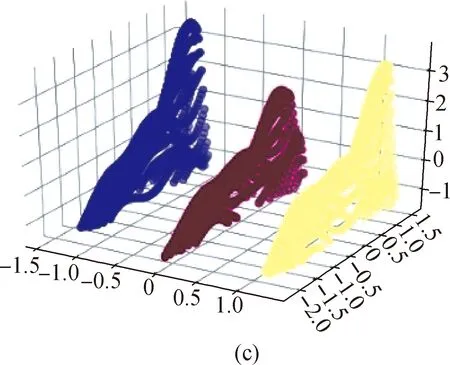
Fig. 4 Result of DBSCAN clustering method:(a) raw data; (b) data after processing;(c) data after clustering
1.4 Discovering the vibration period based on ridge fitting
The ridgeline represents a geographical feature, which is composed of a series of mountains or hills, forming a continuous ridge within a certain distance. As shown in Fig. 4 (a), the uplifted part like a ridge in the time-frequency image is sample points with higher energy, which indicates that the signal has a certain frequency component at that moment. This paper proposes a ridge extraction method based on the energy offset at the center frequency to characterize the energy change in the time-frequency image, and then obtain the frequency shift properties of the Doppler effect around the center frequency to estimate the period of the vibrating object.
1.4.1Ridgepointsdetermination
The paper will determine the value of the frequency corresponding to the maximum energy at a certain moment in the time-frequency image. The details of the algorithm are shown in Fig. 5. Figure 6 shows a column of the matrix after the echo signal has undergone an STFT. This column represents the frequency energy distribution at that moment which means power spectral density (PSD). We calculate the energy frequency shift on the left and right sides caused by the Doppler effect at the center frequency of 20 kHz. It can be seen in Fig. 5 that the area enclosed by the shifted energy on the right is larger than that on the left. The frequency deviation is greater than the center frequency of 20 kHz, which means that the moving direction of the vibrating object is closer to the mobile phone. We use the peak detection algorithm to obtain the frequency value corresponding to the position of the energy spike on the right (the three triangles on the right in Fig. 6), and use the formula of the center of gravity (CG) to calculate the abscissa of the offset ridge points[15].
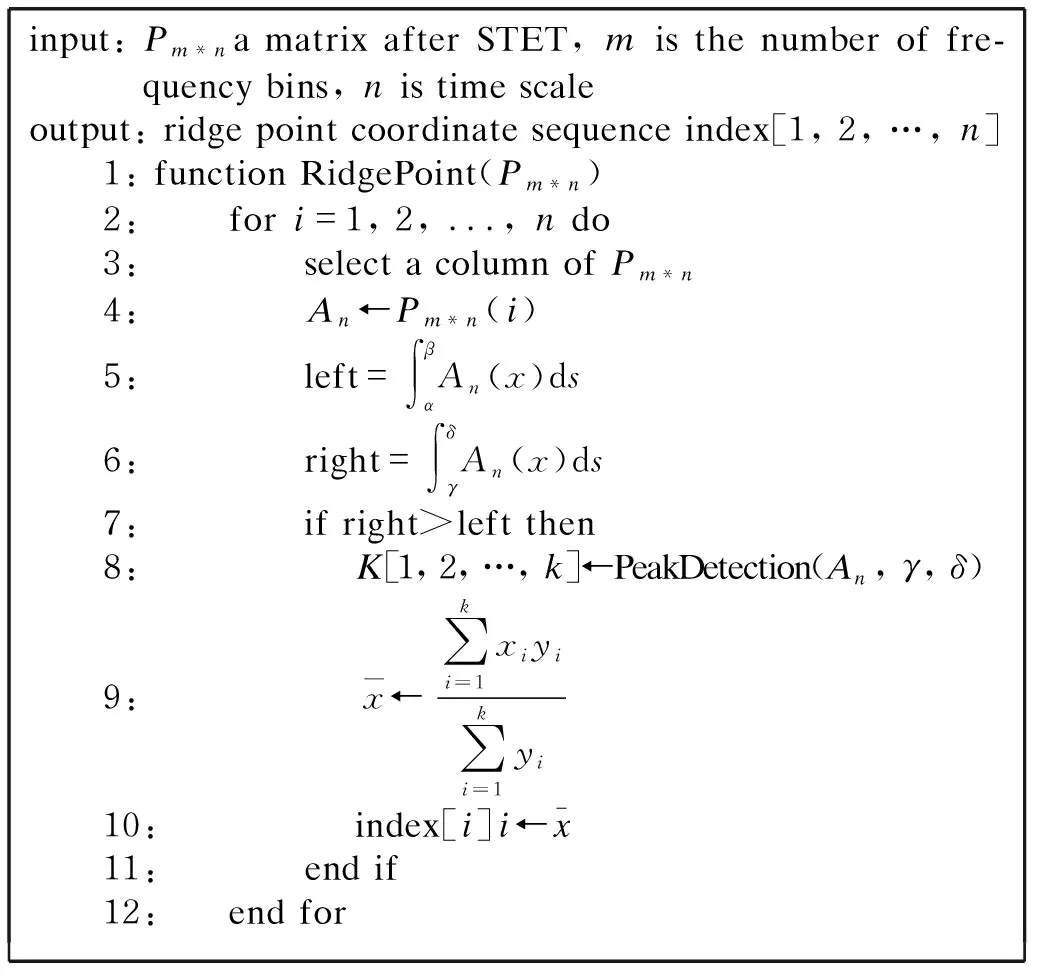
Fig. 5 Algorithm of determining the location of the ridge
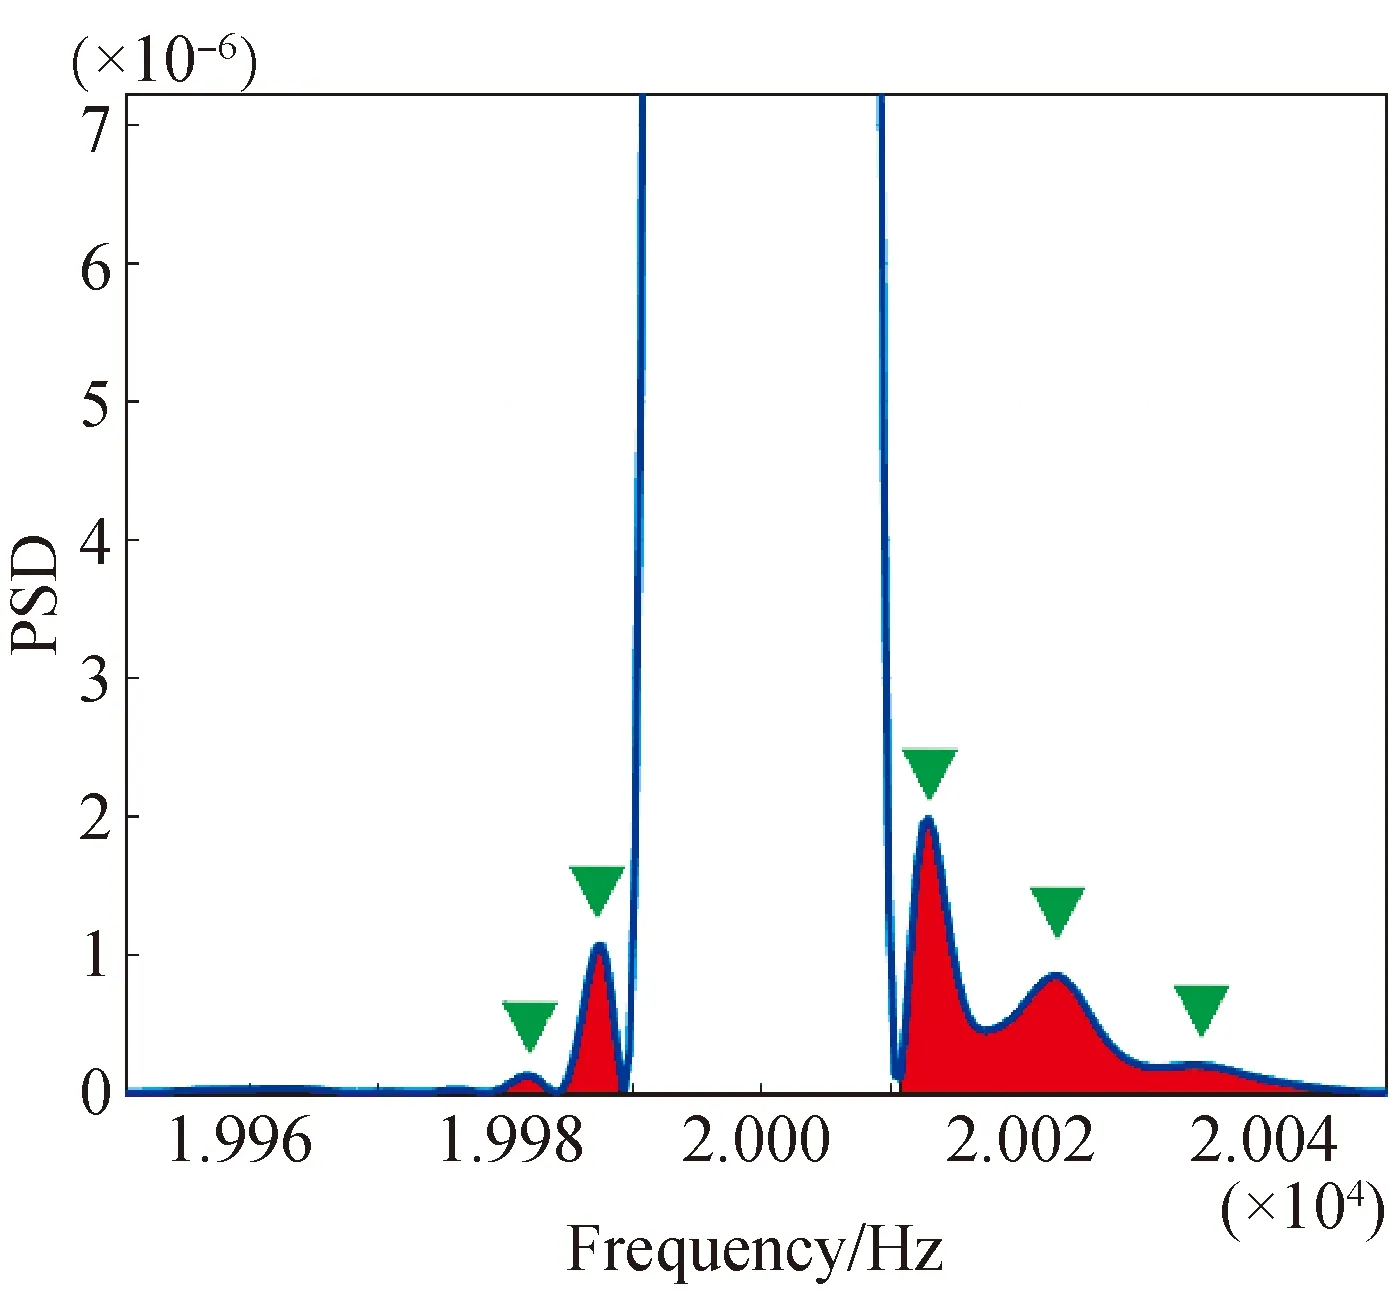
Fig. 6 Example of frequency shift to the right
1.4.2Ridgepointsregrouping
The technology based on ridge extraction is widely used in time-frequency analysis to capture the time dynamic characteristics of non-stationary signals. By detecting the ridges in the time-frequency domain, the IF can be estimated. This method is non-parametric and adaptive. Generally, an effective ridge detection method usually includes multiple signal components for non-stationary signals, however the signals may cross each other, which causes great difficulty in extracting ridges on the time-frequency domain[16]. For the ridges with overlapping parts, we first extract the ridge points on the time-frequency map according to the energy after the STFT and then regroup the ridge points with the variation trend of the ridge points.
The current method cannot solve the problem of extracting the interpolation function of overlapping components in the frequency domain[17]. There are two general reasons: one is that current methods to extract the interpolation function of the point in the frequency domain only depend on the amplitude and absolute frequency value changes, but do not consider the direction of the ridgeline change; the other is that these methods try to extract a smooth ridge curve only by limiting the frequency changes of two consecutive sampling points. This cannot solve the situation of overlapping components of signals because the sampling interval of two adjacent consecutive frequencies is too small. So, the constraint in the interval is weak and belongs to a local constraint.
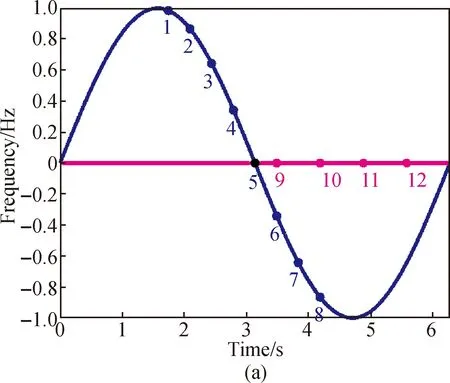
As shown in Fig. 7(a), it simulates the signal characteristics of the time-frequency diagram in this paper. The red line and the blue line are two intersecting signal components, and the first to 12th points represent the obtained discrete ridge points. At point 5, the two signal components cross, and the frequency difference between point 5 and point 6 isΔfm, and the frequency difference between point 5 and point 9 isΔfk. The frequency of a point changes in two directions. From point 1 to point 8, they are the correct IF components. Assuming thatΔfm≈Δfk, from points 9 to 12, they have stronger amplitudes than that from point 6 to point 8. The current method considers points 1 to 5 and points 9 to 12 as the correct IF of signal components. In fact, point 1 to point 5 and point 5 to point 8 are the correct signal components. This shows that in some cases where the components are crossed, this method will cause recognition errors. Therefore, to solve this problem, this paper proposes a solution of the ridge regrouping.
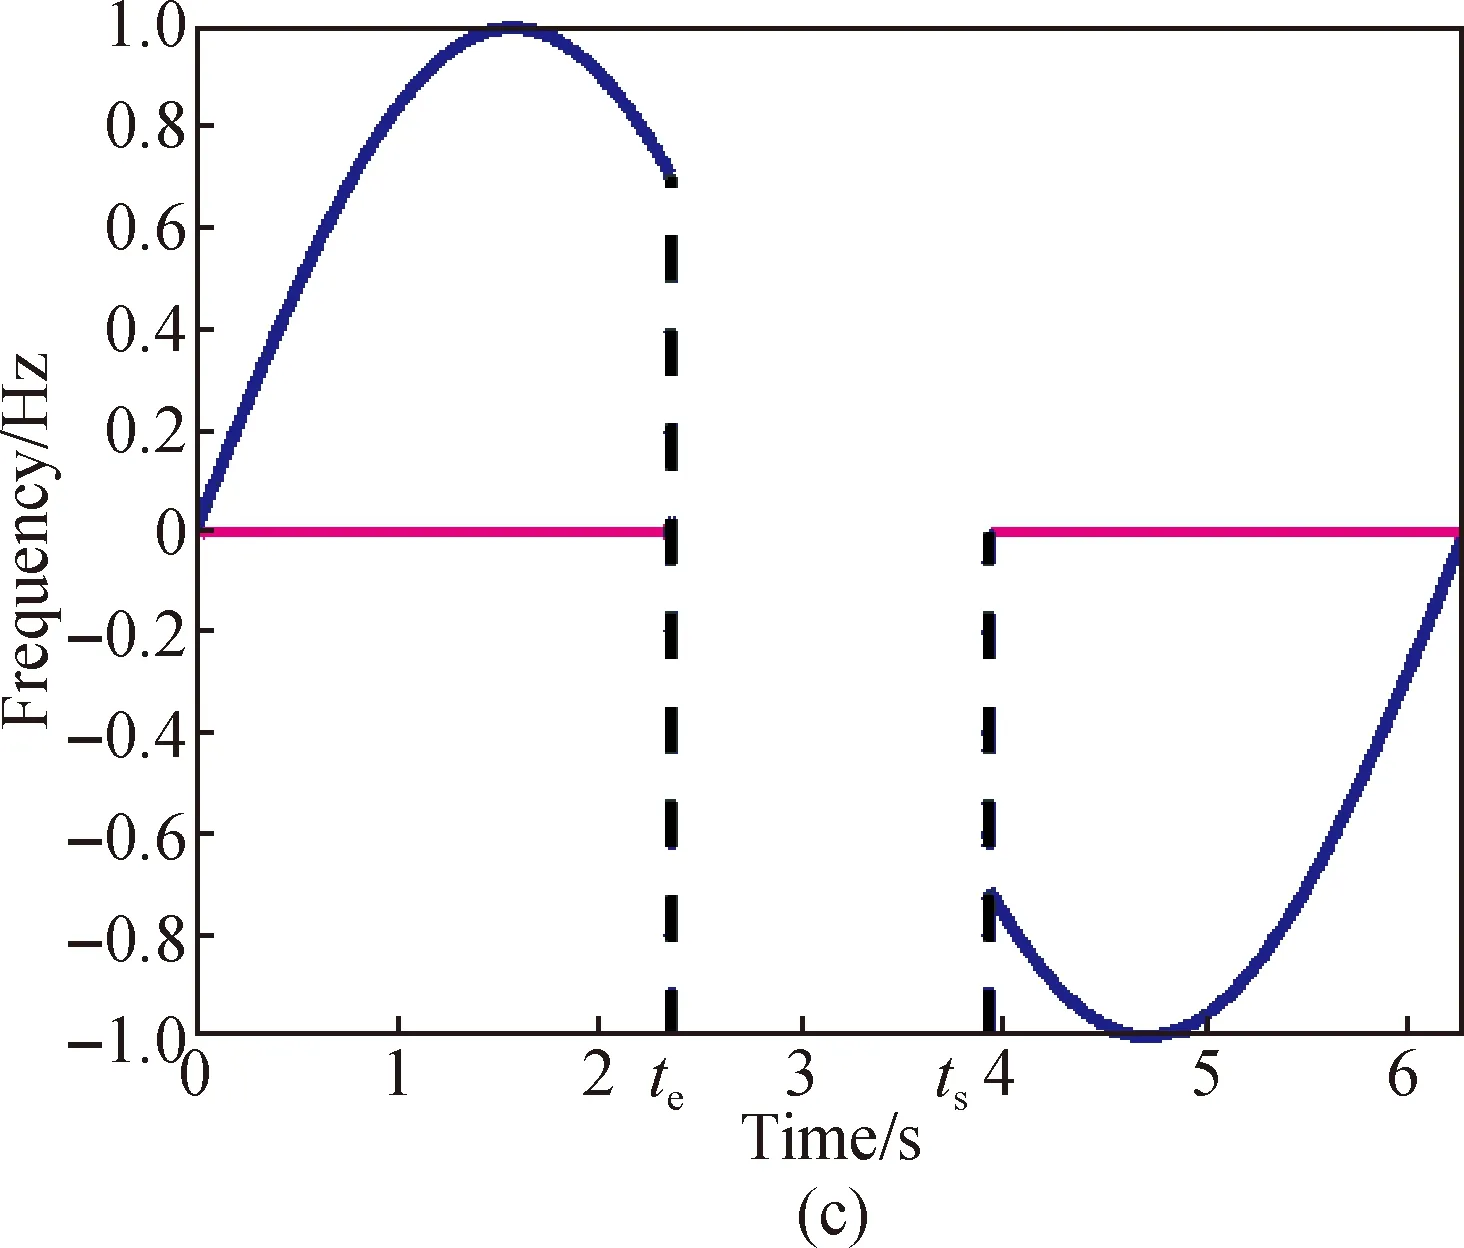
In Fig. 7(b), if the intersection of the ridge is blocked, ignoring the amplitude of the intersection, the direction change of sample points will be considered, and the correct connection of the ridge in the intersection interval will be redefined. The ridgeline is the slope of the frequency component atteandts. The slope can be defined as
Kslp-=[Fk(te)-Fm(te-Δt]/Δt,
(11)
Kslp+=[Fk(ts+Δt)-Fm(ts)]/Δt,
(12)
whereΔtrepresents a short-time increment.Kslp-is the slope of the left ridge andKslp+is the slope of the right ridge.FkandFmare the IF of the two overlapped components. We divide the ridge points with similar slopes into a group, and connect the two ridgelines at the intersection point. The regrouping method does not involve an exhaustive search, so it is computationally efficient. After experiments, the ridge recombination method can also extract better ridges in a noisy environment. Figure 7(d) shows the combination of ridges after regrouping.
2 Experiments
2.1 Implementation
We develop an Android application on the smartphone to send and receive the acoustic signal based on Java. We use Google Nexus 5X as our experimental phone.
We use HY-5B speed regulating oscillator to simulate a vibrating platform[18], as shown in Fig. 8. It is equipped with large-capacity, digital display and stable speed developed for modern biological engineering. The equipment is suitable for liquid, medicine and powder shaking. We place the mobile phone that sends an acoustic signal on the mobile phone holder facing the vibration platform. The adjustable speed of the vibration platform is from 40 r/min to 300 r/min, and the vibration range of the vibration platform in the experiment is 2 cm. The distance between the mobile phone and the vibration platform is 20 cm. The phone speaker will send sound waves with frequencies of 18, 19, and 20 kHz. The sound waves are reflected by the vibrating platform and then transmitted back to the microphone of the phone.
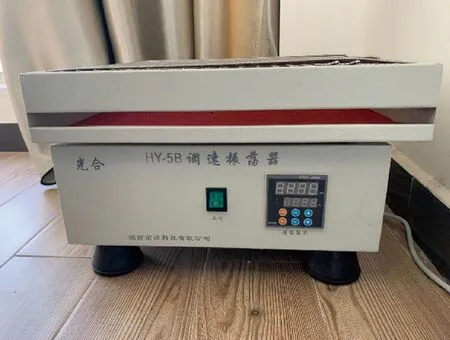
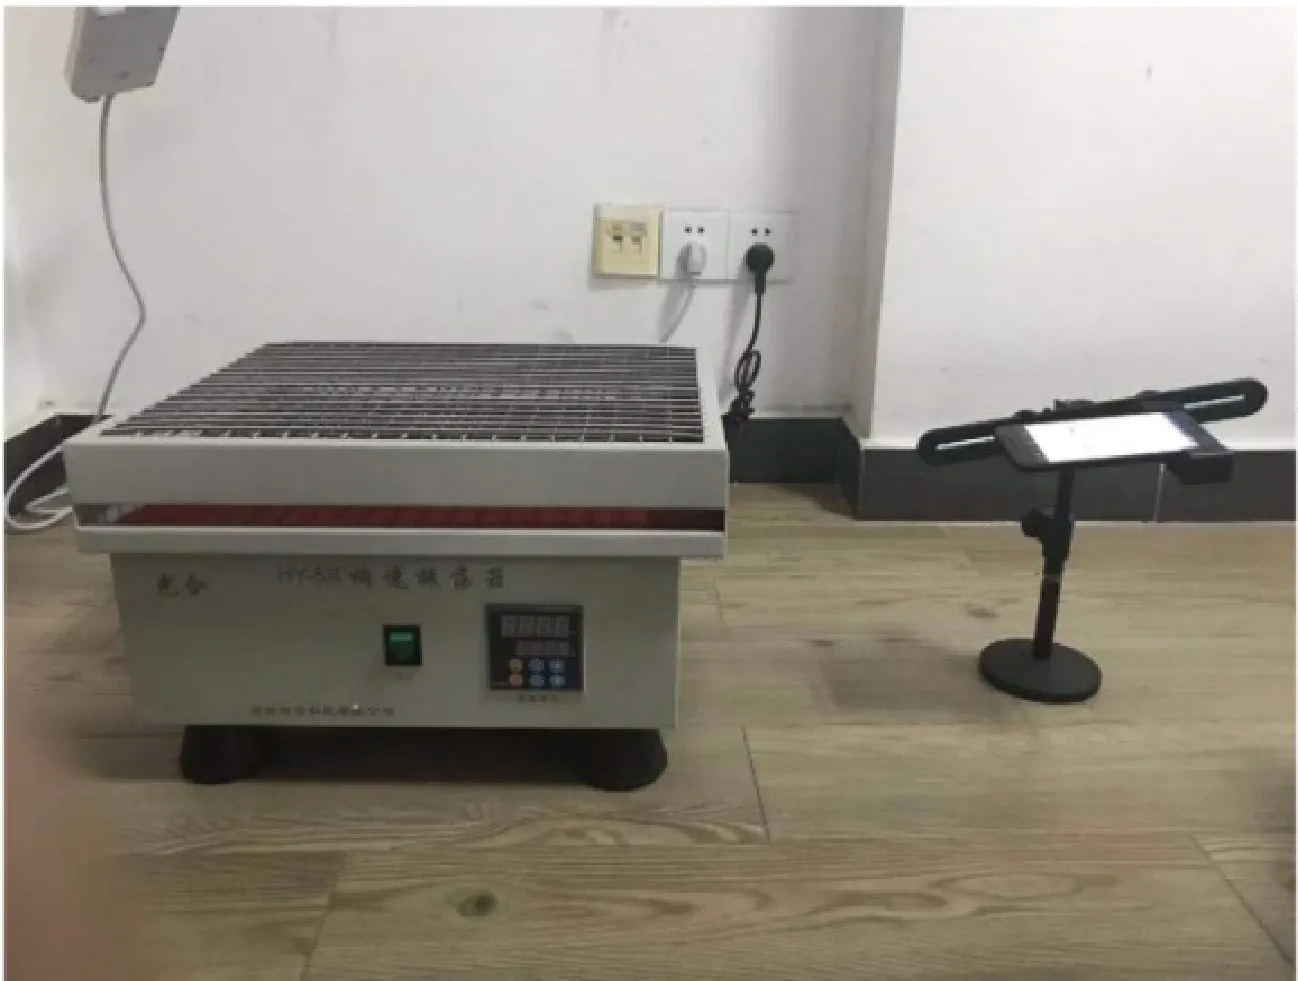
Fig. 8 Configuration of the experimental scene
2.2 Impact of rotate speed
We study the impact of different vibrating frequencies of the vibrating platform. The mobile phone was placed 20 cm away from the vibrating platform, and other environmental factors were kept unchanged. Since the adjustable speed range of the vibrating platform is from 40 r/min to 300 r/min, we set the speed from 40 r/min to 300 r/min with 40 r/min as the interval. We Perform 30 tests for each speed and average the results[19]. The ratio of the period error to the correct error is defined as
whereVeis the estimated vibrating speed andVgis the real vibrating speed.Erepresents the error rate.
We apply the two mentioned methods to estimate the vibration period. As shown in Fig. 9, When the vibrating frequency of the vibrating platform is 40 r/min to 120 r/min, the rotating speed has not yet reached the high speed, and the vibrating platform moves in a stable manner. At this time, the energy of the frequency shift part in the time-frequency image is concentrated. The vibration speed errors of the vibration platform estimated by the DBSCAN algorithm are all less than 0.01(1%), which can provide accurate measurements[20]. When the rotation speed is higher than 240 r/min, the energy dispersion in the time-frequency diagram is not conducive to clustering and ridge extraction. The error rate reaches 0.03(3%). Nevertheless, the error can meet the accuracy requirements of most measurement environments, so it can still provide an accurate period measurement.
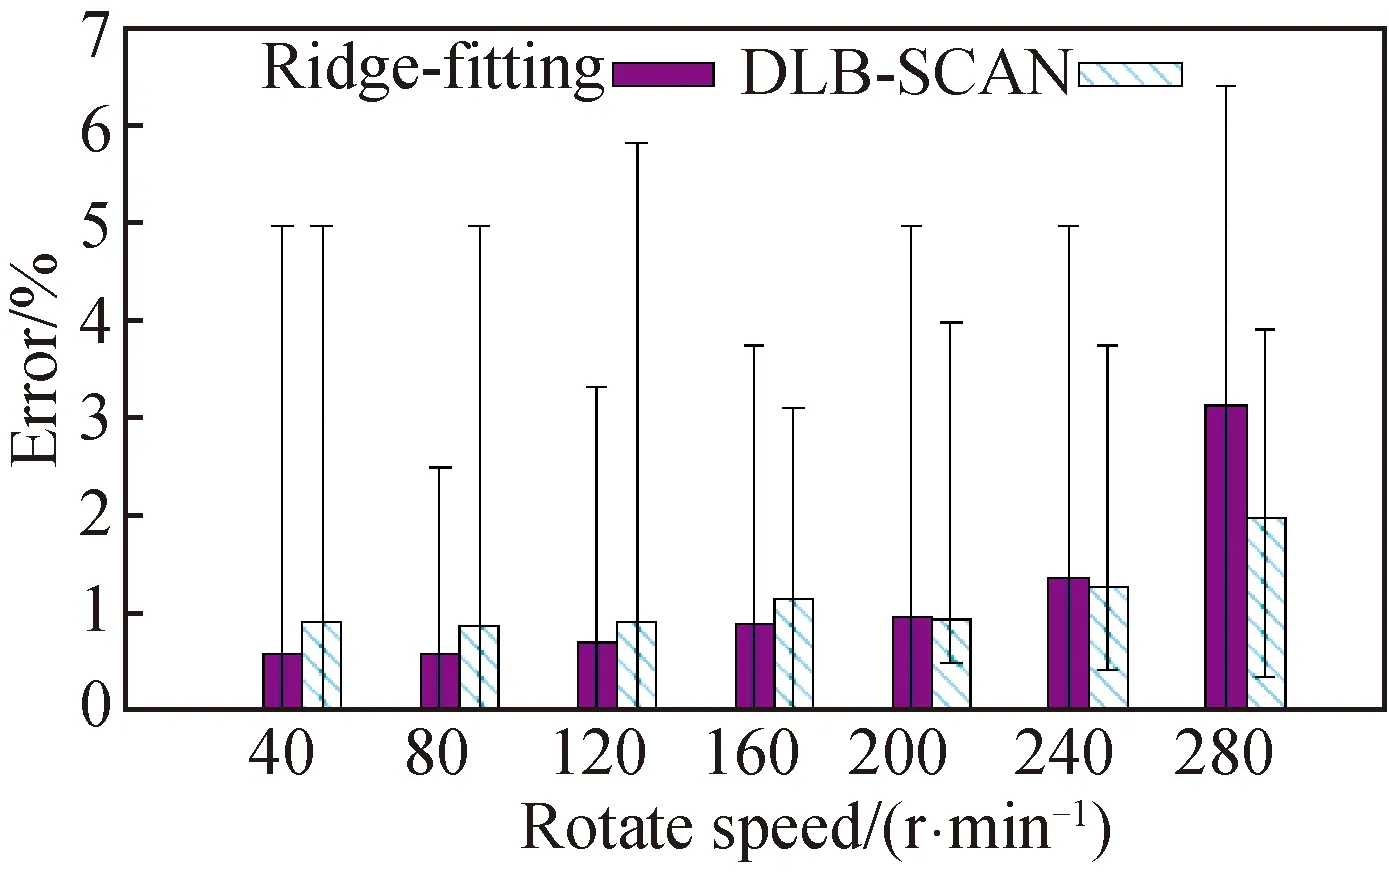
Fig. 9 Impact on the error rate of rotatespeed of the vibration platform
2.3 Impact of distance and angle
To verify the impact of the distance and angle between the mobile phone and the vibration platform, the speed of the adjustable vibration platform was adjusted to 40 r/min, the mobile phone was placed at different distances away from the platform. The distance between the mobile phone holder and the vibration platform was set to 10, 20, 30, 50, 70, 100 and 150 cm. The angle is set to 30°, 45°, 60°, and 90°.
Figure 10 shows the measurement errors of the two period evaluation methods at different distances. When the mobile phone is placed close to the vibration platform (10, 20, 30 cm), the measurement error is less than 0.01 (1%), which can provide accurate vibration period estimation. The error at 150 cm reaches up to 50%, and the mobile phone loses the ability to measure. This is because the echo signal received by the microphone decreases as the distance increases. At the same time, what is reflected in the time-frequency image is only the direct transmission from the speaker to the microphone. The signal reflected by the vibrating platform cannot be reflected in the time-frequency image, which causes difficulties in ridge extraction and clustering. This puts forward requirements for the measurement, and we should keep the distance between the mobile phone and the measured vibrating object less than 30 cm. The experimental results show that 20 cm is the best distance for the mobile phone.
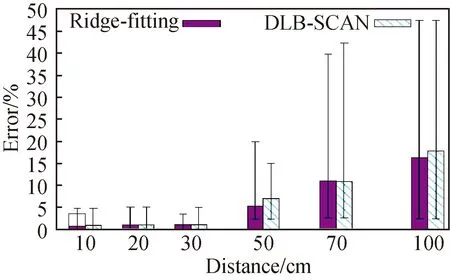
Fig. 10 Impact on the error rate of the distance betweenthe vibration platform and the mobile phone
However, in the real scene, limited by the positional relationship between the mobile phone and the vibration platform, the vibration situation of the mobile phone and the vibration platform under different angles is explored. When the mobile phone and the vibration platform are parallel, the angle is 0°. In the case of 30°, 45°, 60° and 90°, we keep the distance of 20 cm between the mobile phone and the vibration platform, and adjust the speed of the vibraton platform to 40 r/min.
Figure 11 shows the error of the mobile phone and the vibration platform at different angles. Since the sound wave is a spherical wave[21], the propagation direction in air is divergent. The energy of the sound wave will be easy to attenuate under different frequencies and angles[22]. When the angle is 0°, the microphone can receive the echo signal reflected by the vibraton platform from the speaker, but the signal strength is attenuated that causes a large error. The speed error estimated by the DBSCAN algorithm is higher than the ridge extraction.
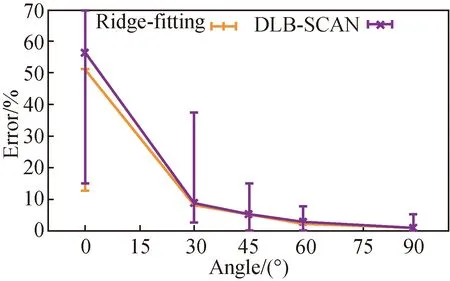
Fig. 11 Impact on the error rate of the angle betweenthe vibration platform and the mobile phone
According to the results, the method based on DBSCAN has a lower error rate than that based on ridges. When the energy points in the time-frequency diagram begin to disperse, the method based on ridges can’t extract the clear ridges. However, the method based on DBSCAN classifies clusters when vibration reflects energy distribution. Therefore, the method based on DBSCAN is more robust than ridges.
For time consumption, the method based on DBSCAN needs to visit all sampling points and iterate energy points to classify clusters. The method based on ridges only computes the maximum energy point of each row in the time-frequency matrix. Therefore, it saves iteration time and computational overhead.
2.4 Case Ⅰ: a ceiling fan
According to the evaluation of various influencing impacts on the vibration platform, this paper studies one real-life example and introduces how to combine the two measurement period methods with specific application scenarios to increase the scalability of this method.
Ceiling fans are very common instruments in life[23-24]. They are usually fixedly installed on the ceiling. The rotation of the blades makes the airflow and generates wind to cool off the heat. The speed of the ceiling fan is controlled by a governor. The blade diameter of a ceiling fan is 1 400 mm, the minimum speed is 70 r/min, and the maximum speed is 300 r/min. However, due to changes in the power supply voltage, the power of the ceiling fan fluctuates in the range of 60 W to 80 W, which causes abnormal rotation speed. This may cause the ceiling fan motor overheated. Due to the long blades of the ceiling fan and the large blade rotation radius, it is difficult to measure the speed of the ceiling fan. In reality, there is often no feasible way to measure the speed of the ceiling fan.
The method of measuring the rotation speed proposed in this paper is a non-contact method, which can measure the rotation speed of the ceiling fan non-invasively. The experimental scene is shown in Fig.12.

Fig. 12 Application of a ceiling fan
To study the feasibility of measuring the rotation speed of the ceiling fan, this paper measures the minimum rotation speed and the maximum rotation speed of the ceiling fan. After the ceiling fan rotates smoothly, we place the mobile phone under the ceiling fan blades. The ceiling fan has three blades. During the process of the ceiling fan rotates one circle, the three blades all pass through the speaker of the mobile phone, which is reflected in the time-frequency diagram as a rotation process with three cycles. Therefore, it is necessary to calculate the speed value divided by 3. The experiment shows that when the adjusting knob is at the highest speed, the measured speed of the ceiling fan is 308 r/min, with an error rate of 2.7%; while the measured speed is 71 r/min with an error rate of 1.4% at the lowest speed. This sample study fully illustrates the feasibility of the method in this paper for measuring the speed of ceiling fans, and provides convenience that other methods can’t match.
2.5 Case Ⅱ: running
Running has become the first choice for more and more people to keep fit. When exercising on a gym treadmill, the running speed is determined by the stride frequency and stride length. The stride frequency refers to the frequency at which the legs switch their support points when running or walking. Stride length refers to the distance of a step between two landings on the same foot when a person is walking or running, calculated as the center of the foot. The stride length of an average adult in long-distance running is about 1 m.
As shown in Fig.13, the treadmill pace is set to 6 km/h. The mobile phone is placed behind the runner to collect data in 30 s. It is measured that the number of swings of the legs is 48 in 30 s. The distance of movement in 30 s is 48 m, which is 5 760 m/h after conversion. The error rate is 4%. Therefore, the pace of the runners can be tracked according to the method in this paper.
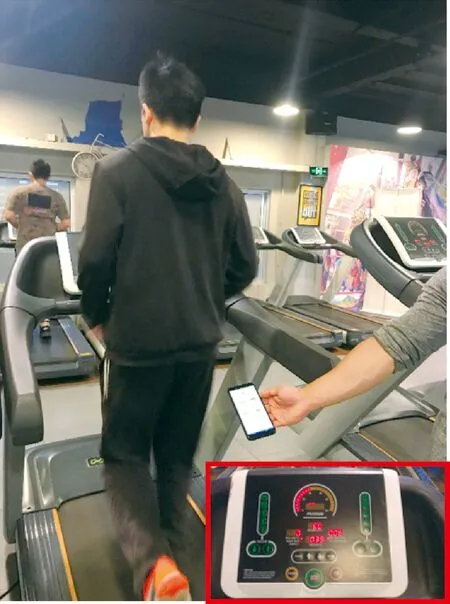
Fig. 13 Application of running
3 Conclusions
In this paper, we present a novel method to measure the vibration period using mobile phones. We analyze the echo signal hitting from vibrating objects in the time and frequency domain to strengthen its representation by the reassignment method. Two methods for discovering the vibration period are proposed. One is to use density-based clustering. The number of clusters can be obtained through cluster the energy points in a time-frequency image. The second is to use the energy ridge fitting method to extract the frequency offset energy ridge, and fits the ridge by the Fourier series to obtain the angular frequency ω of the vibration signal.
We use Android mobile phones to implement a system prototype, and conduct experiments and evaluations on the adjustable vibration platform. We consider the influence of various impacts including the speed of the vibration platform, the distance and angle between the mobile phone and the vibrating platform. We conduct several experiments and verify the entire system comprehensively. The system not only has been tested and used in practical applications, but also will open up a wide range of exciting opportunities.
 Journal of Donghua University(English Edition)2021年4期
- Journal of Donghua University(English Edition)的其它文章
- Influence Mechanism of Clothing Anchor Features on Consumers’ Purchase Intention
- Performance Evaluation of a Molten Carbonate Fuel Cell-Graphene Thermionic Converter-Thermally Regenerative Electrochemical Cycles Hybrid System
- Long Text Classification Algorithm Using a Hybrid Model of Bidirectional Encoder Representation from Transformers-Hierarchical Attention Networks-Dilated Convolutions Network
- Meta-Path-Based Deep Representation Learning for Personalized Point of Interest Recommendation
- Design and Characterization of Electrical Connections for Conductive Yarns
- Influence of Fe2O3 on Release Mechanism of NH3 and Other Nitrogen-Containing Compounds from Pyrolysis of Three Typical Amino Acids in Urban Sludge