
A modified soil water content measurement technique using actively heated fiber optic sensor
2020-07-12 12:36:24MengWngXuLiLihongChenSenqunHouGuiynWuZhilinDeng
Meng Wng, Xu Li,b, Lihong Chen,*, Senqun Hou, Guiyn Wu, Zhilin Deng
a Key Laboratory of Urban Underground Engineering of Ministry of Education, Beijing Jiaotong University, Beijing, China
b Qinghai Research and Observation Base, Key Laboratory of Highway Construction & Maintenance Technology in Permafrost Regions, Ministry of Transport,Xining, Qinghai, China
Abstract Soil water content measurement is critical in practical engineering. The actively heated fiber Bragg grating optic sensor (FBGS) has great potential of multi-point measurement for soil water content measurement in field.In this study,the effect of heating time on the measurement accuracy is discussed,and modifications are made for actively heated fiber optic(AHFO) sensors.The results demonstrate that if an integration data analysis method is used, the accuracy and reliability of soil water content measurement with AHFO sensors will be improved. Both a short fiber length and a short-term heating pattern are effective and can help to reduce soil disturbance. With the proposed integration method, a short heating time is guaranteed for measuring the soil water content. Such improvements will reduce the thermal disturbance to soil sample and improve the reliability of measurement.
2020 Institute of Rock and Soil Mechanics, Chinese Academy of Sciences. Production and hosting by Elsevier B.V. This is an open access article under the CC BY-NC-ND license (http://creativecommons.org/licenses/by-nc-nd/4.0/).
Keywords:Fiber bragg grating Carbon fiber heated sensor Unsaturated soil Field monitoring Soil water content measurement
1. Introduction
In recent years, fiber optic sensing technology has been developed rapidly and has achieved great success in both field monitoring system and laboratory model test. Compared to other sensing technologies, the advantages of fiber optic technology are obvious, e.g. it is capable of both distributed long-distance measurements and indoor tests,with anti-corrosion and anti-jamming characteristics (Freifeld et al., 2008; Selker et al., 2006; Westhoff et al., 2007;Tyler et al., 2008, 2009; Kim et al., 2010). Grattan and Sun, (2000) reviewed the types of fiber optic sensors and the scope of application of various types in 1960e2000. In a wide variety of fiber optic sensors,Bragg gratings have some advantages in the measurement of strain and temperature due to its ease for use.For indoor tests, Lee et al. (2010) had assembled the fiber optic testing system into the triaxial testing equipment and successfully measured the pressure/force and linear displacement.In such tests,conventional displacement sensors are easily short-circuited when immersed underwater or subjected to electromagnetic interference, but fiber optic sensors will not hold.
It is accepted that the specific heat capacity and thermal conductivity of soil are significantly affected by soil water content(e.g.Mitchell and Soga, 2005; Lu et al., 2007). On one hand, thermal properties are essential in the thermal related problem of soils,e.g.frost deformation (Liu et al., 2019), expansion of saline soil (Fang et al., 2018), and thermal consolidation (Bai, 2006). On the other hand,the thermal properties of unsaturated soils can be measured and further used to infer soil water content.Many efforts have been made to estimate the water content by measuring the thermal property values of the soil(Kersten,1949;Johansen,1977;Brandon and Mitchell,1989;Ochsner et al.,2001;Abu-Hamdeh,2003;C?té and Konrad, 2005; Lu et al., 2007; Usowicz et al., 2017; Oyeyemi et al., 2018). Halloran et al. (2016) also reviewed the thermal methods in unsaturated soils. In addition, the thermal methods applicable in unsaturated soils were reviewed by Halloran et al.(2016) and the methods can be divided into two categories: the passive heat monitoring methods and the active heat tracing methods(including heating).
Fiber Bragg grating optic sensor (FBGS) is a fast developing method for temperature and moisture measurement, from simply monitoring the temperature(passive)to involving a heater(active).Recently, the actively heated fiber optic (AHFO) and the passive fiber optic (PFO) sensors have been used to measure soil water content based on thermal effect. Steele et al. (2010) used PFO sensors to measure soil temperature changes caused by diurnal temperature cycle difference,in order to estimate water content in the soil, which could be exactly the passive heat tracing methods.However,this method could obtain good measurement results only when the temperature difference in the diurnal cycle is large.
Many researchers have designed AHFO sensors with different structures and verified their suitability. Sayde et al. (2010)improved Steele et al. (2010)’s method by replacing the original fiber with a kind of AHFO sensor. Moreover, they proposed an empirical relation between the temperature variation characteristic values and soil water content. A large number of embedded AHFO sensors were used to predict the occurrence of seepage by monitoring the temperature change of the dam (C?té et al., 2007; Xiao and Huang, 2013). Later, Cao et al. (2015, 2018) developed an AHFO sensor to detect the volumetric water content,which shows much higher accuracy compared to that used by Sayde et al.(2010).Because of their efforts,measurement of soil water content by fiber sensors has become practical both in laboratory and field. This technique will be a good alternative to the conventional measurement methods such as time domain reflectometer (TDR) method(Dalton et al.,1984;Malicki et al.,1992,1996;Roth et al.,1992;Chen et al., 2007, 2009, 2013) or frequency domain reflectometry (FDR)method(Heimovaara et al.,1996;Veldkamp and O’Brien,2000;Lin,2003; Jones and Or, 2004; Tsheko and Savage, 2005), which has been stocked for many years and cannot overcome the difficulties of measurement accuracy and sensitivity to the contact condition between sensor and soil matrix.
As a young technique with great economic advantage for multipoint measurement, AHFO sensor has a great potential for soil water content measurement and is continuously improved. However, it still has some limitations, for example:
(1) The previous researches mainly focused on measuring the thermal conductivity () to calculate the water content.However, it is a rather complicated process (Kersten,1949;Johansen, 1977; Sepaskhah and Boersma, 1979; Lu et al.,2007; Ciocca et al., 2012; Striegl and Loheide, 2012). Sayde et al. (2010) proposed a simple response variable (Tcum),which monotonically varies with soil water content, to calibrate the moisture content, but they did not propose a specific calibration equation forTcumand water content. Later,Cao et al. (2015, 2018) proposed a modified method for sensors.However,the size of the sample used to calibrate the sensor is too large, making it difficult to control the dry density (400 mm in diameter and 460 mm in height (Cao et al., 2015); 1 m in height and 0.15 m in diameter (Cao et al., 2018)).
(2) Soil disturbance may be still high due to the long-term heating.If the heating process is conducted with a high-power and long time, migration of water content in the soil sample will definitely occur(heating time and power are 120 s and 20 W/m, respectively (Sayde et al., 2010); and 300 s and 36 W/m,respectively (Ciocca et al., 2012)). Attempts to reduce soil disturbance need to be studied,such as lowering the heating power or reducing the heating time. It is a balance between remarkable signals and limiting soil disturbance.
(3) The data interpretation technique should be further improved.In soil water content measurement, a well-accepted form for characterizing the relation between electric constant and soil water content has been established. However, the relations between temperature parameters and soil water content in Sayde et al. (2010) and Cao et al. (2018) cannot satisfy the users’ need. For example, Cao et al. (2015, 2018)’s relation depended on human judgment of a rising stage and a stable stage and has a complex expression. Sayde et al. (2010)’s relation was lack of data verification.
In other words, the measurement accuracy, data analysis method, sensor design and heating pattern can be further improved.In this study,some improvements on the AHFO sensors are discussed.To achieve this,a series of laboratory tests is carried out, and four modifications are examined, including data analysis method, heating pattern, calibration method, and sensor length.
2. Soil water content measurement by AHFO sensors
Change in water content will lead to variations in the specific heat capacity and thermal conductivity of the soil, which is the basis for measuring the water content by the AHFO sensors(Mitchell and Soga, 2005; Cao et al., 2015, 2018). Thus, the AHFO sensors are essentially the combination of optical fiber temperature measurement technology and small heaters.
2.1. Temperature measurement by FBGS
Hartog (1983) firstly proposed the distributed temperature sensing (DTS) technology based on Raman optical time-domain reflectometry. Spontaneous Raman scattering yields by a collision occurring between fiber molecules and photons after a pumped laser pulse when a certain amount of energy is launched into a sensing optical fiber. As a result, two light photons with different wavelengths are generated, i.e. Stokes light and anti-Stokes light(Grattan and Sun,2000).According to the relationship between the anti-Stokes and Stokes intensity ratio, the temperature measurement of the optical fiber can be realized (Tyler et al., 2009).
The FBGSs used by Hartog(1983)and C?té et al.(2007)have an accuracy of only 1C. However, with the innovation of the interrogator, the measurement accuracy of the FBGSs can reach 0.1C(Cao et al.,2018),and higher accuracy of temperature measurement will reduce the heating energy required for recording valuable data during water content measurement.
2.2. Temperature duration curve during active heating process
The unsaturated soil at room temperature is generally composed of the solid phase, liquid phase, and gas phase.Furthermore,the thermal conductivity and specific heat capacity of each component are different. When soil is heated by a constant linear heat source in a semi-infinite space,the temperature change curve of the soil is shown in Fig.1 (Campbell,1985; Shiozawa and Campbell, 1990). There are obvious segmented characteristics of the heating and cooling curves, thus it is necessary to explore the data of different segments separately.
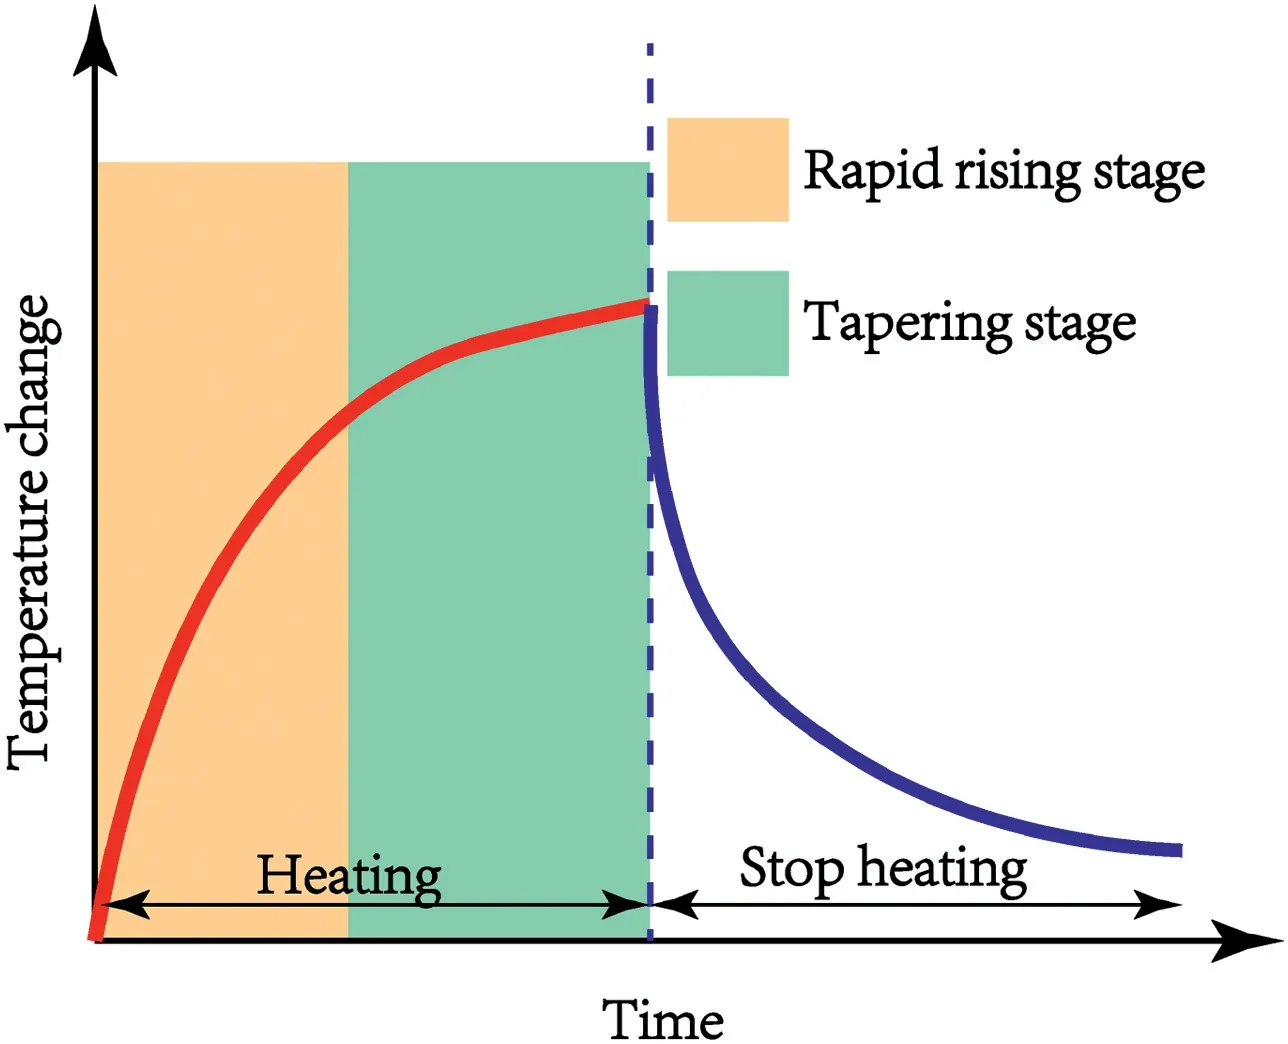
Fig.1. Temperature change curve of the soil heated by a constant linear heat source.The expression of the rapid rising stage and tapering stage comes from Cao et al.(2015,2018).
2.3. Calibrated relation between soil water content and temperature characteristic value
The typical relationship between thermal conductivity and water content for unsaturated soil undergoing drying process is shown in Fig.2.If the water content falls below a certain value(or a certain range),the soil thermal conductivity decreases significantly(Johansen, 1977; C?té and Konrad, 2005; Lu et al., 2007). In the authors’opinion,the critical water content in some models is close to the residual one of soil. As soil water content goes below the residual water content, water phase changes from a continuous distribution to a discontinuous distribution, subsequently the conductivity decreases significantly.
The factors affecting soil thermal conductivity mainly include volumetric water content, soil density, and grain size distribution.Among them, the volumetric water content is the most important(Kersten,1949; Sepaskhah and Boersma,1979). Some empirical or theoretical relations have been proposed. For example, Kersten(1949) proposed the following empirical equation to calculate the thermal conductivity using soil water content for an unsaturated soil:

Johansen (1977) proposed a predictive model for estimation of soil thermal conductivity () based on the degree of saturation,porosity,and bulk density of the soil.Later,C?té and Konrad(2005)simplified Johansen (1977)’s model by introducing a soil texture parameter that depends on soil type and a concise equation for estimating the thermal conductivity of dry soil. Lu et al. (2007)expanded C?té and Konrad (2005)’s work and accomplished the model in the entire range of soil water content.
The original equations proposed by Johansen (1977)were
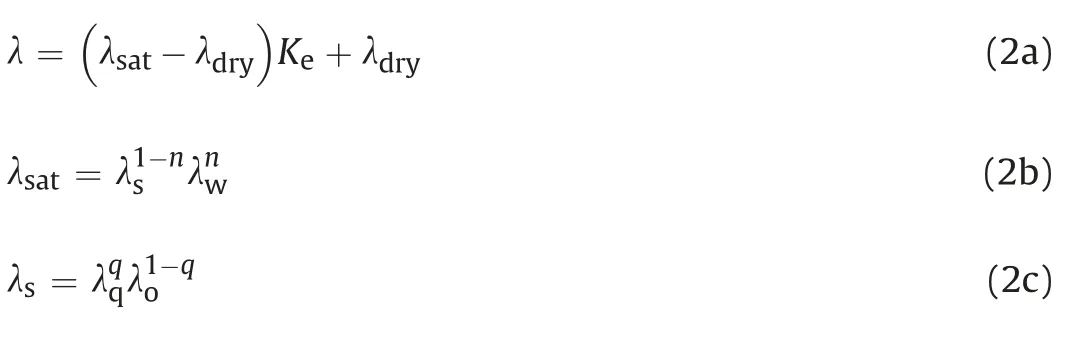
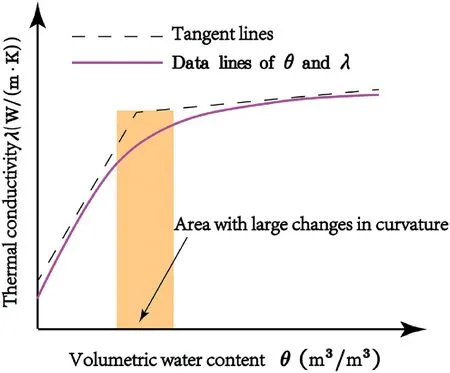
Fig. 2. Typical relationship between thermal conductivity and water content for an unsaturated soil.
The modified equations for calculatingKeanddryproposed by Lu et al. (2007)were
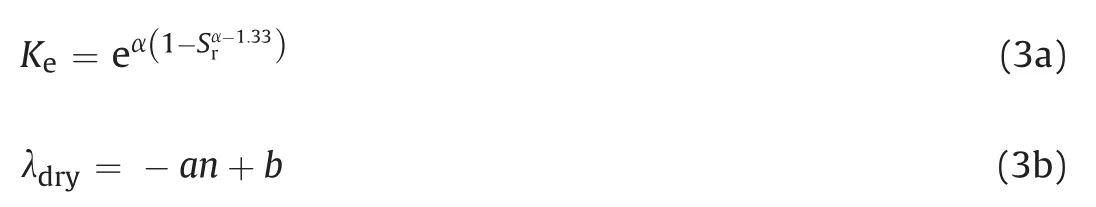
whereKeis the normalized thermal conductivity proposed by Johansen (1977);satanddryare the thermal conductivities of saturated and dry soils(W m1K1),respectively;sis a parameter determined by the quartz content (q);qis the thermal conductivity of quartz, andq7.7 W m1K1;ois the thermal conductivity of other minerals, which is taken as 2 W m1K1whenq> 0.2, and 3 W m1K1whenq0.2;wis the conductivity of water, andw0:594 W m1K1at 20C;Sris the degree of saturation;eis the base of natural logarithm; a is a soil texture dependent parameter;1.33 is a shape parameter value;nis the soil porosity;andaandbare the empirical parameters.
Definitely, the thermal conductivity highly depends on soil water content. However, it is difficult to accurately measure thermal conductivity and use it to infer soil water content. Hence, a substituting strategy is used to infer soil water content from soil thermal phenomena, e.g. the heating or decaying process of soil.Sayde et al.(2010)tried to infer soil water content from a response variable (Tcum) that monotonically varies with soil water content and can be measured by the DTS measurement method:
whereTcumis the cumulative temperature increase(C s);t0is the total time of integration; andTis the DTS reported temperature change from the prepulse temperature (C). This is the first time that the water content is calibrated by using a variable that does not contain thermal conductivity ().
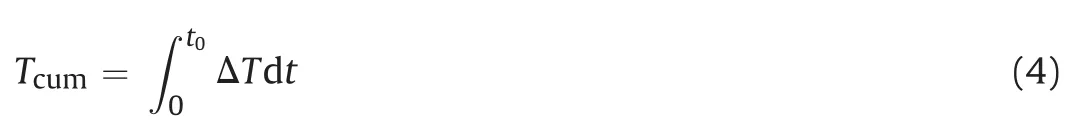
Later, based on the test data of the tapering stage (Fig. 1), a temperature characteristic valueTtis proposed by Cao et al.(2015,2018) as
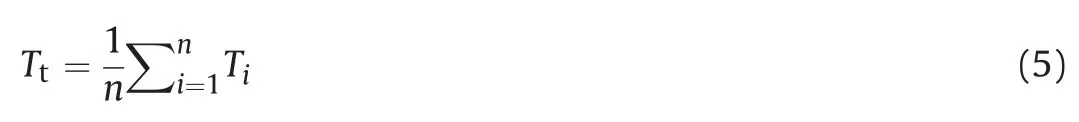
wherenis the total record number of the tapering stage;iis the record number; andTiis theith record of temperature. The soil water content is linked toTtby a piece-wise function (Cao et al.,2018) as
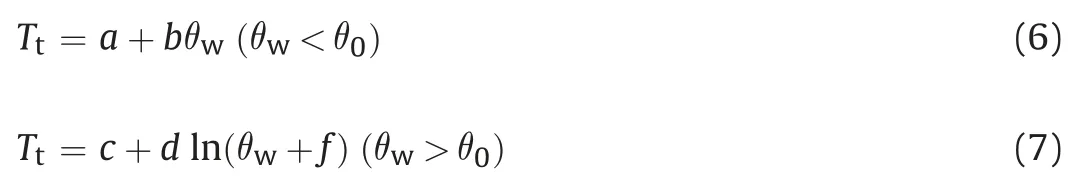
In fact,a linear relation was used in Cao et al.(2015)and it had a lower accuracy compared to the piece-wise function expressed by Eqs.(6)and(7).However,the drawbacks of this calibration method are also obvious:
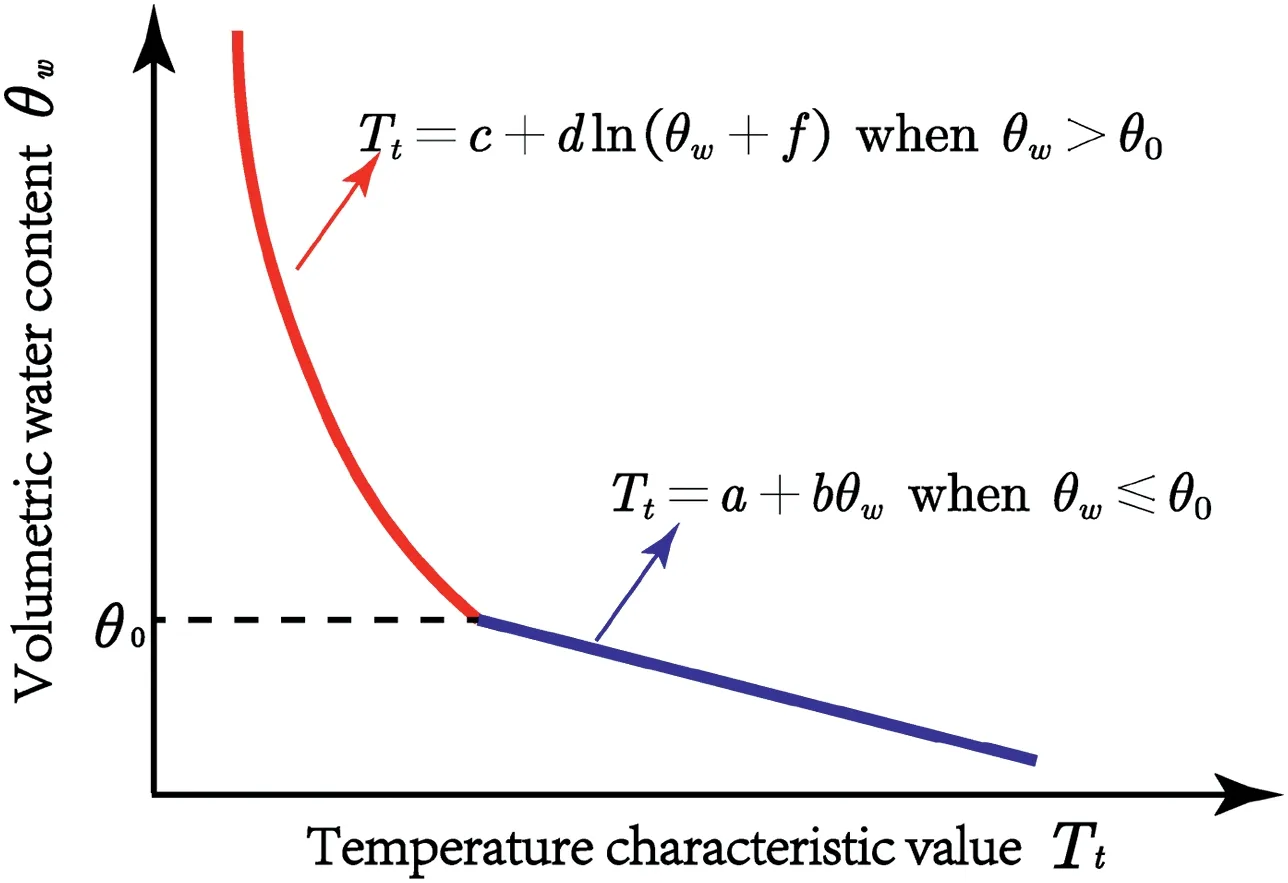
Fig. 3. Relation between soil water content and temperature characteristic value.
(1) It is hard to accurately identify the two stages shown in Fig.1,that is to say, the calculation ofTtmay depend on human judgments and have some errors.
(2) Only the data at the tapering stage are used.
(3) In Eq.(7),Ttis expressed as a function ofw.In the application of this technique,wshould be inferred fromTt. An inverse function of Eq.(7)is to be solved and some other errors may be induced.
3. Soil water content measurement technique modifications by AHFO sensors
3.1. An integration data analysis method
The integration data analysis method was first proposed by Sayde et al. (2010); however, due to the limited resolution and precision of the fiber interrogation, this method can only qualitatively measure the water content. The integration data analysis method used by the authors can be described as
whereFtis an integrated temperature characteristic value,tis the total heating time, andfis a function to be determined.
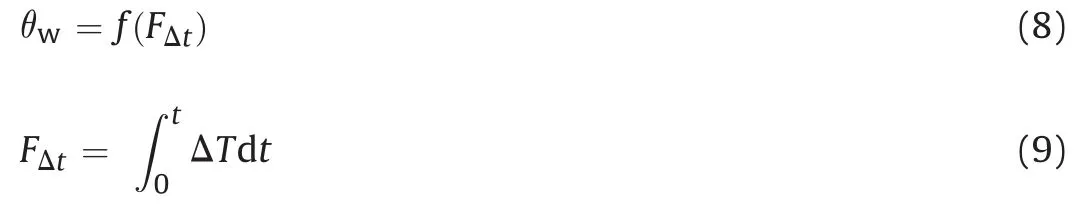
AfterFtis obtained, the temperature characteristic valueFtandwhave the following relations (Fig. 4):
wherea,b,k,andcare the fitting parameters,and these parameters could be determined by indoor calibration test.Similar to0in Cao et al. (2018),tis a turning point onFt-wcurve. The test results demonstrate that above and belowt,w-Ftcurve shows quite different trend.tcan be determined by curve fitting method,such as the least square error method.Interestingly,tseems to be close to the water content at the air entry value on soil water characteristic curve (SWCC) (Fig. 4b) and corresponds to the degree of saturation for the soil around 0.8e0.9. Hence, if a small water content interval is used when the degree of saturation for the soil ranges between 0.8 and 0.95, a more accuratetcan be obtained.
Fig.4. Comparison of w-Ft curve and SWCC:(a)Relation between soil water content and integrated temperature characteristic value; and (b) Typical curve of volumetric water content versus matric suction.
Ciocca et al. (2012) calibrated the volumetric water content using the temperature data from the cooling process in Fig.1, and proved that the data from the cooling part could be used to calibrate the soil water content. In this paper, an integration data analysis method was used to analyze the data of the heating and cooling processes, and its effectiveness was compared.
3.2. Modification of AHFO sensor
The size of the sensor directly determines its application scope.Literature review indicated that the existing AHFO sensors were too bulky and long (Sayde et al., 2010; Cao et al., 2015, 2018), which caused great inconvenience to the calibration and use of the sensor.Hence, there is an urgent need for a kind of AHFO sensor which is suitable for both in situ and indoor calibrations.
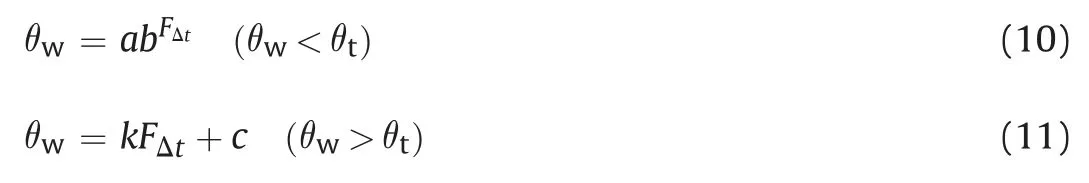
The length and diameter of the AHFO sensors modified by the authors are 40 mm and 4 mm,respectively,as shown in Fig.5a and b.Furthermore,the shell of the sensor is made of corundum,which is well-conductive and corrosion-resistant. Meanwhile, the ordinary heating wire (made by resistance heater) is replaced by a carbon fiber rod because of its marked thermal stability, i.e. its resistance value will not change much with rising temperature.
3.3. Sensitive study of heating time
Fig.5. Experimental equipment:(a)FBGS and soil sample;and(b)Cross-section of the FBGS (not to scale) and fiber interrogation.
In the study of Sayde et al.(2010),it is necessary to heat the soil for 120 s with 20 W/m power to achieve an appropriate temperature rise for water content measurement.The heating time for the test conducted by Cao et al. (2015) even reached 30 min. Such a long heating time is likely to cause a considerable disturbance to water distribution in the soil sample(Sayde et al.,2010).Then,Cao et al. (2018) shortened the heating time to 300 s, but the effect of heating time on the test results was not discussed in their study.
It will be much more helpful for application of AHFO sensors in practical engineering if the heating time could be shortened without reducing accuracy.Therefore,the influence of heating time on the accuracy of water content measurement will be discussed.
4. Test technique and plan
4.1. Soil samples and test equipment
In this study,some laboratory tests were carried out to check the performance of AHFO sensors during soil water content measurement.The structure of sensors used in this study was similar to that in Cao et al. (2018) but with a shorter length. The cross-section of the sensor is shown in Fig.5b,and the sensor itself has a length of 40 mm and a diameter of 4 mm. The complete measurement system consists of: (1) a rheostat; (2) 12 V DC power supply; (3) an ammeter;(4)automatic clock switch;and(5)a fiber interrogation,type NZS-FBG-A01.
The soil used has a plastic limit and a liquid limit of 15.2% and 30.7%, respectively. It can be classified as silty clay. The basic properties of soil samples are listed in Table 1.
4.2. Test plan for laboratory calibration
The soil samples used in this study were prepared with the following procedure:
(1) First, soil samples with various water contents were prepared by a statistic compaction method. Each sample had a diameter of 10 cm and a height of 10 cm.
(2) Then, soil samples were put into a thermostat where the environmental temperature was maintained at 25C to reduce the influence of heat convection on soil water content measurement.
(3) Third, a short-term heating action was implemented by a short carbon fiber rod,which was around 4 cm in length and coated with a corundum shell. At the same time, the temperature increasing process of surrounding soil was monitored by the core of FBGS (Fig. 5). In this study, the heating power was maintained at 2.7 W/m and the total heating duration was 10e450 s.
The influence range of AHFO sensors depends on the heating time, power, and soil thermal conductivity (Johansen,1977; Abu-Hamdeh, 2003; Mitchell and Soga, 2005). For a given condition,the influence range is supposed to only depend on the heating time(C?té and Konrad, 2005; Sayde et al.,2010). According to Fourier’s law, for a transient conduction phenomenon, the influence range should be linear to the root of time or the logarithm of time.
The heating process of AHFO sensors in a large sample was monitored to check the influence range. As the soil thermal conductivity increased with decrease of water content, a soil sample with 10 cm in both diameter and height, and 3.4% of volumetric water content was used to explore the maximum influence range of the AHFO sensors.AHFO sensors were inserted into the sample,as shown in Fig. 6a, one in the center and the others in the radial direction with an interval of 1 cm. After 20 min of heating with a power of 2.7 W/m, only inner 4 sensors (within 4.5 cm) demonstrated some increment of temperature, as shown in Fig. 6bed.Referring to Fig.6e,if the heating time is within 30 s,the influence range of AHFO sensors should be within 1 cm. In this study, the heating time was shorter than 20 min, and the diameter of the sample used was 10 cm, thus the influence of the outer boundary could be ignored.
5. Results
Eleven samples with different water contents were tested. The recorded temperature duration curves are illustrated in Fig. 7. As shown in Fig.7,the temperature duration curve recorded by AHFO sensors during the heating process can be divided into two stages:rapid rising stage and tapering stage.This trend is consistent with the report in Figs. 4 and 9 in Cao et al. (2015).

Table 1Physical properties of the tested silty clay.
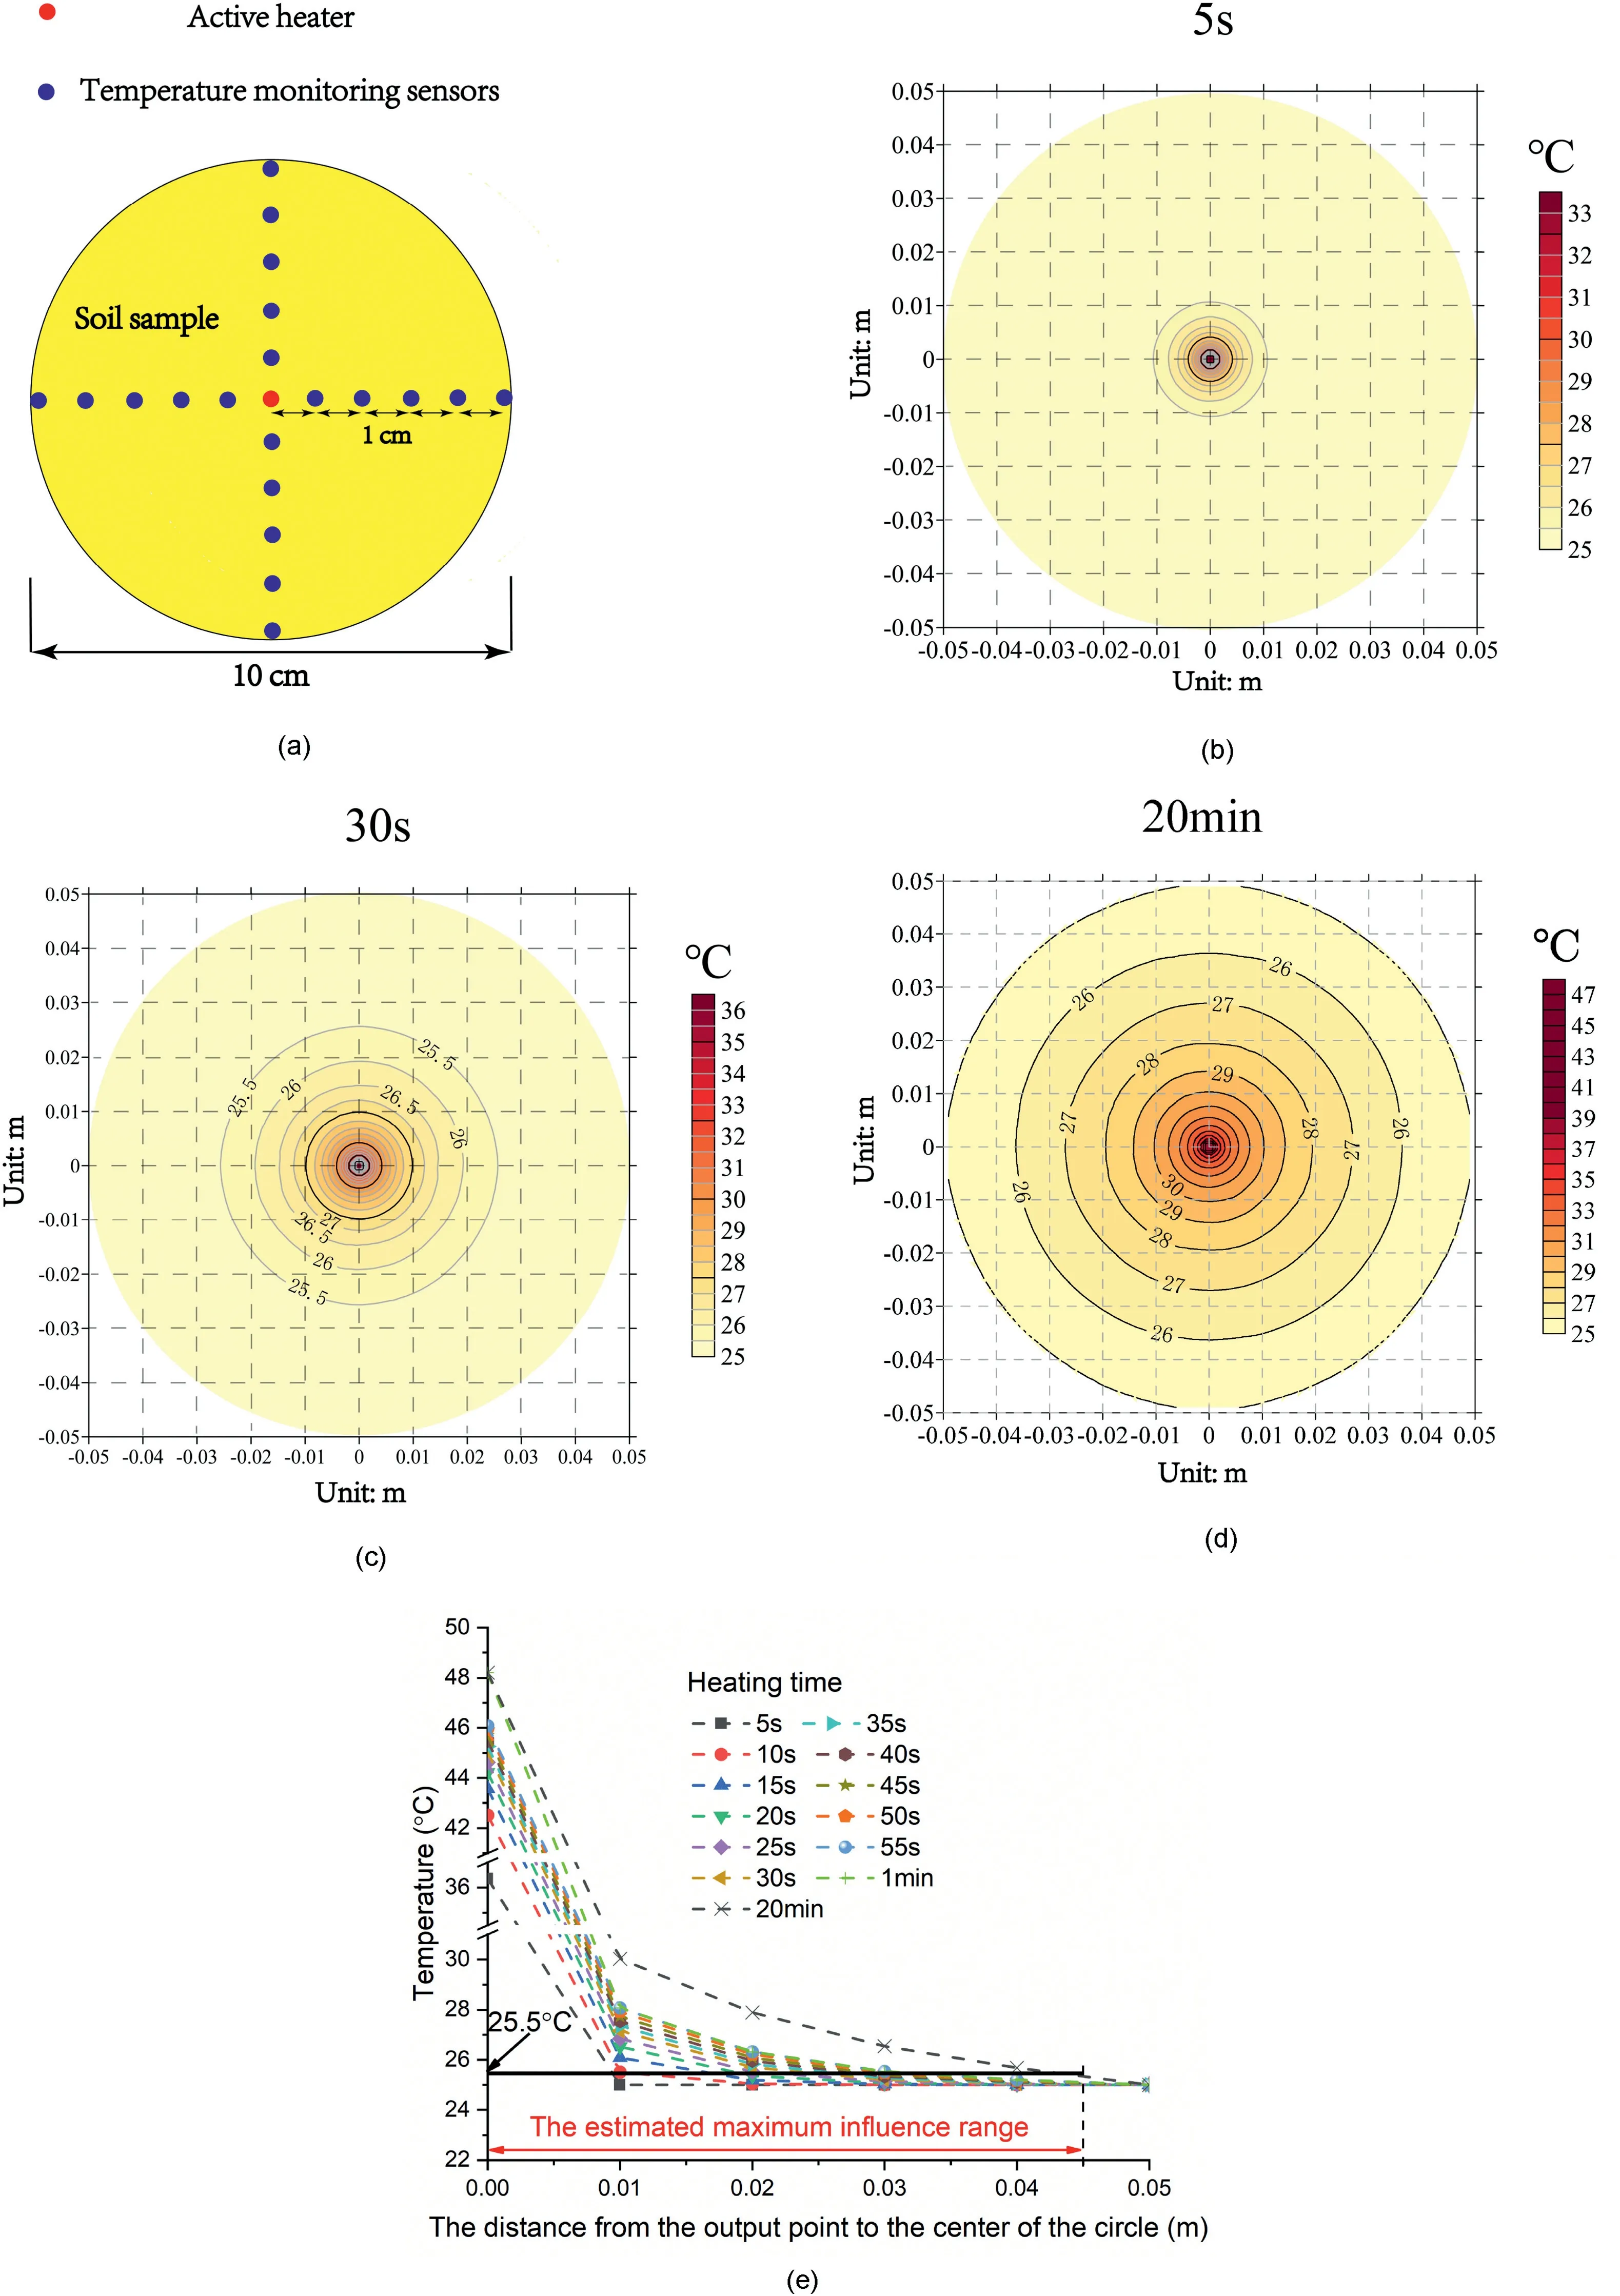
Fig.6. Determination of the maximum influence range of heating process:(a)Sensor installation plan;(b,c,d)Contour maps measured after 5 s,30 s and 20 min of heating time;and(e)Radial temperature distribution after heating for 20 min.The spacing of the measuring points is 1 cm,and the temperature of the position between the measuring points is obtained by interpolation of adjacent measuring points. The point where the temperature increases by 0.5 C is the point affected.
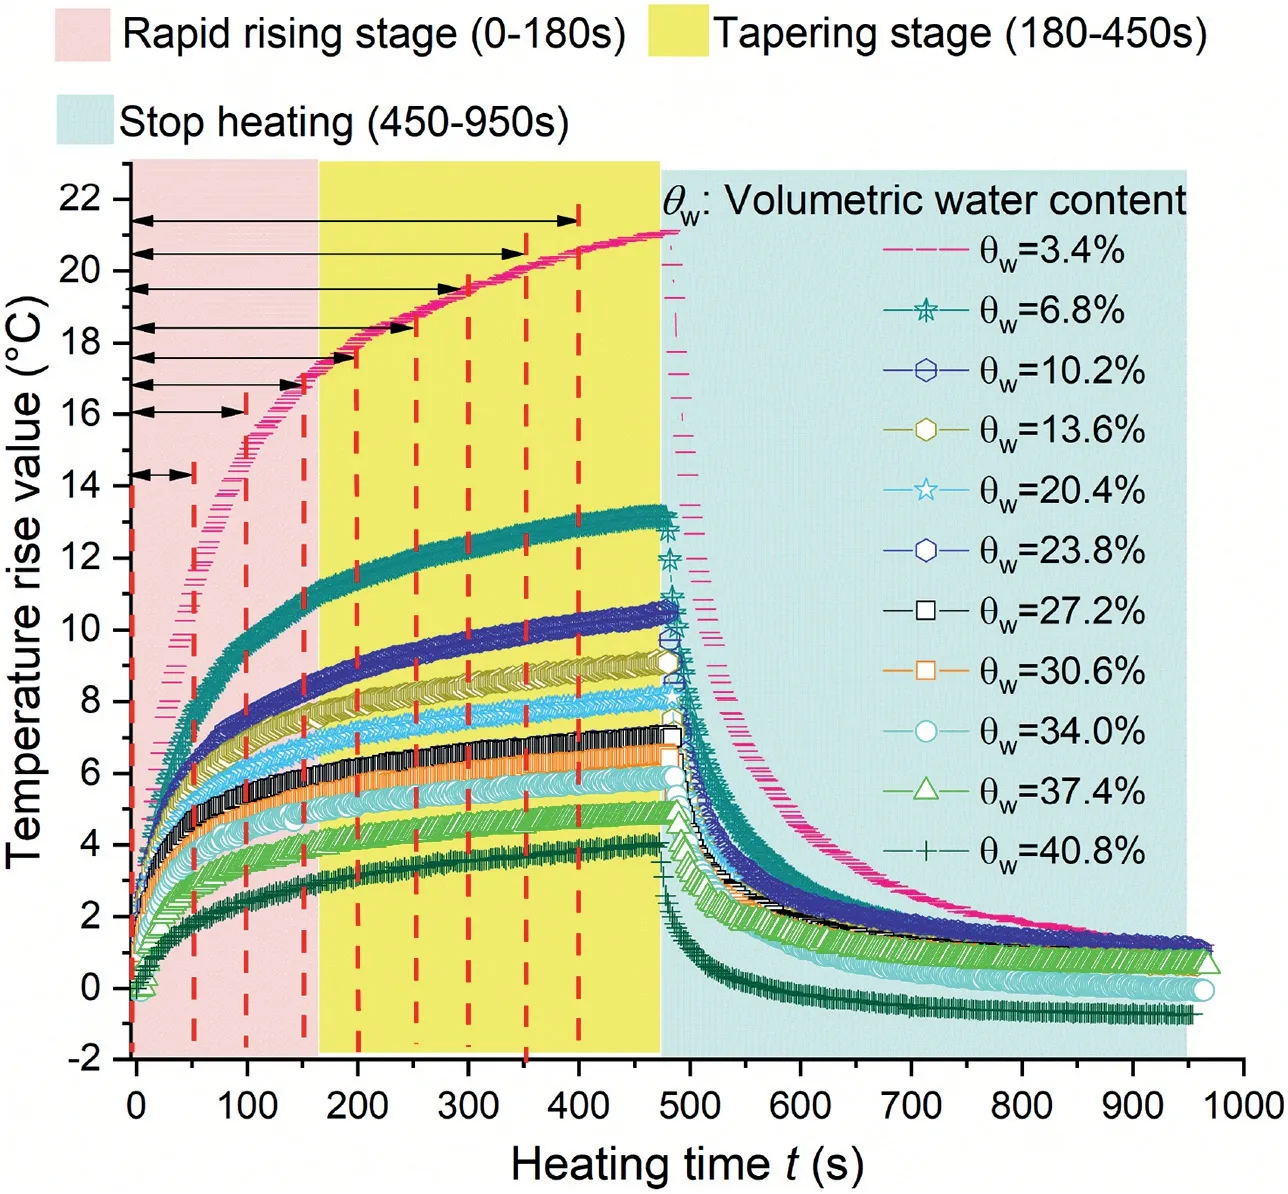
Fig. 7. Temperature duration curves of silty clay measured by FBGS.
5.1. Data analysis using temperature characteristic value method in Cao et al. (2018)
Based on the test data in Fig.7,the relation betweenTtandwfor the silty clay tested can be determined by Eqs.(5)e(7),as shown in Fig. 8. Such relation can be applied to further laboratory/field measurements to infer the soil water content from the measured temperature characteristic valueTt, which was the average temperature during the period of 150e400 s in the heating process at the tapering stage in Fig. 7.
5.2. Data analysis using integration data analysis method
Referring to Fig. 9, the relation between temperature characteristic value (Ft) and volumetric water content (w) can be divided into two segments, i.e. a linear segment (Eq. (11)) and a curve segment (Eq. (10)). A possible reason can be that whenwis larger thant,the bulky water, which is mainly stored in the macropores,controls the thermal conductivity of soil;whereas whenwis lower thant,the bulky water has been drained. Therefore, only the capillary water, which is mainly stored in the micropores or intraaggregate pores,exists and controls the thermal conductivity of soil.
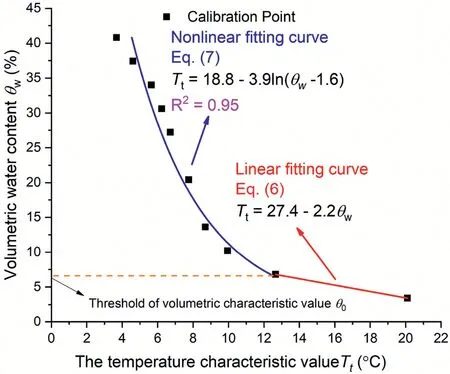
Fig. 8. Calibrated relation between soil water content and temperature characteristic value.
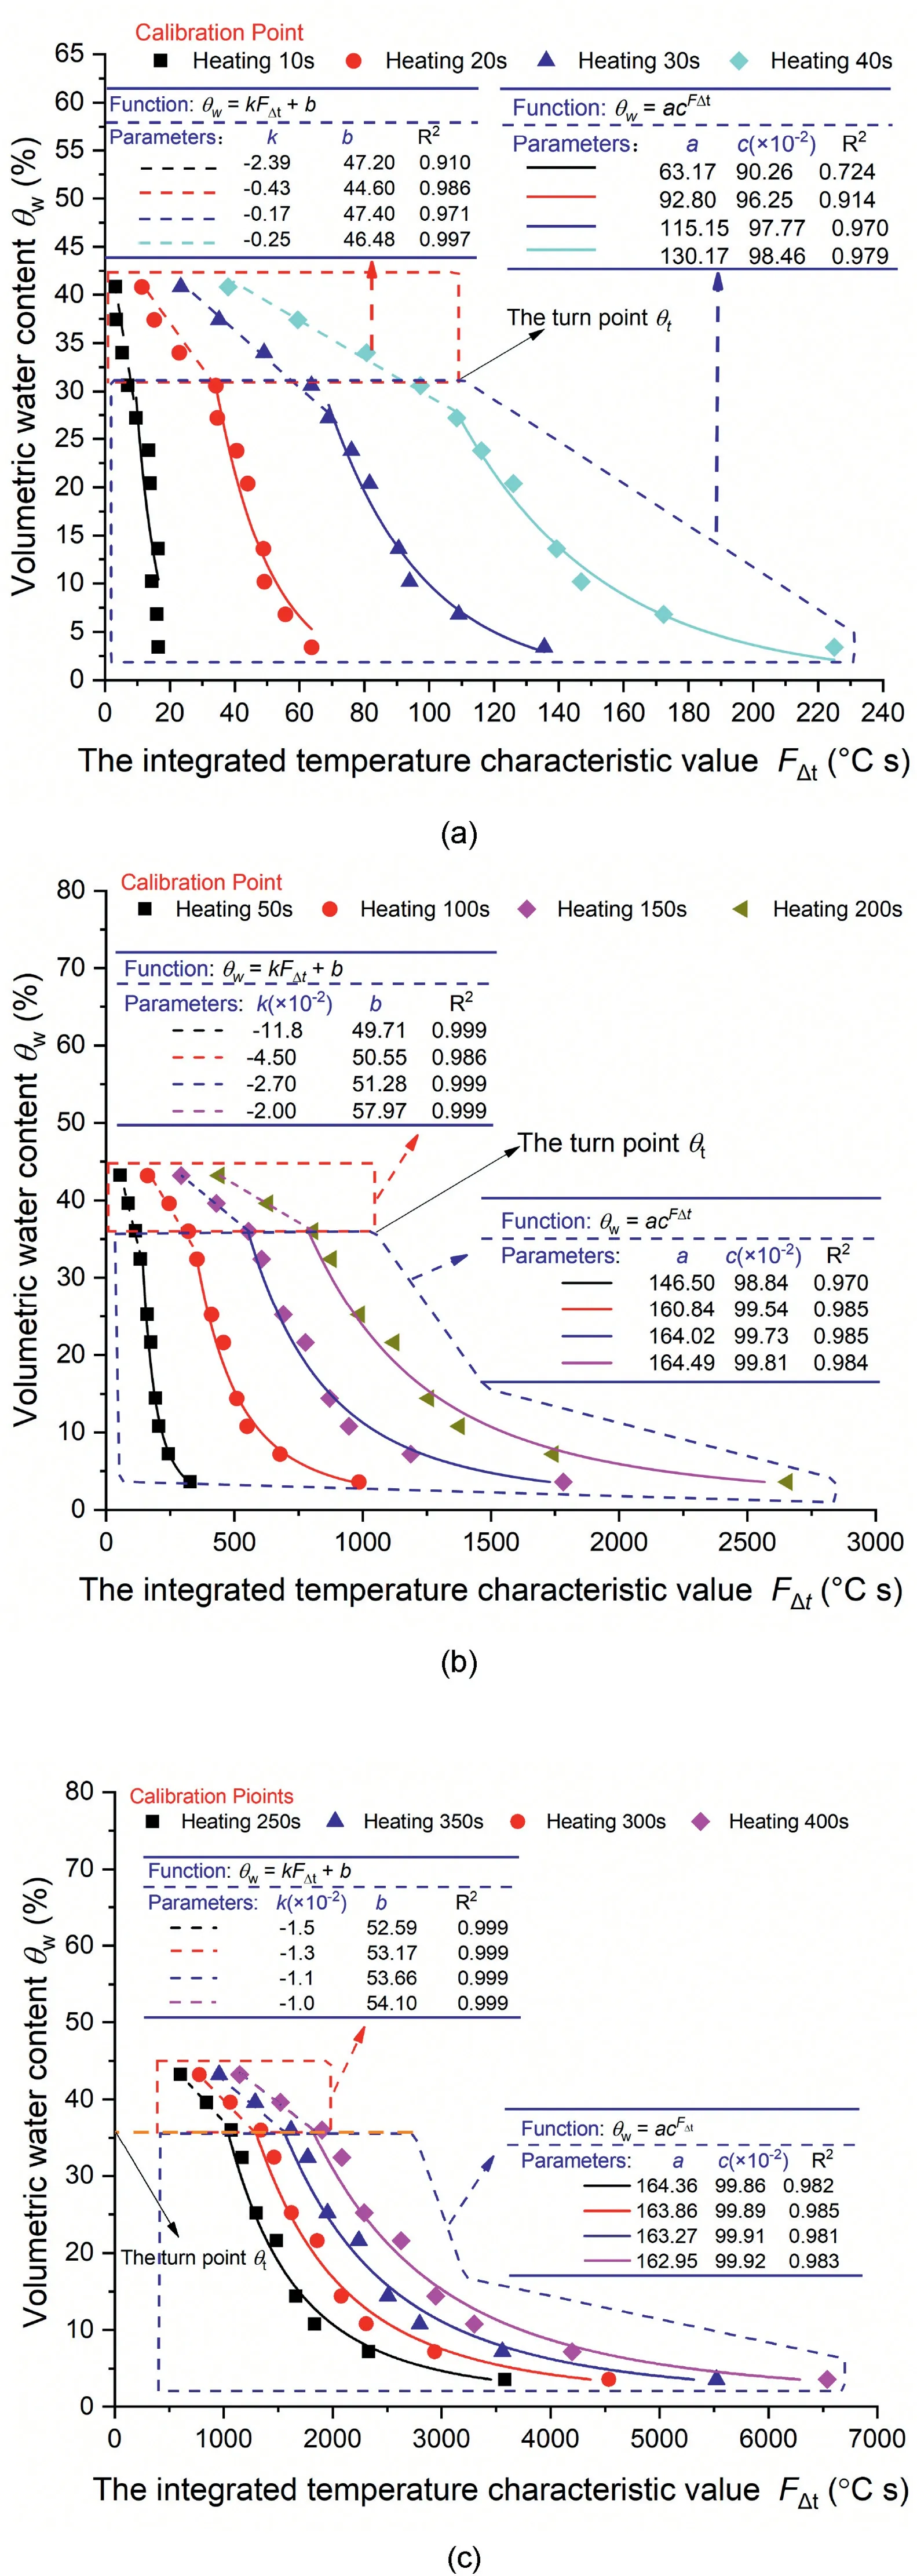
Fig. 9. Results by the integration data analysis method: (a) Heating time of 10 s, 20 s,30 s and 40 s;(b) Heating time of 50 s,100 s,150 s and 200 s;and (c)Heating time of 250 s, 300 s, 350 s and 400 s.
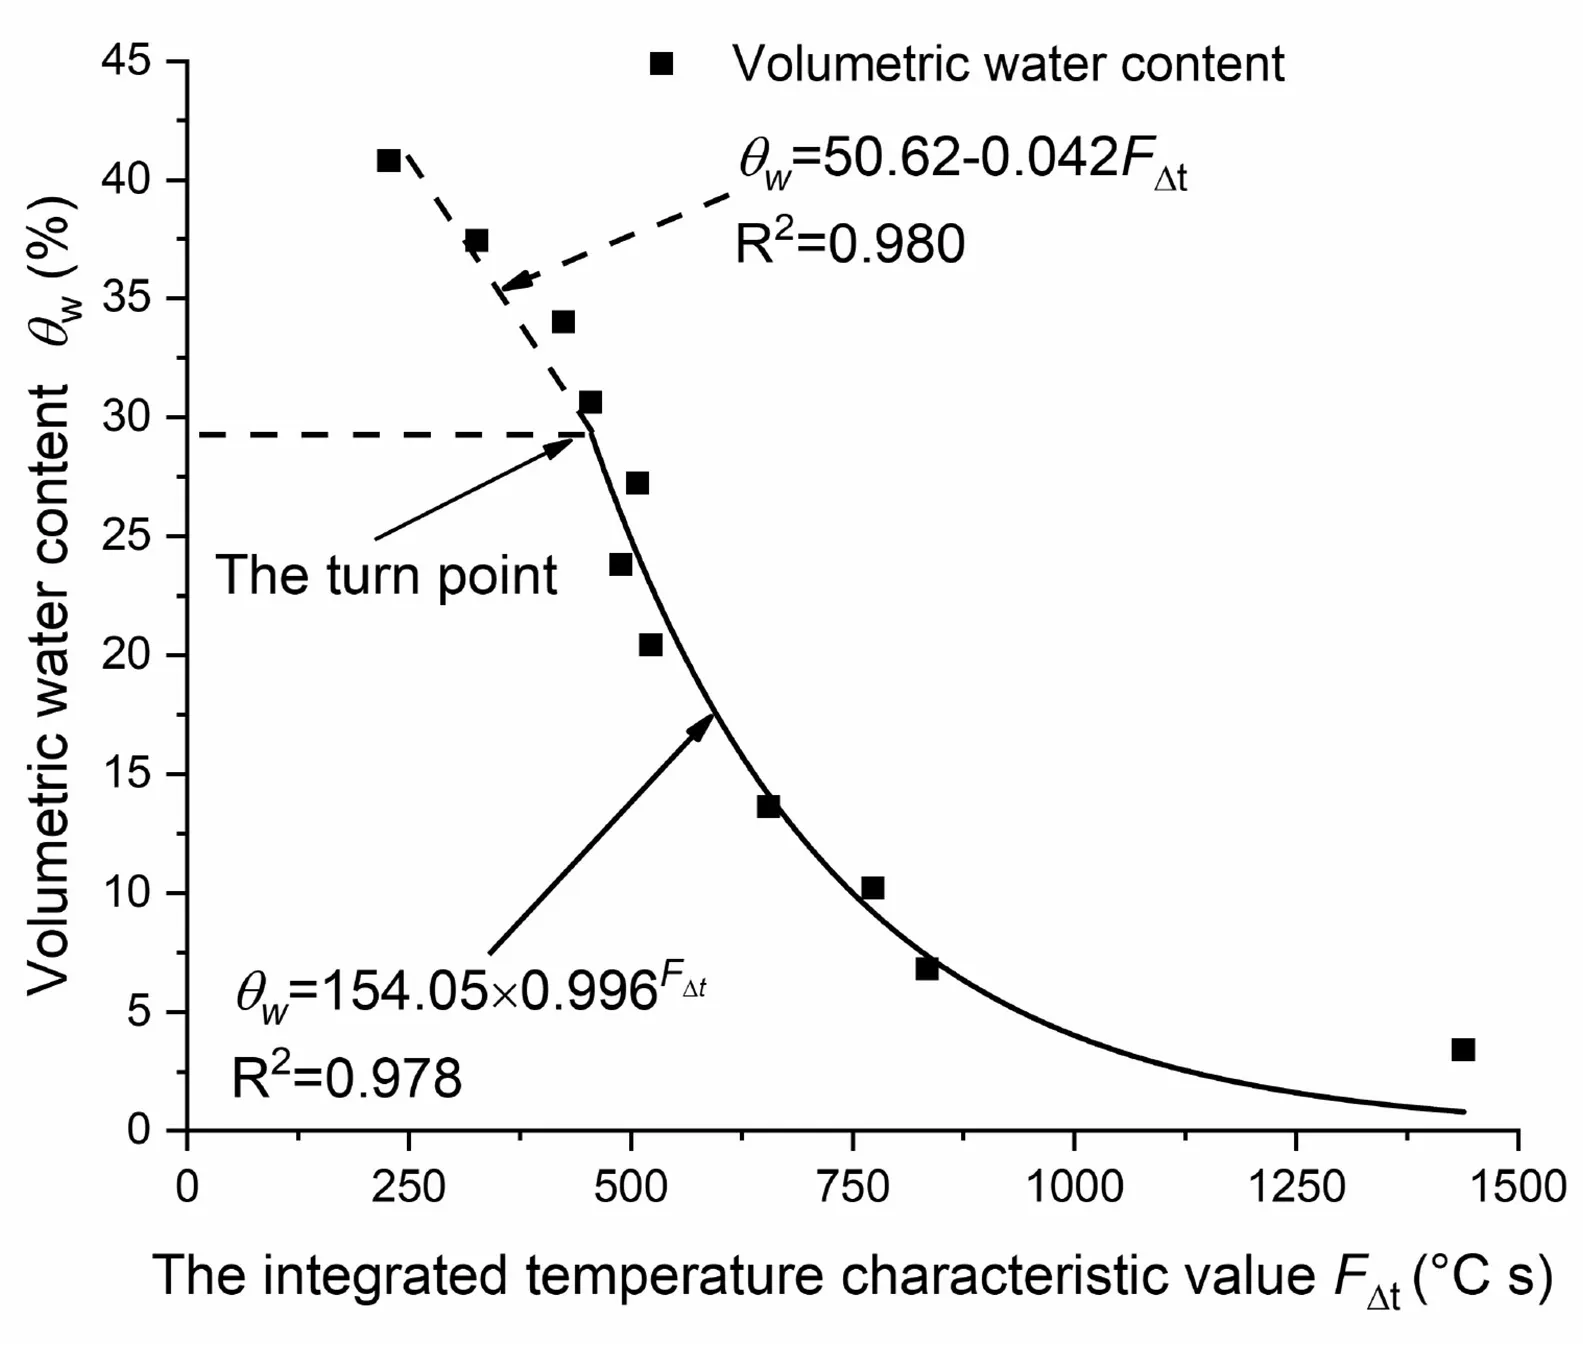
Fig.10. Calibrated relation using the data recorded from the cooling process.
As shown in Fig. 9, Eqs. 8e11 can characterize the relation betweenFtandwvery well, i.e. the fitted curves haveR2values larger than 0.97 except for curve at heating time of 10 s and 20 s in Fig.9a.That is to say,even if the heating time is 30 s,Eqs.(10)and(11)can still be well fitted to calculate the water content.Moreover,Eq. (10) with only two fitting parameters will have a better fit convergence than Eq. (7).
5.3. Data analysis in cooling process
As shown in Fig. 7, a sharp drop begins immediately after the heating stops,and the curve gradually tends to be stable after 350 s.In order to avoid the error caused by the sharp drop of the curve,the paper used the integral value of the entire cooling process(450e950 s) to calibrate the water content.
Fig.10 reveals that the integration data analysis method is also valid for the data recorded from the cooling process.The turn point between the linear part and the nonlinear part occurs at water content of around 30%, which is similar to Fig. 9a. Nevertheless, it seems feasible to use the data recorded from the cooling process to calibrate theFt-wcurve,but this is not convenient compared with using the data recorded from the heating process. Moreover, thecorrelation coefficient (R2) from the cooling process is slightly less than that in the heating process (Fig. 9b and c).
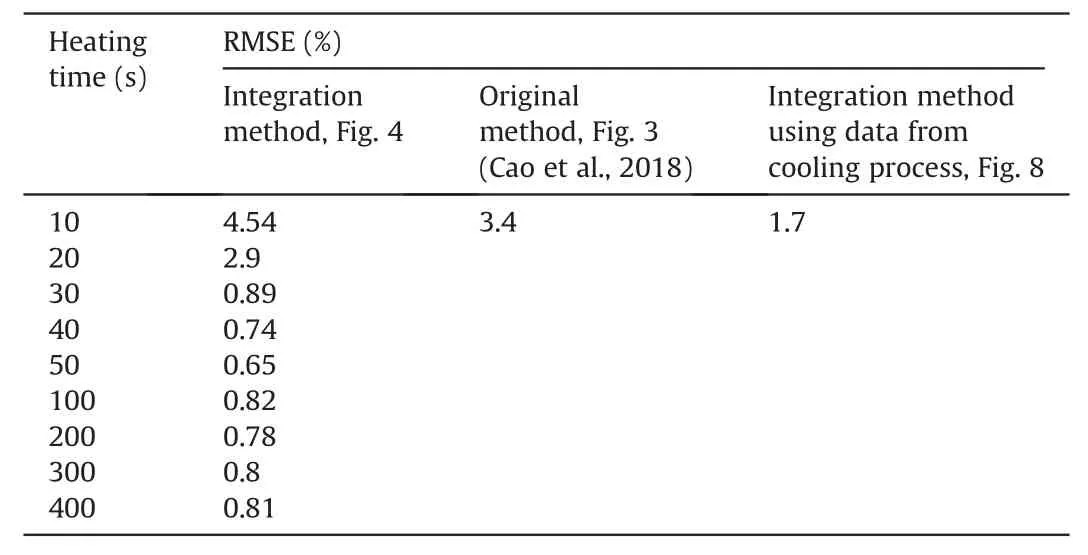
Table 2Comparison of the accuracy of original and integration methods.
5.4. Comparison of the accuracy of two data analysis methods
As listed in Table 2,the root mean square errors(RMSE)values of the integration method are no more than 2%.Meanwhile,RMSE of the original method(Eqs.(5)e(7)and Fig.7)is 3.4%.As lower RMSE indicates higher accuracy, the integration method has a better performance compared to the original method.
As for calibrating the FBGS using the data from the cooling process, the RMSE value is around 1.7%, and the correlation coefficient is higher than 95%. Even though it takes a relatively long time for soil cooling-down,the method can still calibrate the water content effectively.
Figs.11 and 12 show the results of the error of the data obtained after heating of 50e400 s. The RMSE values of the integration method are no larger than 1.5%compared with those of the original method (Table 2). Of all the data in Figs.11 and 12, the maximum error value does not exceed 2.9%. However, there are many inevitable factors that might affect test accuracy,e.g.soil density,particle shape,and pore distribution(C?té and Konrad,2005).Furthermore,with increase of heating time, the maximum error is stable with value within 2.7%, and the fluctuation trend of error is gradually reduced (Fig.12).
Fig. 13 revels the comparison of the integration data analysis method (in the heating and cooling processes) and Cao et al.(2018)’s method. The maximum error of calibration result by Cao et al. (2018)’s method is around 8.98%, which is nearly three times the error by the integration data analysis method.As shown in Fig.13,whether in the heating or cooling process,the calibration value from the integration method is closely around the 1:1 line,suggesting that this method is a good way to calibrate the AHFO sensors.
In fact,since the integration data analysis method was proposed by Sayde et al. (2010), the factor controlling the accuracy of the method was the accuracy of the fiber itself. Hence, they did not finalize the integration analysis method and offer good test results(Note:the minimum scan interval was 5 s at that time,and it is now less than 1 s).
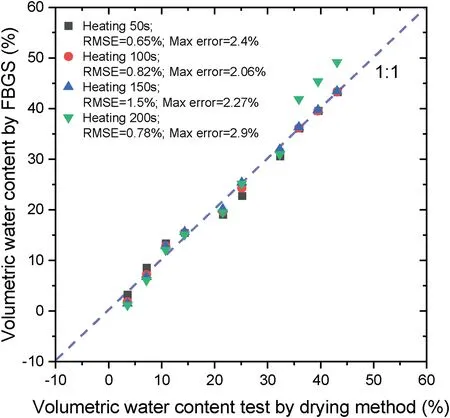
Fig. 11. Results of error analysis (comparison of data obtained after heating of 50e 200s).
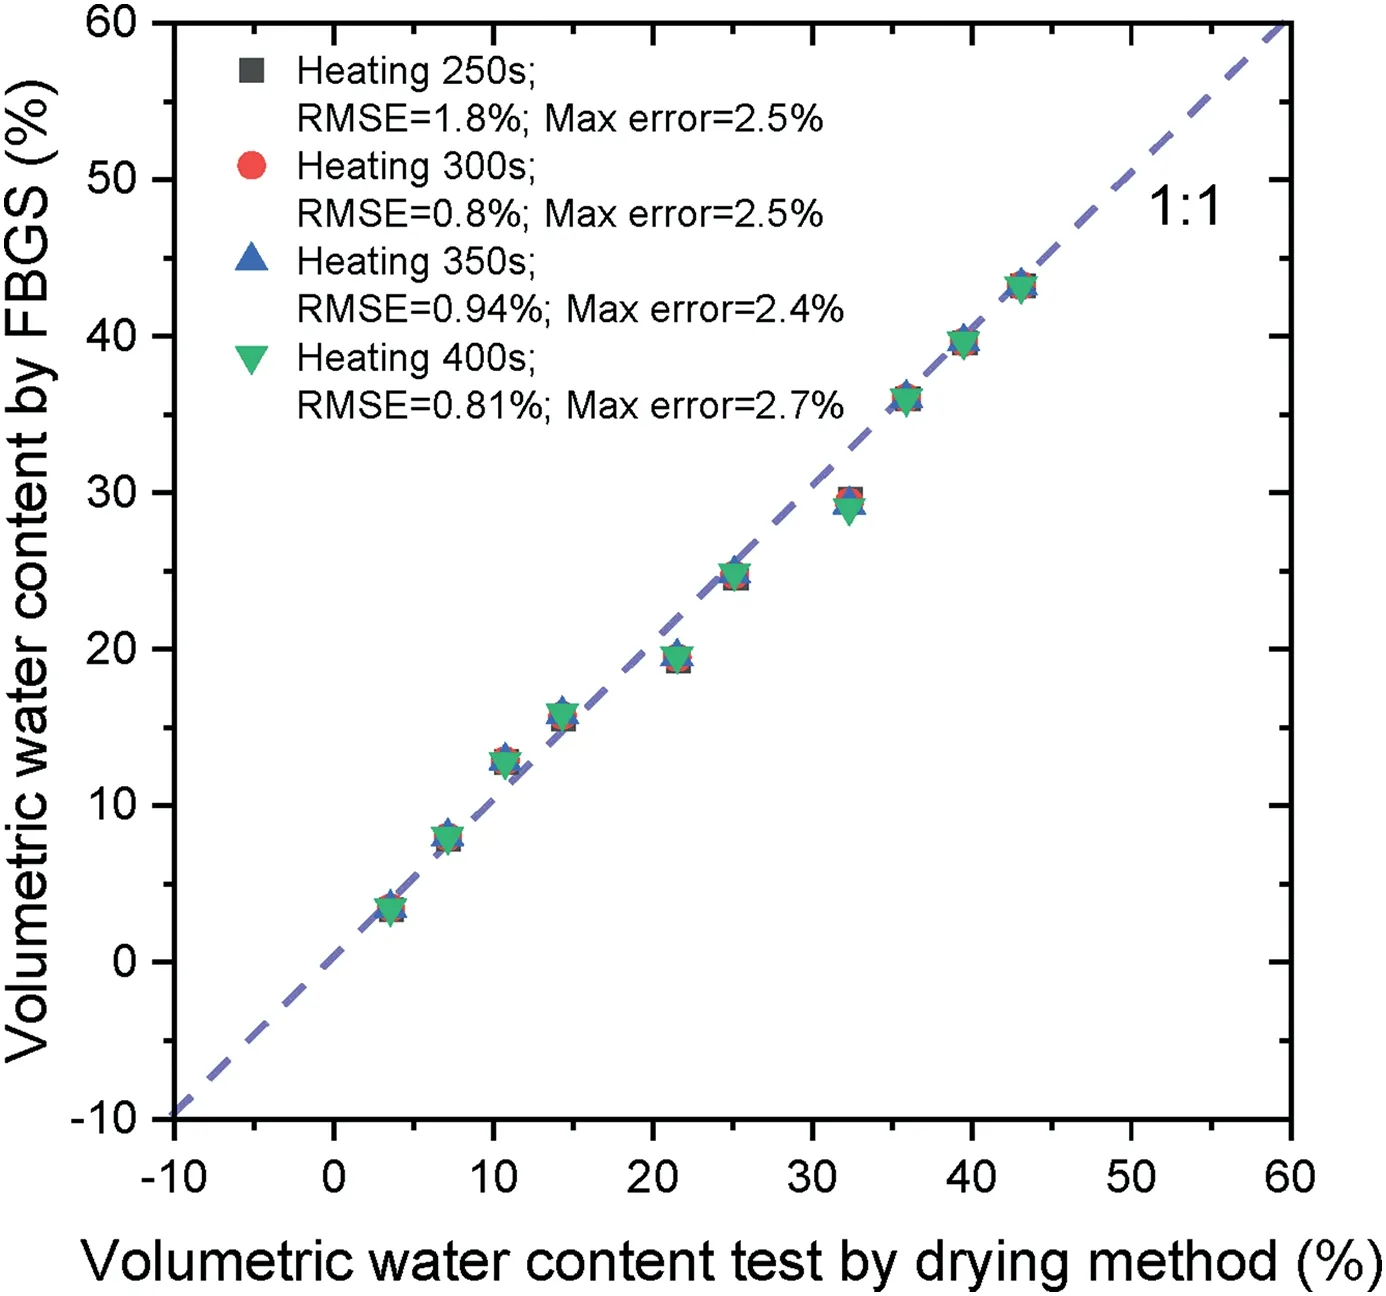
Fig.12. Results of error analysis (comparison of data obtained after heating of 250e 400 s).
5.5. Verification of repeatability
Parallel tests were used to check the repeatability of this technique.Three groups of soil samples with different volumetric water contents(3.6%,19.8%and 40.5%)were tested.The results are illustrated in Fig.14. The temperature errors are within0.15C.With the same data analysis technique, the maximum errors of measured water content for each sample are 3.4%,1.9% and 1.4%,respectively.
One should be noted that the start time of heating process is found to have some influence on the test results. If the wavelength does not reach a stable value (the fluctuation of the wavelength is within 0.01 nm), a thermal equilibrium between FBGS and the surrounding soil may be not reached and the results may involve some error. Hence, in the integration data analysis method, only after the wavelength does not change, the heating process could be started and the equilibrium temperature is recorded asT0.During the integration,onlyTTT0should be integrated. Hence, the start time for the integration does not affect the result.
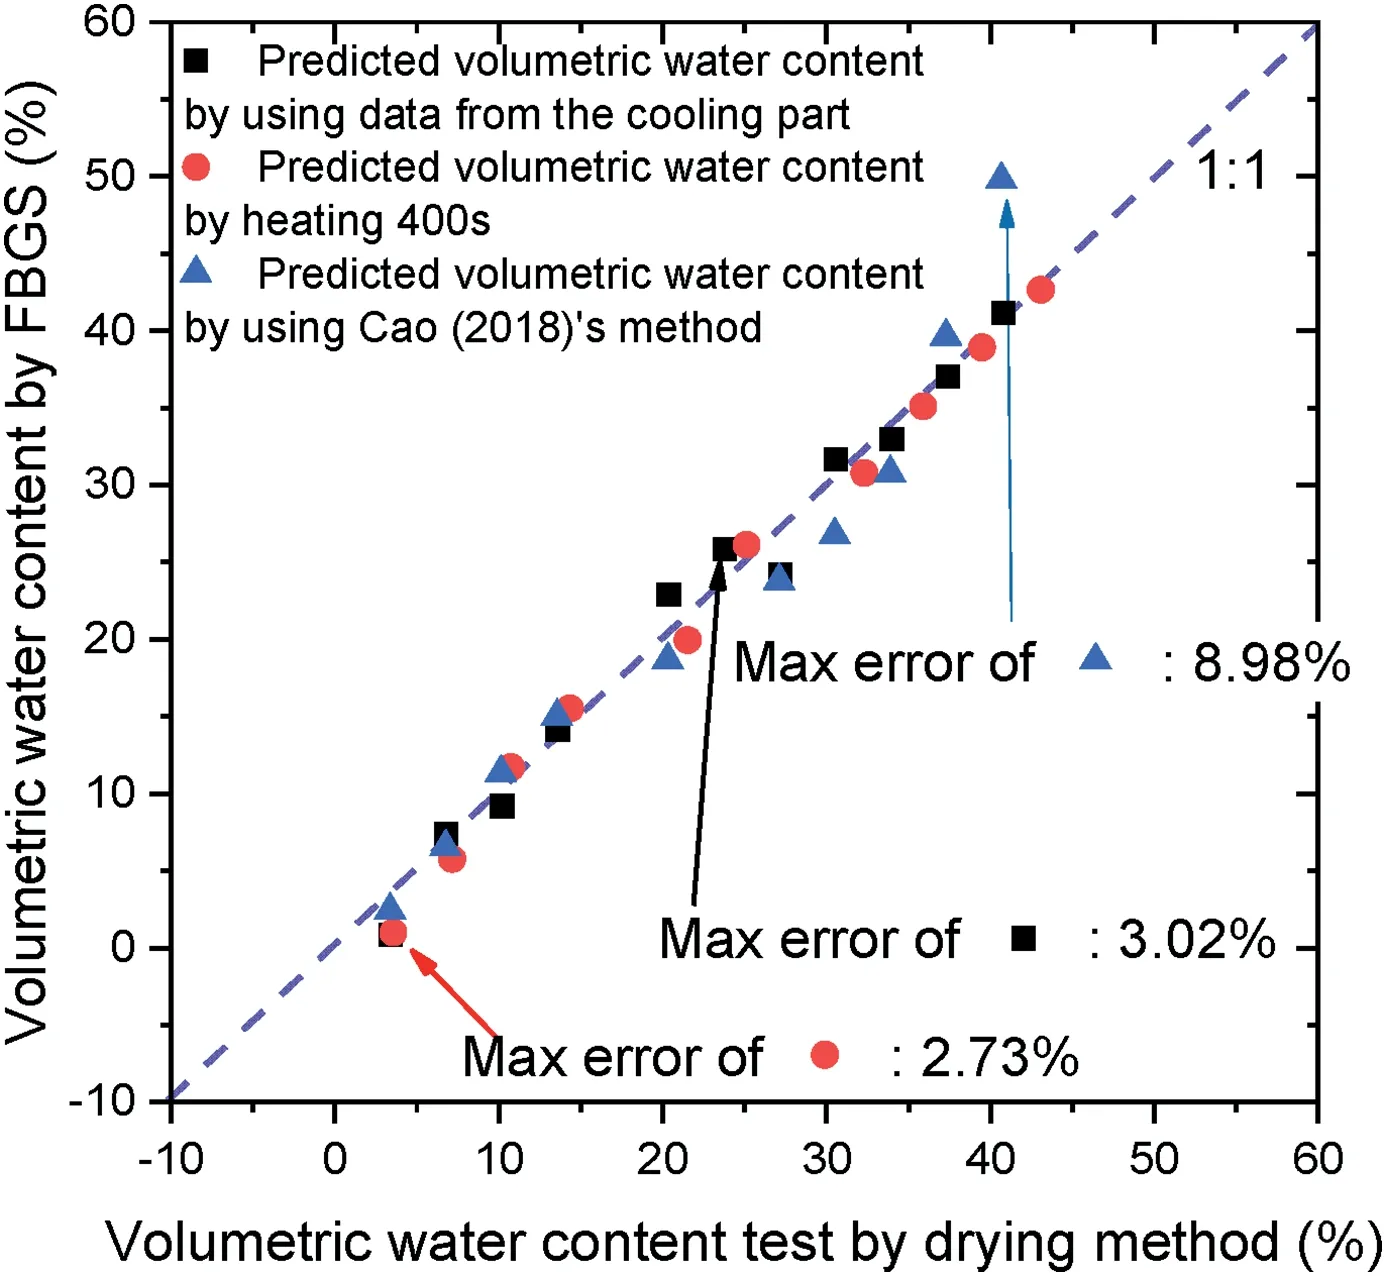
Fig. 13. Results of error analysis (comparison between integration data analysis method (in heating and cooling processes) and Cao et al. (2018)’s method).
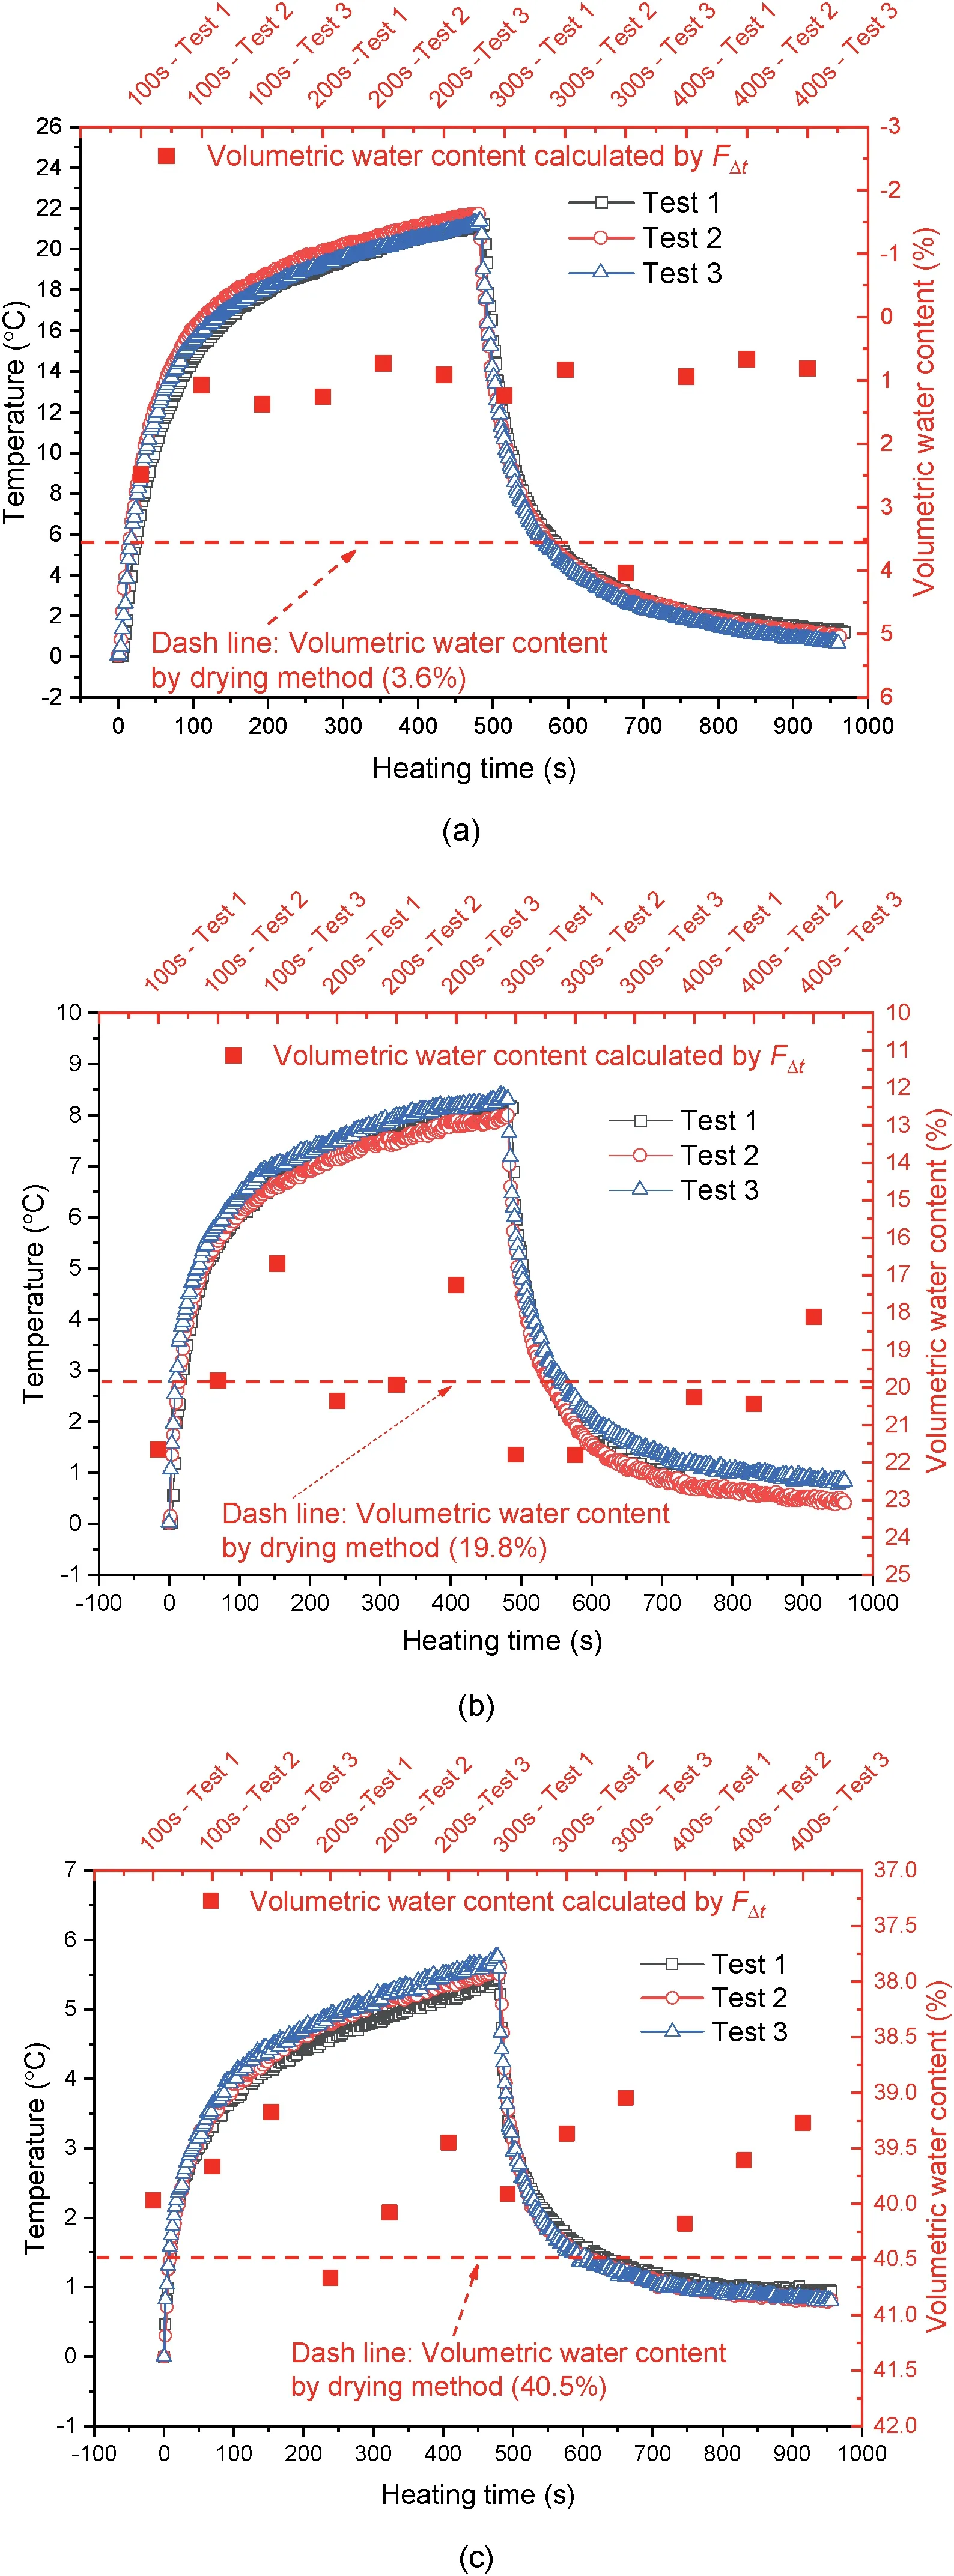
Fig.14. Verification of the repeatability of the test:(a)w 3.6%, (b)w 19.8%, and(c) w 40.5%. Each soil sample was heated by AHFO sensor at a constant power of 2.7 W/m for 450 s and then stopped heating.Each sample was tested three times with an interval of 30 min. The explanation of “400 s -Test 1” is as follows: “400 s” means the integration in the heating curve from 0 to 400 s,and the “Test 1”indicates the first test.
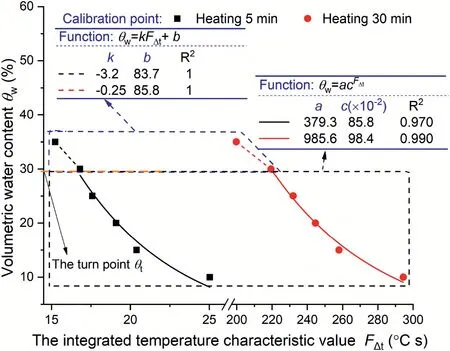
Fig.15. Integration analysis results of the data in Fig. 8 from Cao et al. (2015).
6. Discussion
6.1. Revisit of data reported in Cao et al. (2015)
The data in Fig. 8 of Cao et al. (2015) were analyzed by the integration analysis method. As shown in Fig. 15, the integration data analysis method has good performance and can avoid the trouble for the rough division of the rapid rising stage and the tapering stage.
6.2. Influence of fiber length
The actively heated FBGSs used by Cao et al. (2015) had the length and diameter of 15 cm and 5 cm, respectively. The sensor length used in Cao et al.(2018)even reached 1 m.A long fiber can be easily broken upon bending or shearing, especially when it is buried in coarse soil or upon compaction. Besides, a long fiber sensor is hard to calibrate and lack of flexibility in actual engineering applications.
In this study, the length and diameter of fiber sensors were reduced to 4 cm and 4 mm,respectively,and high-quality data were obtained as shown in Fig.7.That is to say,a short-length sensor can still be effective for this technique.If a multi-point measurement is in demand, the short sensor can be easily connected into long clusters by hot pyro-condensation pipes.Such clusters can achieve the same function as the long fiber, but avoid the broken problem and the difficulty of calibration.
6.3. Influence of heating time
Sayde et al.(2010)pointed out that a heat pulse with a long time might cause significant disturbance to soil samples, e.g. the soil water content migration. At the same time, the measurement results in Fig.14b and c also confirm this.As the number of repeated heating increases,the measured water content decreases.That is to say, a shorter heating time during the measurement can help to reduce the disturbance to the soil water content field and improve the accuracy of soil water content measurement.
Using the integration data analysis method,w-Ftrelation with a heating time of 10e400 s is calculated,as compared in Fig.9.The results demonstrate that the relations betweenFtandwhave similarity when heating time varies. Even at the heating time of 20 s, an effective relation ofw-Ft can be obtained.
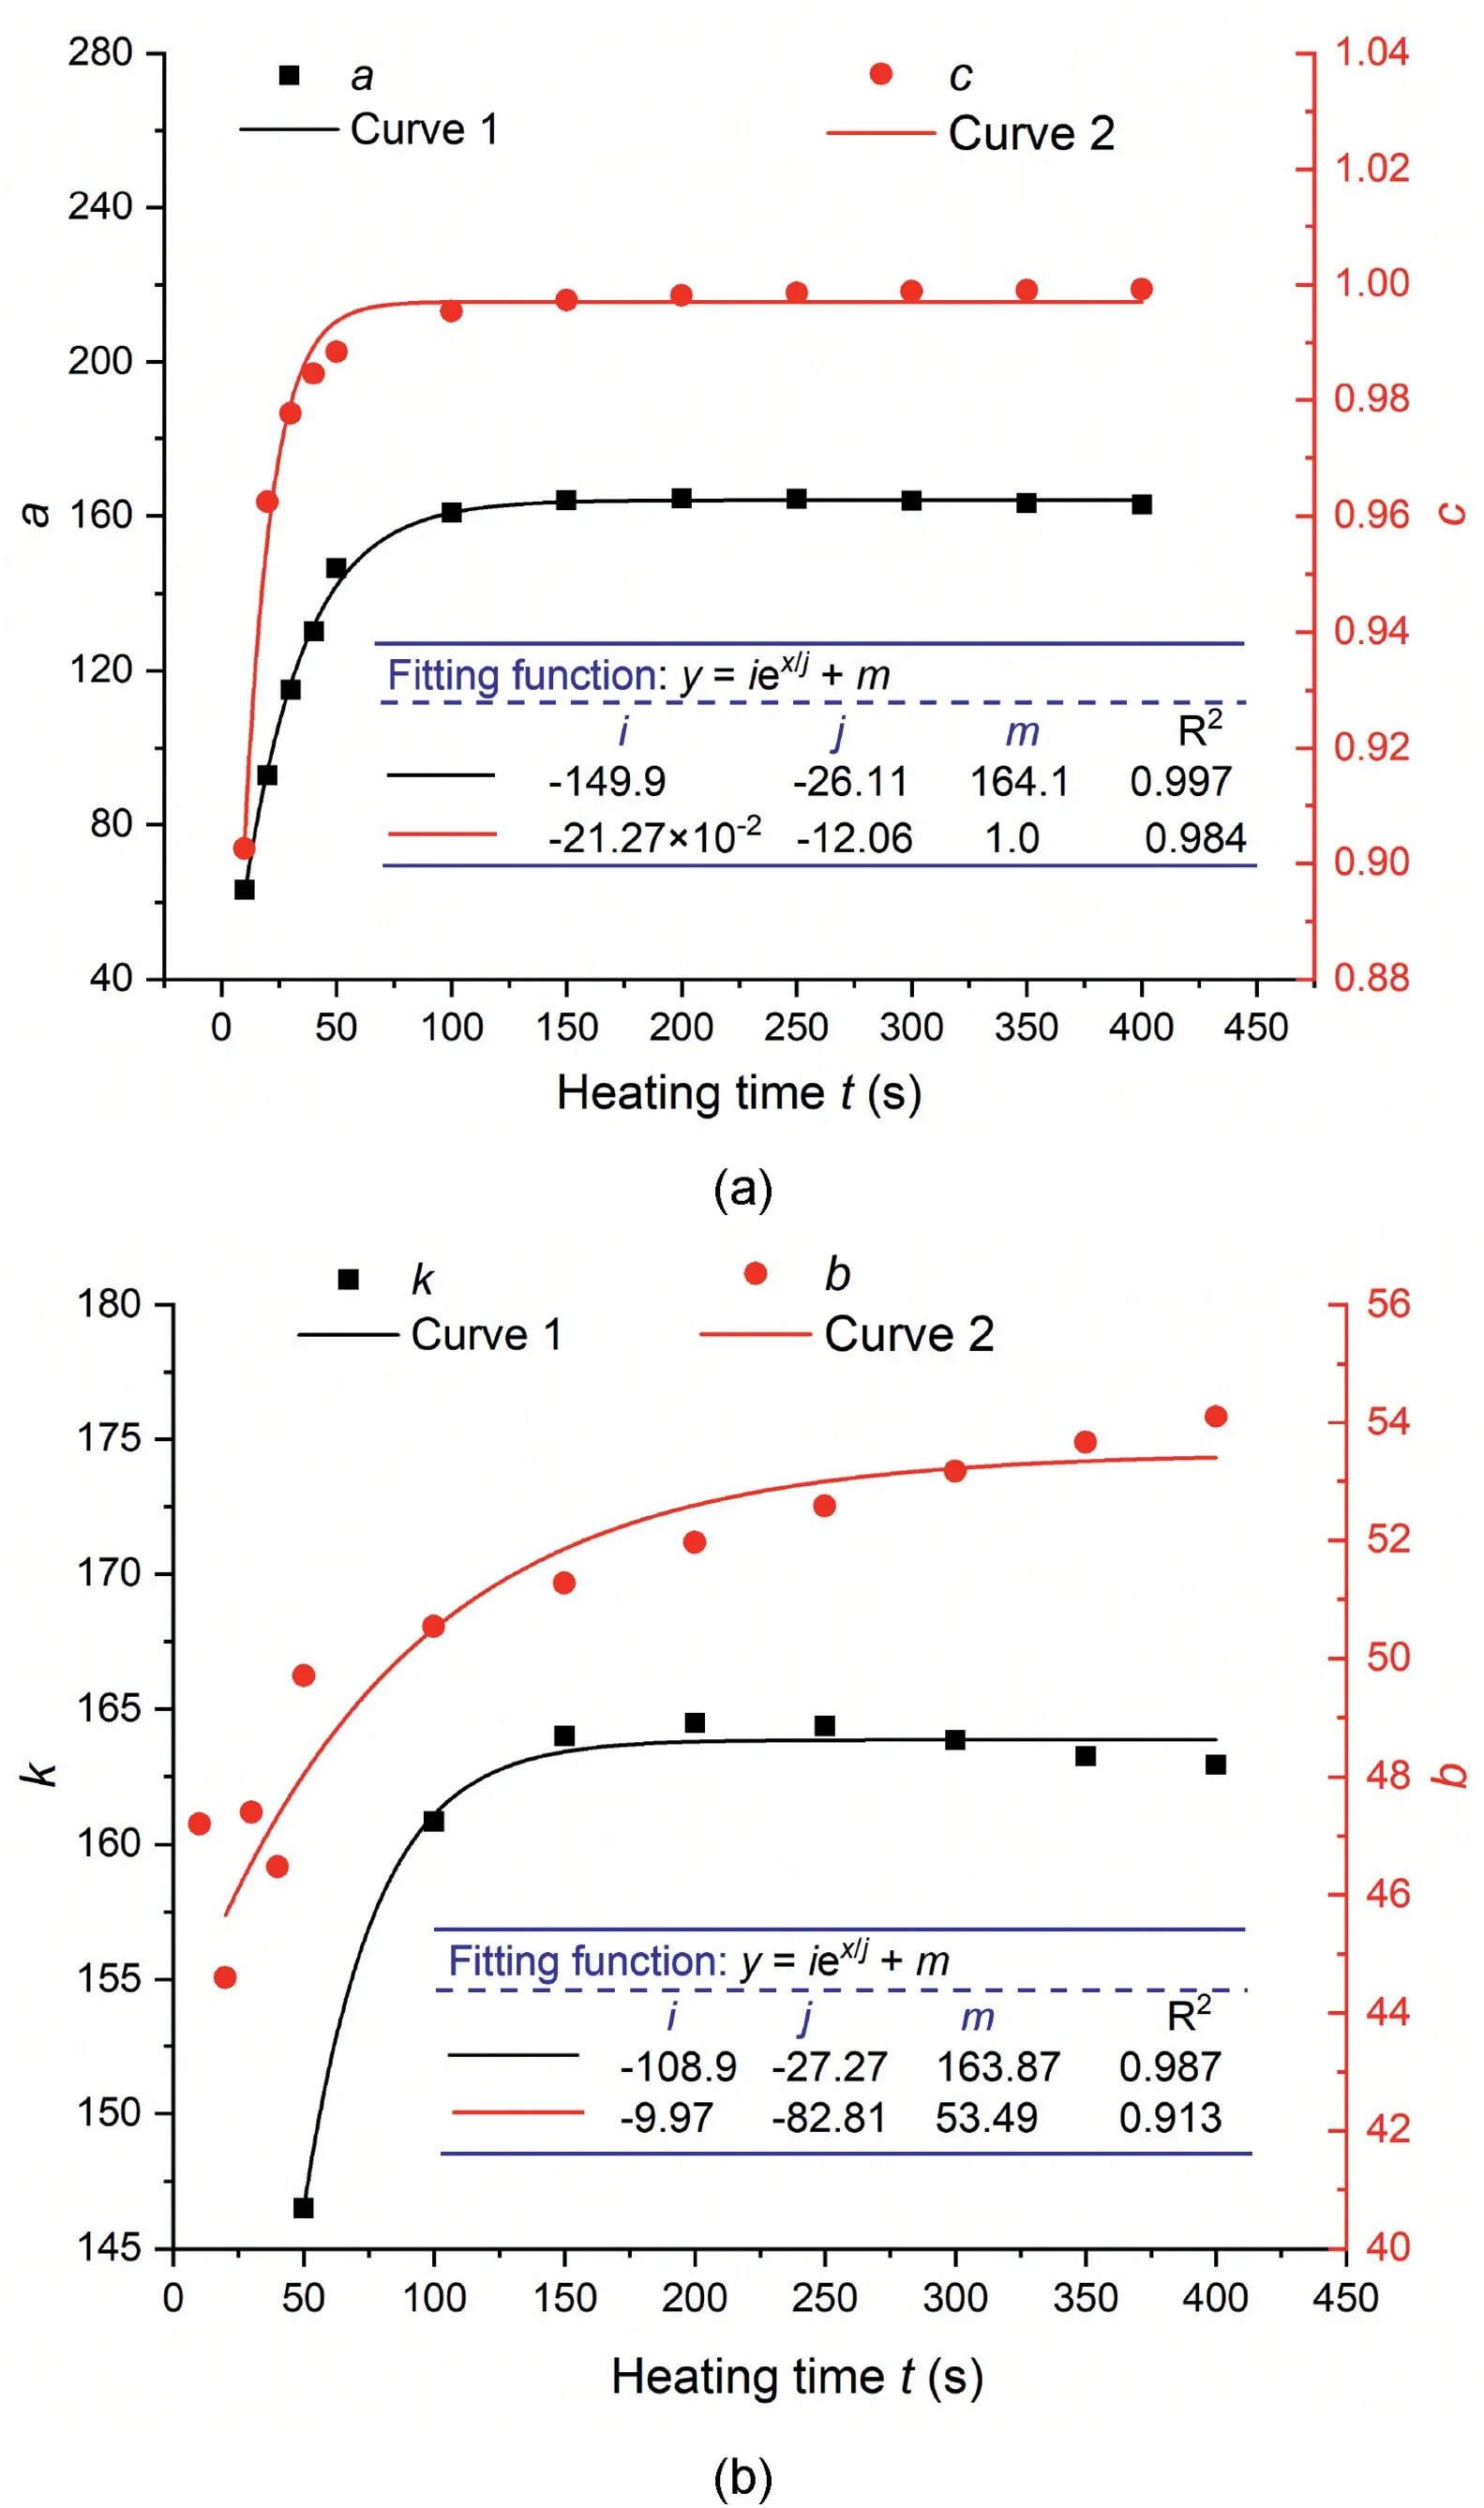
Fig.16. Variations of fitting parameters involved in Eqs. (6)and (7) with heating time t: (a) a and c, and (b) k and b.
Referring to Fig.9,the fitting parameters seem to depend on the heating time. As illustrated in Fig.16, the fitting parametersa,b,kandcvary with heating time.Obviously,the parametersa,bandktend to stabilize after the heating time exceeds 100 s except for the parameterb.
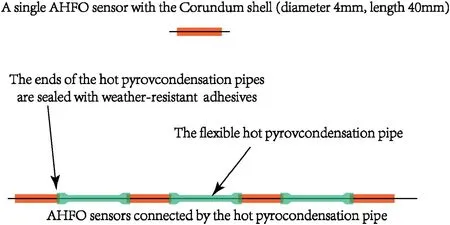
Fig.17. A recommended technique for the application of AHFO sensor in field.
That is to say, if the heating time is larger than 75 s, the fitting parameters will not be sensitive to the heating time and the reliability of calibration will be high.With this consideration,a heating time of 75 s is recommended but not always, because when rapid measurements are needed in practical engineering applications,the results of 30 s-heating are also acceptable in view ofR2and RMSE values from Fig. 9a and Table 2. Such a recommendation of heating time is much lower than that used by Cao et al.(2015)(25e 30 min)and Cao et al.(2018)(300 s).In fact,shortening the heating time can also benefit continuous measurement.
6.4. Suggestions on engineering application of AHFO sensors
The major limitation of AHFO sensor is that the relation between volumetric water content and thermal phenomenon varies with soil types. Hence, prior to AHFO sensor being used practically,calibration tests should be carried out to obtainw-Ftcurve.Another issue is that the test results can only reflect the average thermal properties of soil. The homogeneity of soil cannot be considered in this technique. Therefore, a representative soil sample in field should be used as a benchmark. A recommended technique for the application of AHFO sensor in field is illustrated in Fig.17.The corundum is hard and has poor ductility.Therefore,it is not suitable for measurement in gravel soil. If a soil with a higher content of gravel is encountered in actual engineering applications,some supplementary measures such as pre-drilling should be adopted to avoid the damage of corundum.
For multi-point measurement outdoors, individual AHFO sensors should be connected into clusters, and the spacing between the sensors can be easily adjusted,as shown in Fig.17.The weatherresistant adhesive at the end of the flexible hot pyrocondensation pipe is impervious to water and can protect the heating wire of the sensor from rusting. However, the embedding of sensors is a technical problem that needs further exploration. At the construction site,any excavation and backfilling will disturb the intact soil. The dry density of the soil after backfilling must be different from the undisturbed soil,which will inevitably bring errors to the measurement.
7. Summary
By reviewing the effect of heating time on measuring the volumetric water content using the FBGS, the following improvements were made to the measurement method of water content by FBGSs:
(1) An integration data analysis method and new fitting functions can be applied, instead of the original temperature characteristic value method proposed by Cao et al. (2015,2018).
(2) A short-term heating pattern can be used instead of the long term heating pattern.
(3) A short fiber can be used instead of the long fiber.
Declaration of Competing Interest
The authors wish to confirm that there are no known conflicts of interests associated with this publication and there has been no significant financial support for this work that could have influenced its outcome.
Data availability statement
Some or all data, models or codes that support the findings of this study are available from the corresponding author upon reasonable request.
Acknowledgments
This study is supported by the National Natural Science Foundation of China (Grant No.51979002).
 Journal of Rock Mechanics and Geotechnical Engineering2020年3期
- Journal of Rock Mechanics and Geotechnical Engineering的其它文章
- Crack initiation of granite under uniaxial compression tests: A comparison study
- Reliability analysis of slopes considering spatial variability of soil properties based on efficiently identified representative slip surfaces
- Critical state model for structured soil
- Coupled hydro-mechanical analysis of expansive soils: Parametric identification and calibration
- Benchmark solutions of large-strain cavity contraction for deep tunnel convergence in geomaterials
- Damage characteristics and catastrophic failure mechanism of coal rock induced by gas adsorption under compression