
Progress of Air Pollution Control in China and Its Challenges and Opportunities in the Ecological Civilization Era
2020-05-11 01:19:58XiLuShojunZhngJiXingYunjieWngWenhuiChenDinDingYeWuShuxioWngLeiDunJimingHo
Engineering 2020年12期
Xi Lu, Shojun Zhng, Ji Xing, Yunjie Wng, Wenhui Chen, Din Ding, Ye Wu,b,Shuxio Wng,b,*, Lei Dun,b, Jiming Ho,b,*
a State Key Joint Laboratory of Environment Simulation and Pollution Control, School of Environment, Tsinghua University, Beijing 100084, China
b State Environmental Protection Key Laboratory of Sources and Control of Air Pollution Complex, Beijing 100084, China
Keywords:
Air pollution control
Ecological civilization
PM2.5
Low-carbon development
Ozone
ABSTRACT China’s past economic growth has substantially relied on fossil fuels,causing serious air pollution issues.Decoupling economic growth and pollution has become the focus in developing ecological civilization in China. We have analyzed the three-decade progress of air pollution controls in China, highlighting a strategic transformation from emission control toward air quality management. Emission control of sulfur dioxide (SO2) resolved the deteriorating acid rain issue in China in 2007. Since 2013, control actions on multiple precursors and sectors have targeted the reduction of the concentration of fine particulate matter (PM2.5), marking a transition to an air-quality-oriented strategy. Increasing ozone (O3) pollution further requires O3 and PM2.5 integrated control strategies with an emphasis on their complex photochemical interactions. Fundamental improvement of air quality in China, as a key indicator for the success of ecological civilization construction,demands the deep de-carbonization of China’s energy system as well as more synergistic pathways to address air pollution and global climate change simultaneously.
1. Introduction
The past 30 years have witnessed dramatic economic growth in China. The gross domestic product (GDP) of China expanded by a factor of 43 from 1990 to 2017,with an average annual growth rate of more than 10% [1]. This marvelous achievement in China’s economy was primarily fueled by fossil fuels—particularly coal,the main source for the emission of a variety of air pollutants and carbon dioxide (CO2). China surpassed the United States in 2007 in terms of CO2emissions and in 2009 in terms of energy consumption, and has become the world’s largest energy-consuming and carbon-emitting country. In 2017, China was responsible for 23.2% of global energy use and 27.6% of global CO2emissions [2].China experienced its highest annual emissions of sulfur dioxide(SO2) in 2007, nitrogen oxides (NOx) in 2012, and primary fine particulate matter (PM2.5) in 2006 [3,4], at respectively 2.5, 4.6,and 1.5 times the corresponding values for 1990 in China(Fig.1[5,6]).In 2017,approximately 70%of all 338 municipal cities in China still did not meet the National Ambient Air Quality Standard (NAAQS) [7], with non-attainment of PM2.5as the most prominent air pollution problem. China faces the dual pressures of the improvement of national air quality and the mitigation of climate change.
Over the past three decades,China has been making continuous efforts to decouple air pollution and carbon intensity from economic growth, with the ultimate goal of achieving a society based on sustainable development and ecological civilization. In the early stages (the 1970s and 1980s), air pollution controls in China were primarily implemented at the local level, with the aim of controlling dust emissions. Later on, acid rain emerged as a serious problem in China,influencing more than 30%of the total territory, particularly in the southern and southwestern regions.Reducing SO2emissions from coal combustion sectors has since become more regulatory since the 1990s [8]. These efforts have led to China’s total emissions of SO2and primary PM2.5peaking before 2010 [5].
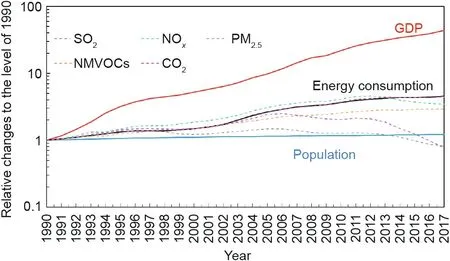
Fig.1. Trends in GDP,energy consumption,and population,as well as emissions of SO2, NOx, primary PM2.5, non-methane volatile organic compounds (NMVOCs), and CO2 between 1990 and 2017, with values for 1990 taken as 1. GDP, energy consumption, and population data were obtained from the National Bureau of Statistics of China. Emission data of air pollutants (SO2, NOx, PM2.5, and NMVOCs)for 2010-2017 was obtained from Tsinghua University’s multi-resolution emission inventory for China (MEIC) [5]. CO2 emission data was obtained from the International Energy Agency (IEA) [6].
At present,tackling the PM2.5issue is the most challenging due to its complex formation, with contributions from multiple precursors and sources.Air quality management in China has thus transformed into a new model: In contrast to its initial focus on control actions for a single pollutant or in a single sector,air quality management has now been redesigned to mitigate multiple precursors from multiple sectors through extensive coordination at the regional or national level.More recently,China has launched a series of movements including the short-term ‘‘blue sky defense battle” between 2018 and 2020, and the long-term ‘‘beautiful China” targets through 2035. The latter require fundamental improvements in air quality in China; in particular, they require all cities in China to achieve an annual concentration of PM2.5below 35 μg?m-3(the Interim Target-1 level recommended by the World Health Organization (WHO)) by 2035. To realize this goal, in-depth adjustment of the industrial structure and de-carbonization of energy systems will be critical, in addition to more stringent end-of-pipe control measures.
On the other hand,carbon intensity(measured by tonnes of CO2per unit of GDP) in China has declined dramatically since 1980,reflecting initial actions toward the improvement of energy efficiency and, more recently, the strategy for climate change mitigation. At the 2015 Paris Climate Conference (COP21), China pledged to reduce its carbon intensity by 60%-65% relative to the 2005 level, and to peak its carbon emissions by 2030 or earlier.Increasing clean and low-carbon energy sources plays a central role in China’s transition from relative to absolute carboneconomy decoupling by 2030. Efforts to reduce emissions of air pollutants and greenhouse gases (GHGs), particularly CO2, have become inevitably interlinked along this path. In 2015, the United Nations General Assembly (UNGA) proposed the Sustainable Development Goals(SDGs)for 2030[9],which emphasize a synergistic pathway with multiple benefits as an important means of coping with the complex challenges toward sustainability. Since 2012, the Chinese government has carried forward a national strategy of ecological civilization construction in order to decouple economic growth from ecological impacts and build a ‘‘beautiful China.”It is clear that both air pollution control and climate change mitigation play pivotal roles in this progress. This paper offers a comprehensive review of China’s continuous efforts to address the changing targets of air pollution control over the past 30 years.In order for China to address the emerging challenges of air pollution in the ecological civilization era, which include ozone(O3)-related issues and continuous reduction in PM2.5concentrations, an integrative pathway is necessary that fully considers the synergistic effects between air pollution control and climate change mitigation.
2. From acid rain to haze pollution: Central issues in ecological civilization
In the 1980s, acid rain became China’s first serious crossregional air pollution problem, as the extensive use of coal and other fossil fuels led to substantial emissions of SO2and NOx.These gaseous pollutants were oxidized and transformed in the atmosphere to form sulfuric and nitric acids,which could be transported over hundreds of kilometers,creating acid deposition on a regional scale [8]. In particular, in southern and southwestern China, the sulfur contents in coal were as high as 4% in some areas, and the acid-neutralizing effect of alkaline dust was much weaker than in northern China,resulting in the most severe acid deposition in the country [8]. Acid rain posed a severe threat to the environment,agricultural production, humans, and complex ecological systems(e.g.,ground vegetation and biodiversity).The societal costs of acid rain in China were estimated to be as high as 32 billion USD [8].
A significant negative correlation (Pearson’s r = -0.90) can be seen between the national average precipitation acidity (i.e.,average pH values) and total SO2emissions over the past 20 years(Fig.2[10]).The trough of average precipitation pH values and the peak of total SO2emissions both took place in 2006, when about one third of China’s total territory area was at risk of acid rain. In terms of bulk sulfur and nitrogen deposition, the severity of the acid rain in China in 2006,when acid rain was at its peak,was estimated in the same range(if not higher)as that in central Europe in the 1980s [8].
Chinese policymakers took a longer path to recognize issues with PM2.5pollution in comparison with their response to the acid rain issue. The landmark Harvard Six Cities Study for the eastern United States suggested that ambient fine particle exposures—and not exposures of coarse particle fractions—were specifically associated with daily mortality [11], leading to the first PM2.5NAAQS being established by the US Environmental Protection Agency (EPA) in 1997 [12]. Shortly after, researchers in China began to measure ambient PM2.5concentrations and analyze their chemical composition. A research group at Tsinghua University pioneered the continuous measurement of ambient PM2.5concentrations in Beijing in 1999, and reported annual average values of between 115 and 127 μg?m-3[13].As opposed to coarser particles,secondary aerosols (e.g., ammonium nitrate and sulfate, and organic aerosols) rather than primary ones were found to be responsible for the majority of PM2.5, suggesting that controlling dust emissions alone (which had been ongoing since 1970s) could not sufficiently reduce overall PM2.5concentrations.
High PM2.5concentrations, which are known as haze episodes,frequently hit many Chinese cities in winter, significantly deteriorating visibility and harming people’s health. However, PM2.5was not officially listed in China’s NAAQS until the amendment in 2012, when China adopted the WHO Interim Target-1 level(35 μg?m-3) as the annual mean limit for PM2.5concentrations.Since then, an official PM2.5monitoring network has been gradually established to diagnose more ground-level PM2.5concentrations, with hourly results available to the public. In 2013, 96% of the 74 key cities in China did not meet the NAAQS annual PM2.5concentrations. The most polluted cities were located in the Beijing-Tianjin-Hebei (BTH) region, where the annual averages were 2-3 times the limit. During a serious haze pollution episode in January 2013, hourly PM2.5concentrations were recorded as high as 800 μg?m-3[14].Image spectroradiometers onboard satellites provided the measurement of aerosol optical depth (AOD),which is used to characterize continuous trends in ground-level PM2.5.These satellite-based measurements confirmed that the BTH region faced the most serious PM2.5pollution within China, with significant deterioration during 2004-2007 [15].
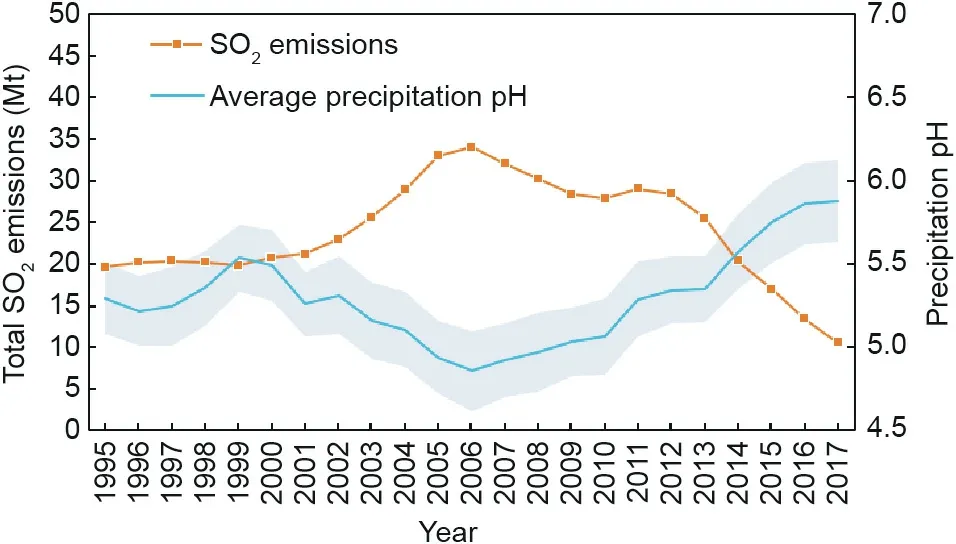
Fig.2. Trends in national average precipitation pH and total SO2 emissions between 1995 and 2017.Precipitation pH data were obtained from 74 sites with continuous observations in the Acid Rain Monitoring Networks[10];the blue belt indicates the interval within one standard deviation of the mean. Emission data for SO2 were derived from the MEIC model.
The Global Burden of Disease Study (GBD) 2015 identified ambient PM2.5exposure as a significant risk factor in the disease burden in China and as responsible for 1.1 million deaths in that year [16]. Based on the GBD project, the World Bank Group estimated that the premature mortality costs due to air pollution(including indoor exposure) were close to 10% of the GDP equivalent in 2013—significantly higher than those of developed countries in Europe and North America [17]. Undoubtedly, given the scale of the impacts of air pollution on public health,improvement of air quality has become a central domain in developing ecological civilization in China.
3.From emission control to air quality management: Key tasks in ecological civilization
With rapid societal development in China over the past 30 years,air quality management in China has been chasing shifting targets,starting with acid rain and NOxemissions, and now focusing on PM2.5pollution(Fig.3).Control actions on acid rain were primarily focused on SO2emissions from coal combustion in the 1990s.However, the increasing trend of SO2emissions was not reversed until 2007, when diversified technological and policy instruments were widely utilized. Such progress could not have been achieved without innovative improvement in political accountability,verification of SO2emissions, and financial incentives for power plants to install and operate flue gas desulfurization(FGD).NOxhas more sources than SO2,including coal burning,mobile sources,and other fossil fuel combustion sectors. Therefore, control actions on NOxemissions must be more extensive and complex, which requires cooperation among multiple sectors. Controlling PM2.5concentrations not only requires consistently mitigating multiple precursors from numerous sectors, but also demands consideration of complex influences from both meteorological and atmospheric chemistry conditions. Indeed, comprehensive control actions with multi-party coordination on provincial and even national levels have been implemented in China to minimize the adverse ecological and social impacts of PM2.5pollution. Since 2013,combating PM2.5pollution has marked a strategic transfer from emission control toward air quality management in China, which is oriented toward benefiting the public health and social welfare.The fundamental improvement of PM2.5concentrations has become a key indicator of the success of ecological civilization construction in China.
3.1. Decoupling SO2 emissions
The Law of the People’s Republic of China on the Prevention and Control of Atmospheric Pollution Air (short for Air Pollution Law,hereinafter)was formulated in 1987[18].In its first version,industrial hazardous gases,dust,and odor pollution were major focuses.Sulfur-containing gases were only regulated for a few industrial sectors, including refineries, ammonia production, coking, and non-ferrous metal metallurgy. In 1995, the Air Pollution Law was amended by adding a separate chapter on controlling air pollution,sourced from coal combustion,to tackle SO2emissions and the acid rain issue. The amendment in 1995 requested the designation of priority control zones for acid rain and SO2pollution (the Two Control Zones (TCZ) policy) [19]. Control zones for acid rain were designated for areas with high acidity of precipitation (pH ≤4.5),high sulfur deposition exceeding the critical load, and high SO2emissions. The designation of control zones for SO2pollution was based on the surpassing of ambient SO2concentrations according to NAAQS limits. The TCZ policy proposed by the State Environmental Protection Administration (SEPA), now the Ministry of Ecology and Environment (MEE), were approved by the State Council of the People’s Republic of China (State Council, hereinafter) as a nationwide plan. The plan designated 11.4% of the national territory(a total area of 1.09×10⁶km2)as control zones,set a target to cap the total emissions of SO2by 2010, limited the production and use of high-sulfur coal, and required the adoption of desulfurization units for newly built and renovated coal-fired power plants within the TCZ.
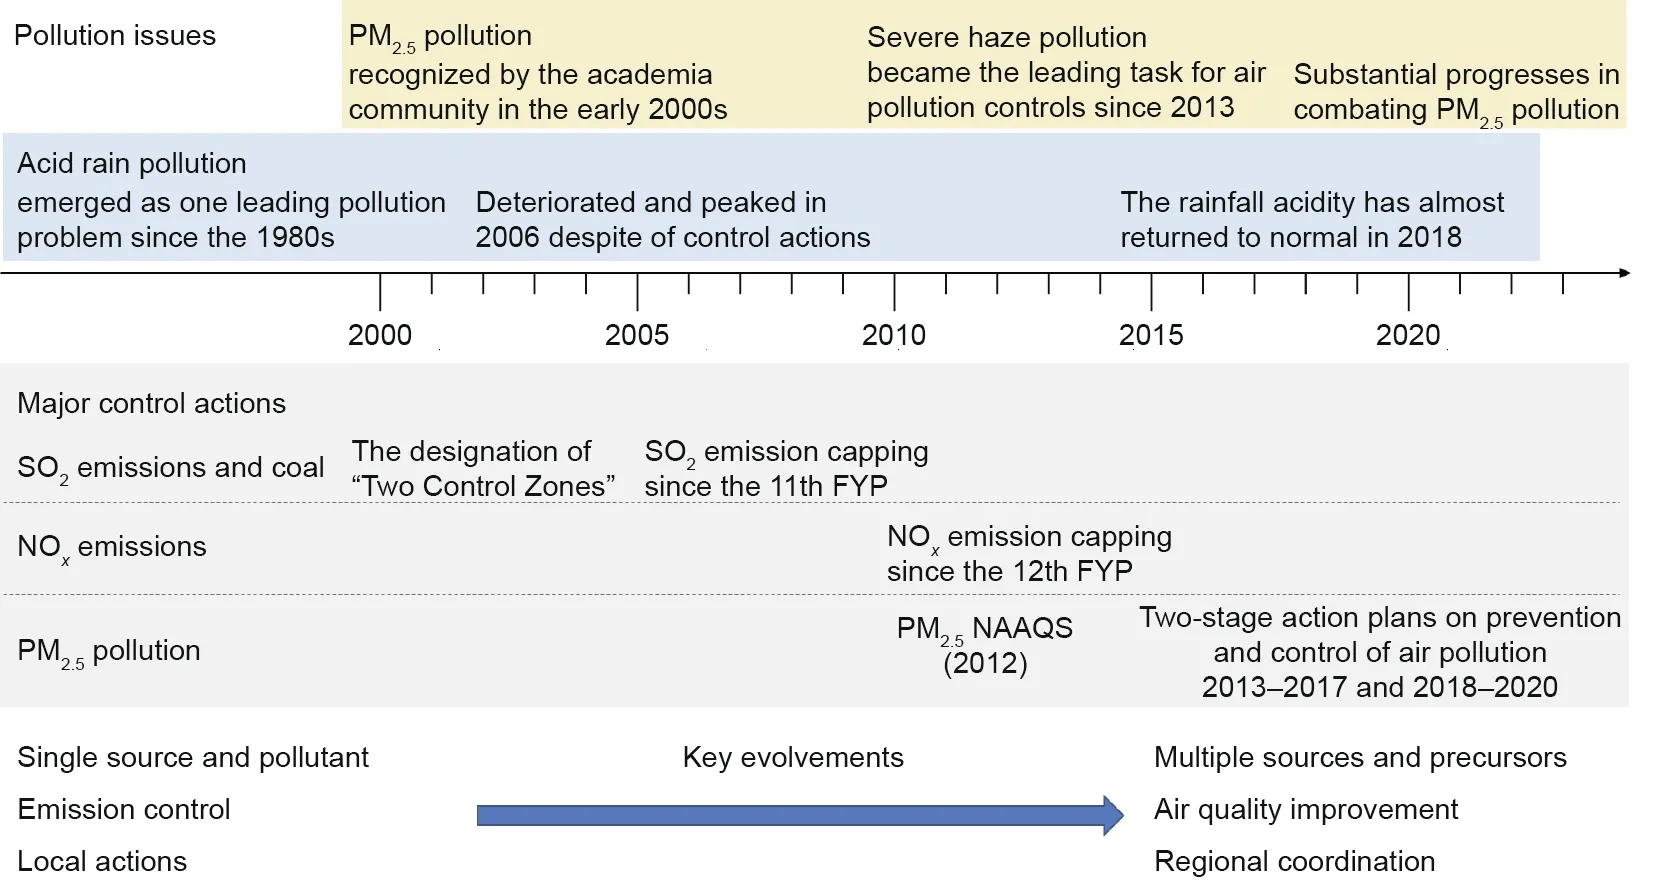
Fig. 3. Key milestones and policy evolution of air pollution control in China, including control actions on the emissions of SO2 and NOx and on ambient concentrations of PM2.5. FYP: Five-Year Plan.
Although installation of FGD systems was required by the 2000 amendment of the Air Pollution Law, the implementation was not well enforced[20].Consequently,the total SO2emissions increased by nearly 50% during 2002-2006, driven by a surge in coal consumption (Fig. 2), which worsened acid rain pollution nationwide[10]. This situation was improved during the 11th Five-Year Plan(FYP) (2006-2010), which set a concrete target to mitigate total SO2emissions by 10%. The 11th FYP was considered a milestone during which the air pollution control target became mandatory for provincial and municipal governments for the first time,enforced by the fact that local leaders could receive a sanction in cadre evaluation if they failed [21].
In addition to political accountability, verification of SO2emissions and financial incentives were utilized as measures to achieve reduction targets[20];for example,continuous emission monitoring systems(CEMSs)have been required at coal-fired power plants since 2007,in order to report the operational condition of FGD and supervise real-time SO2concentrations in the flue gas. Power plants with FGD operating properly (i.e., used in at least 90% of the electricity generated) have enjoyed a price premium of 0.015 CNY per kilowatt-hour. Otherwise, they are fined by an amount no less than the price premium. As a result, the adoption rate of FGD among thermal power plants increased from 14% in 2005 to 86% in 2010. SO2emissions from power generation, the largest anthropogenic source in China, decreased by 23% from 2005 to 2010, even though electricity generation increased by approximately 80% over the same period. Total SO2emissions in China decreased by 14%from 2005 to 2010 according to official statistics[22], representing the huge success of the 11th FYP in controlling SO2emissions. The results from satellite observations confirmed the same trend [23]. Acid rain issues were greatly mitigated [10].
3.2. Decoupling NOx emissions
On the other hand, regulations on NOxemissions in China have lagged in comparison with actions on SO2.The sources for NOxare distributed across multiple sectors involving high-temperature combustions, resulting in increased difficulty and higher costs for NOxemission mitigation.In addition to coal combustion processes,including thermal power and industrial plants, on-road vehicles and other fossil fuel combustion processes are important sources of NOxemissions. Total NOxemissions increased threefold during 1990-2010 (Fig. 1), as indicated by both bottom-up estimation and satellite observations[24].Many large cities have experienced rapid motorization since 2000, resulting in their urban nitrogen dioxide (NO2) concentrations exceeding NAAQS. Increasing trends in the ratios of nitrate (NO3-) to sulfate (SO42-) in both ambient PM2.5mass[25]and precipitation[10]have been observed in many regions of China. However, national mandates on controlling NOxemissions were not established until the 12th FYP (2011-2015).
Learning from the success of SO2emission control during the 11th FYP, the Chinese government set a similar mandatory target of reducing NOxemissions by 10% during the period of the 12th FYP. Thermal power plants, which were responsible for at least 30% of the national total emissions of NOx, were the main sector targeted by policymakers [26]. Many of the policy instruments and management practices adopted to control SO2emissions(e.g., CEMS) were tailored for the mitigation of NOxemissions. In 2010, coal-fired power plants relied heavily on low-NOxburners(LNB), a moderate technology designed to control NOxemissions,while the adoption rate of more advanced technology, such as selective catalytic reduction(SCR), accounted for only 12%.During the 12th FYP,China tightened the emission standards for coal-fired power plants and set a NOxlimit of 100 mg?m-3—the most stringent standard in the world at that time. The NOxlimit was further revised to 50 mg?m-3in 2015, which is known as the ultra-low emission standard [27]. As a result, more than 80% of thermal power plants installed SCR to control NOxemissions by 2015. The total NOxemissions decreased by 10.9% during the 12th FYP, which reversed the rapid increasing trend of emissions from the previous decade [28,29].
3.3. Decoupling PM2.5 concentration
The inclusion of PM2.5as a criteria pollutant in the 2012 amendment of NAAQS marked the strategic and philosophical evolvement of air pollution control in China.Ambient PM2.5concentration had become a more transparent indicator for city residents in China than other air pollutants, as the public began to gradually understand the relationship between PM2.5pollution,atmospheric visibility, and health impact. The major objectives of the Air Pollution Prevention and Control Action Plan 2013-2017 (Action Plan, hereinafter) launched by the State Council were to improve air quality and reduce heavy pollution days nationwide. Unlike the previous TCZ policy,which was proposed by the SEPA and then approved by the State Council, the formulation of the Action Plan was directly led and promoted by the State Council for the first time in the area of air pollution control. The higher level of authority for the Action Plan reflected the fact that combating PM2.5pollution would require more coordinated efforts at the national and regional levels than ever before. Three developed regions—the BTH,Yangtze River Delta(YRD),and Pearl River Delta(PRD)—had more stringent targets: to reduce average PM2.5concentrations by 25%, 20%, and 15%, respectively, during 2013-2017. Although variation in the meteorological conditions from 2013 to 2017 slightly favored reducing PM2.5concentrations in the BTH region,emission reductions were the dominating factor for the decline of ambient PM2.5concentration and the associated health benefits [30]. Beijing set a goal that the annual average concentration in 2017 should be below 60 μg?m-3,which required a reduction within five years that was greater than 30%of the 2013 level (89 μg?m-3).
Fig. 4 summarizes the major action plans for PM2.5control implemented by the Chinese government since 2013. The policy framework shows a clear trend of gradually involving more categories of PM2.5precursors and emission sectors, since traditional control actions for a single pollutant or a single sector were insufficient to deliver substantial reductions in PM2.5concentrations as required by the Action Plan.One notable case is that the estimated SO2emissions and sulfate concentrations inversed from satellite observations both rebounded slightly during 2010-2011 due to a rapid increase in industrial activities and less stringent controls on the iron and steel industries (Fig. 2), which surpassed the reduction benefits of SO2controls on power plants[31].As a result,a series of stringent control measures have been implemented in the industrial polluting sector, including strengthening industrial emissions standards, phasing out small-scale high-polluting factories,phasing out outdated industrial capacities,and upgrading industrial boilers [32]. Compared with the control measures for other precursors (e.g., SO2and NOx), the controls on volatile organic compounds (VOCs) and NH3emissions before 2013 were considered to be inadequate in China[33].A response surface modeling (RSM) study of the nonlinear response of PM2.5to precursor emissions in the most polluted BTH region suggested that PM2.5concentrations are primarily sensitive to the emissions of NH3and organic compounds (e.g., non-methane volatile organic compounds (NMVOCs), intermediate volatility organic compounds(IVOCs),and primary organic aerosols(POAs))[34].National emissions of NMVOCs had to be reduced by at least 36%from the 2012 level by 2030 in order to meet the PM2.5NAAQS [35]. Therefore, a comprehensive VOC control program was launched in 2015,targeting the petrochemical industry, organic chemical industry,surface coating industry, and packaging and printing industry.The RSM technique also quantified that the rapid increase in NH3emissions during 1990-2005 resulted in increases of 50%-60% in sulfate and nitrate aerosol concentrations [36,37]. Nitrate aerosol has become the leading component in PM2.5concentrations in the BTH region, and dominates severe haze events [38,39]. One important cause is that,now that ambient SO2concentrations have been successfully reduced, ammonia-rich and high-humidity conditions more significantly favor the partitioning of nitrate toward the particle phase [39,40]. Consequently, the central government has recognized the importance of ammonia emission controls and has focused on the agriculture sector (e.g., crop farming and aquaculture)in the following Three-Year Action Plan(2018-2020).
As Fig. 4 indicates, control actions have been implemented nationwide,with additional efforts in several key regions.Improving air quality and mitigating PM2.5pollution in core megacities(e.g., Beijing and Shanghai) have been attained due to increased attention from the central government and the public.Beijing provides a success story in tackling PM2.5pollution after two-decadelong efforts. In fact, the implementation of comprehensive air pollution controls in Beijing was initiated as early as the 1990s.During the 2008 Olympic Games,extensive control measures were implemented in Beijing and surrounding provinces to guarantee good air quality [41]. Ambient concentrations of CO, SO2, PM10,and NO2continuously decreased, even as the municipal GDP, resident population, vehicle stock, and energy consumption increased significantly from 1998 to 2013. Owing to the success of air pollution controls for the 2008 Olympic Games, the local leaders recognized that ambient PM2.5concentrations resulted from a combination of emissions, meteorological conditions, and atmospheric chemistry. Furthermore, PM2.5pollution would not have been successfully controlled without coordinated efforts from surrounding provinces. Thus, the government experienced valuable learning regarding the source apportionment of PM2.5pollutions. The results from an analysis of one-year continuous monitoring data indicated that local sources were actually responsible for about two thirds of PM2.5mass concentrations in Beijing for 2013. Among local contributors, mobile sources (primarily on-road vehicles) were estimated to play a leading role (31%), followed by coal combustion (22%), industrial production (18%), and dust (15%) [42].
Prior to 2013, control measures focused on large-capacity coal-fired power plants and urban coal combustion. Since 2013,urban and rural households in Beijing have been provided with more subsidies to expedite the replacement of coal with electricity or natural gas. Households that choose coal-to-electricity heating renovation can receive subsidies equivalent to two thirds of the equipment acquisition costs and are eligible for a discount of up to 78%off the heating electricity bill[43].As of 2017,the majority of Beijing households have become coal-free except for some in remote rural areas. As a direct result of coal elimination, the current annual SO2concentration is now below 10 μg?m-3in Beijing,indicating a reduction of over 90%in the past two decades.Further efforts are now being made to transform Beijing into a coal-free city.
Beijing also pioneered in controlling vehicle emissions in China.The formulation and enforcement of local standards for vehicle emissions and fuel quality in Beijing are essentially one step ahead of national requirements[44].Advanced on-road monitoring techniques—particularly remote sensing and portable emission measurement systems—have been adopted to improve in-use compliance, and sustainable transportation systems have been promoted through substantial incentives and traffic management[43].Urban residents are embracing more sustainable travel modes than ever,as bicycles,subway,and ground bus are now responsible for more than 60% of total trips in Beijing. New energy vehicles—mostly battery electric vehicles—accounted for nearly 3% of the total vehicle population by 2017.
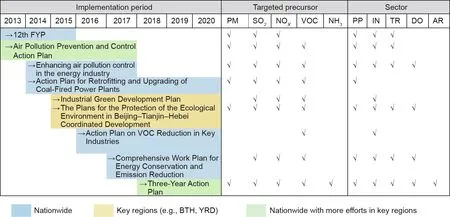
Fig. 4. Summary of the major control regulations in China since 2013. PP: power plants; IN: industry; TR: transport; DO: domestic sector; AR: agriculture.
Total emissions of major precursors in Beijing and the surrounding region are estimated to have decreased more rapidly during 2013-2017 than ever before.Emissions in Beijing have been reduced by 83% for SO2, 43% for NOx, 42% for VOCs, and 59% for primary PM2.5. Comprehensive air quality modeling results have confirmed that emission mitigation was the primary cause of the significant progress in alleviating PM2.5pollution from 89 μg?m-3in 2013 to 58 μg?m-3in 2017[45](and 42 μg?m-3in 2019).Among control measures, the renovation of coal boilers together with the promotion of cleaner residential fuels are estimated to have reduced PM2.5concentrations by more than 10 μg?m-3. Emission controls on local vehicles have also effectively mitigated NOxemissions,and account for a reduction of 2 μg?m-3in PM2.5concentration [43].
Guided by the Action Plan, many other cities in China are following Beijing to reduce ambient PM2.5concentrations (Fig. 5).The strategic promotion of ecological civilization has spurred stronger willingness, clearer targets, more supportive legislation and incentives, and more stringent implementation of control actions from central to local governments. All these factors work together with public engagement to achieve progress in controlling PM2.5pollution and improving public health and welfare. During the Action Plan 2013-2017, PM2.5concentrations deceased by 23% on average for all the municipal cities in China [46] (Fig. 5).Reductions for the three key regions were even more significant:40% for BTH, 34% for YRD, and 28% for PRD. The average PM2.5concentration in the PRD region was 34 μg?m-3, which adhered to NAAQS for PM2.5. This progress has motivated some local governments to actively target more stringent limits on PM2.5(e.g.,the WHO Interim Target-2 level of 25 μg?m-3)and to resolve other pressing issues such as O3pollution.
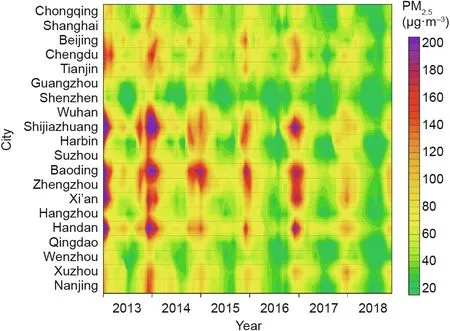
Fig.5. Trend of annual average PM2.5 concentrations for the top 20 most populated cities in China from 2013 to 2018. Observed PM2.5 concentrations were obtained from the China National Environmental Monitoring Center.
4. Emerging O3 challenges in ecological civilization construction
Despite the substantial progress that has been made in addressing acid rain and PM2.5issues (Fig. 6(a)), an unwanted increase in ground-level O3pollution is still found in many regions across China,posing the more complex challenge of simultaneous continuous mitigation of PM2.5pollution with an emerging O3issue. As O3pollution has been steadily increasing in most parts of eastern China [47-50], O3issues have recently gained more attention among both the public and academia in China. As illustrated in Fig. 6(b), the average 90th percentiles in daily maximum 8 h O3concentrations increased by 20.1% and 24.5% in 74 key cities and BTH,respectively, from 2013 to 2017.Furthermore,densely populated regions of eastern China were exposed to high O3pollution,increasing the impacts of O3on human health. The results of the GBD project [51] estimated that respiratory mortality attributable to long-term O3exposure in adults is between 274 000 and 316 000 in China, equal to approximately 25%-29% of the deaths attributable to PM2.5exposure [16]. It is necessary to integrate O3and PM2.5controls to ensure a pollution-free and healthy living environment in the development of ecological civilization in China.
The biggest challenge of O3pollution control is rooted in the complexity of atmospheric photochemistry formation, which depends on O3-NOx-VOC sensitivity diagnosis and meteorological conditions[52,53].A control strategy designed to reduce emissions of NOxor VOCs for PM2.5control may result in an unexpected disadvantage for O3reduction.Strong VOC-limiting systems are found in most urban areas of China[54,55],and O3in urban areas can be enhanced if few or no VOCs are controlled simultaneously with NOx[56]. For example, during the Action Plan from 2013 to 2017,anthropogenic emissions of NOxwere reduced by 21% but VOCs increased by 2% nationwide [57]. Such combinational changes in NOx-VOC emissions might be beneficial for reducing PM2.5but not for O3, as shown by the decreased PM2.5concentrations and increased O3concentrations during the same period (Fig. 6). It is notable that the increase in O3concentration during the Action Plan period is also attributable to variation in meteorological conditions—specifically, changing temperature and short-wave radiation.Therefore,full consideration of meteorology and optimal mitigation of precursor emissions are critical in designing an effective O3control strategy.
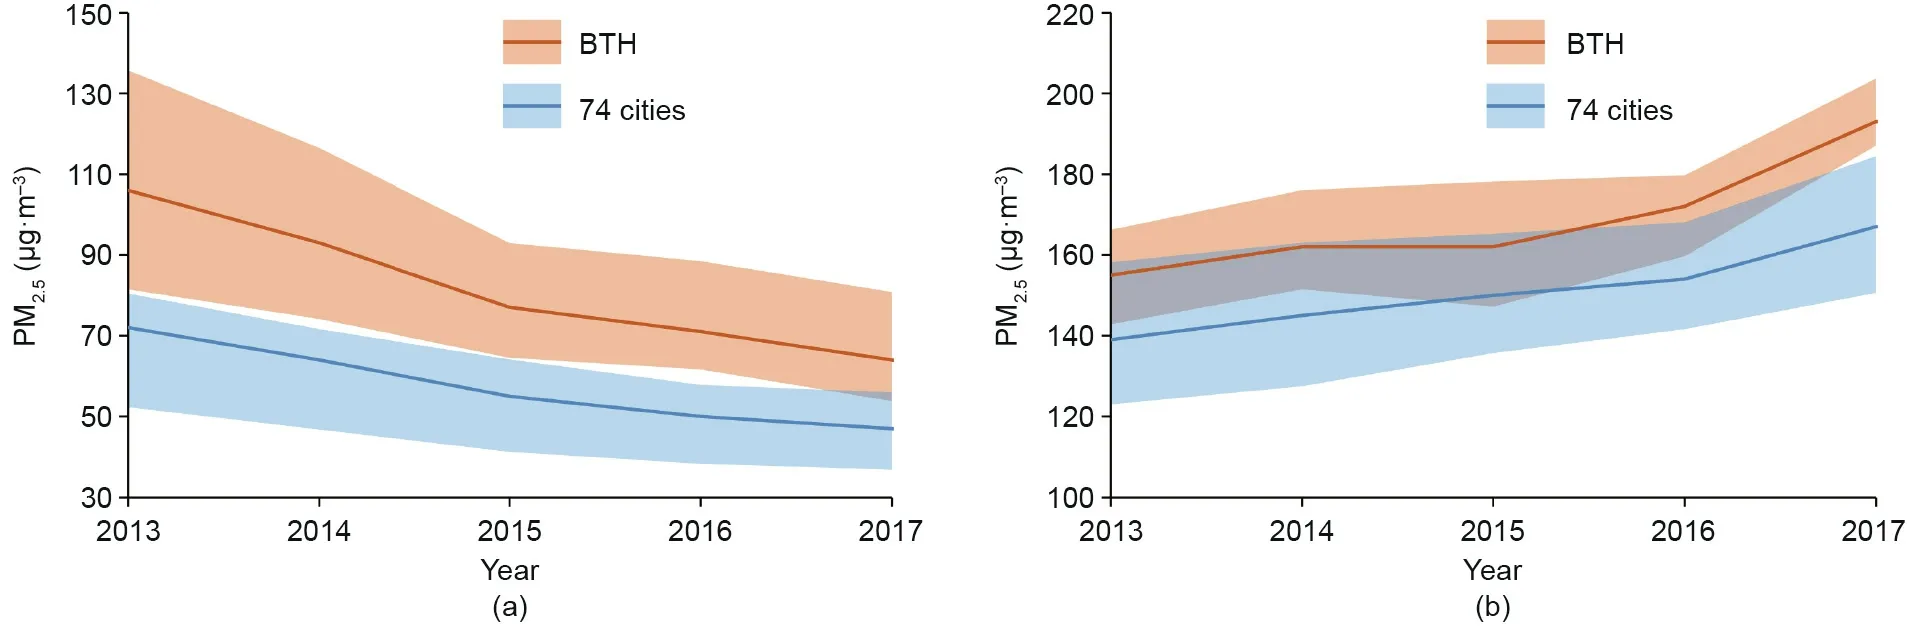
Fig. 6. (a) Trends in observed annual PM2.5 concentrations for BTH and 74 key cities between 2013 and 2017; (b) trends expressed as 90th percentiles in maximum daily average 8 h O3 concentration.Shaded areas represent the 25th-75th percentile range.Data are available in Table S1 in Appendix A.Details on monthly PM2.5 concentration for 74 key cities are summarized in Tables S2-S6.PM2.5 and O3 concentrations in the BTH region and 74 cities were obtained from the China National Environmental Monitoring Center.
In addition, O3pollution can be intensified by PM2.5mitigation through the reaction pathway affecting the termination of O3formation chemistry. Reduced particle surfaces, where the heterogeneous reactions involving atmospheric oxidants occur, may lead to termination reactions of some O3-consuming radicals (e.g.,N2O5and HO2)[58,59].The reduced PM2.5suppresses the termination reactions of those radicals,thus enhancing the photochemical reactions and O3concentrations. Li et al. [60] found that the suppressed aerosol sink of hydroperoxyl (HO2) radicals, due to the decrease of PM2.5over the 2013-2017 period, was an important factor in the increase of O3in the North China Plain.
Another complexity comes from the influence of the aerosol radiative effect (ADE) on O3formation. It is well known that the ADE induces a reduction in solar radiation that leads to lower photolysis rates and less O3production [61]. Thus, it is expected that substantial PM2.5reductions might lead to a potential risk of rising O3levels [54,62,63]. Furthermore, the ADE can change vertical temperature profiles and corresponding atmospheric stability,atmospheric ventilation, cloud cover, and rainfall, which may also influence O3concentrations. The mechanism of meteorological influences on O3exhibits strong seasonality,which is more complicated than the direct impacts from ADE on radiation [64-68]. A previous study suggested that O3would increase by up to 2%-3%in eastern China due to an ADE-induced rise in precursor concentrations,stemming from the stabilization of the atmosphere,which is associated with reduced planetary boundary layer height and ventilation [68].
In conjunction with strengthened PM2.5controls, O3pollution could be more challenging in future. It is important to consider the O3response to the PM2.5control policy, and to achieve optimum benefit for human health and ecological civilization.The control strategy should focus on common precursors (i.e.,NOxand NMVOCs) for both O3and PM2.5; in particular, it should implement simultaneous NMVOC controls with NOxcontrols under VOC-limited conditions, such as in urban areas and during winter time. The challenge is that the control of NOxand VOCs is usually more difficult and expensive than that of other pollutants. Development of cost-effective control technologies can largely facilitate the control process. Many studies have found that regional emission sources have much more influence on O3concentration than local sources[53,69],suggesting that more intensive regional joint controls are necessary.
5. Synergy between climate mitigation and air pollution control: A win-win opportunity in the ecological civilization era
Significant co-benefits exist from air pollution control and mitigation of GHG emissions in China, as both air pollutants and GHGs are generally emitted from the same sources, such as the combustion of fossil fuels—particularly coal [70]. In 2013, coal combustion was responsible for 8 Gt or 81%of total CO2emissions in China, and contributed 35%-46% (i.e., 18-28 μg?m-3) of total PM2.5concentrations nationwide [71]. Over the past decades, the energy efficiency promoted from a series of FYPs in China has resulted in evident savings in coal consumption and thus reductions in both air pollution and carbon emissions.In northern China,household heating has undergone coal-to-clean fuel transitions since 2013, which are regarded as a necessary means to tackle the heavy PM2.5pollution in winter [43]. Measures to control coal consumption with a priority on reducing air pollutants also reduce CO2emissions simultaneously. As promoted in the Action Plan 2013-2017, options such as restricting the use of fossil fuels with high emission factors, promoting zero-emission vehicles, and renewable energy have all led to an important reduction in both air pollutants and GHGs [72-74].
In the short and medium term, air pollution controls are expected to act as a leading driver in the synergistic path for realization of these co-benefits. The Three-Year Action Plan for winning the ‘‘blue sky defense battle” (2018-2020) explicitly emphasizes the co-benefits between air pollution control and climate change mitigation.In particular,it introduces more stringent measures to limit coal use and encourage clean transportation in China, which will be clearly beneficial for reducing CO2emissions in the related sectors. In addition, the 2035 ‘‘beautiful China”targets for air quality (e.g., to decrease annual PM2.5to below 35 μg?m-3) are expected to impose stricter requirements for de-carbonization of the energy system in China in comparison with the climate targets that were committed to in China’s Nationally Determined Contributions (NDCs) [75]. In the long term, the WHO air quality guidelines (AQGs) are considered to be the ultimate objective for air quality improvements in China during the process of developing ecological civilization through 2050.
At the same time,realizing the global 1.5°C/2°C climate target will require China to significantly reduce its GHG emissions by 2050 and beyond, as indicated in a large body of scenario analysis[76-78]. Thus, both climate mitigation and air pollution control will become increasingly challenging in the long term. It is clear that a dynamic understanding of the synergistic effects between air pollution control and climate mitigation in China at different stages is critical for the country to follow a cost-effective pathway toward sustainable development and ecological civilization.
Air quality and climate systems can enhance each other through a number of positive feedback loops. Global climate change may weaken the strength of Asian monsoons,resulting in frequent heat waves and episodes of stagnant air, and leading to increasing O3and PM2.5concentrations and high pollution episodes [79,80]. In addition, the increase of tropospheric O3together with the reduction of stratospheric O3will likely increase surface and low-level atmospheric temperatures,which will in turn exacerbate O3pollution,creating a vicious circle[81-84].Mitigation of climate change benefits air quality improvement in this sense,and vice versa.It is true that the operation of control equipment for air pollutants will consume additional energy, which—if the energy is fossil based—will lead to a marginal increase in GHG emissions[85-87].Furthermore, some mitigation efforts on aerosols such as sulfates for the purpose of reducing acid rain and PM2.5pollution might escalate warming effects [88-93], as they act as cooling radiative forcing in the climate system. Given the existing significant reduction in SO2emissions in China, the warming effects due to further reduction in sulfate aerosols are expected to be limited in the future.It is clear that the co-benefits largely exceed the tradeoffs between air pollution control and GHG mitigation, in the case of China.
6. Conclusions and implications
This paper reviews the three-decade progress that has been made in air pollution control in China, highlighting a strategic transformation from emission control toward air quality management. In the early stage (starting in the 1980s), acid rain was the prominent cross-regional air pollution problem in China. Substantial control measures on SO2emissions from coal combustion sectors—particularly the SO2emission capping policy since the 11th FYP—resolved the deterioration of the acid rain issue around 2007. The 2012 NAAQS amendment introduced PM2.5as a newly added criteria pollutant, marking a transition to an air-qualityoriented strategy.Emission controls for a single pollutant or a single sector are inadequate to meet the stringent target of PM2.5concentration reduction. China has implemented a series of control action plans,which have been redesigned to mitigate multiple precursors from multiple sectors through extensive coordination at the regional or national level. During the Action Plan 2013-2017,many cities effectively decoupled PM2.5concentrations and socioeconomic development. PM2.5concentrations deceased by an average of 23% during this period for all municipal cities in China. Beijing has set a successful example as a pioneer in energy transition and transportation emission controls, and has achieved significant progress in mitigating PM2.5pollution from 89 μg?m-3in 2013 to 58 μg?m-3in 2017.
Despite these achievements in air quality management,China is facing both challenges and opportunities to realize‘‘beautiful China”targets and to absolutely decouple emissions of CO2and air pollutants from economic growth in the ecological civilization era.On the one hand, O3pollution is emerging and could be more challenging in future. On the other hand, the coupling of climate mitigation and air pollution control exhibits significant co-benefits that can lead to a win-win opportunity.An integrated management framework linking energy, environment, health, and climate units should be established for the synergistic mitigation of PM2.5, O3,and GHGs. Such a framework is expected to consist of three core components: a precise and dynamic system to reproduce the condition of the regional and global atmospheric environment; a coordinated and highly efficient treatment system to simultaneously mitigate the emissions of air pollutants and GHGs; and a comprehensive decision-supporting platform to form a synergistic mitigation pathway and optimal technical combination.Ultimately,a multi-objective and multi-benefit roadmap is required in order for China to attain air quality standards domestically and to fulfill international agreements concerning GHGs,and so forth.
Acknowledgements
This work is supported by the National Key Research Development Program of China (2016YFC0208901 and 2017YFC0212100),and the National Natural Science Foundation of China (71722003 and 71690244). Dr. Shuxiao Wang acknowledges support from the Samsung Advanced Institute of Technology and the Tencent Foundation through the XPLORER PRIZE.
Compliance with ethics guidelines
Xi Lu,Shaojun Zhang,Jia Xing,Yunjie Wang,Wenhui Chen,Dian Ding,Ye Wu,Shuxiao Wang,Lei Duan,and Jiming Hao declare that they have no conflict of interest or financial conflicts to disclose.
Appendix A. Supplementary data
Supplementary data to this article can be found online at https://doi.org/10.1016/j.eng.2020.03.014.

- Engineering的其它文章
- Near-Zero Air Pollutant Emission Technologies and Applications for Clean Coal-Fired Power
- Hydrogen Power Focus Shifts from Cars to Heavy Vehicles
- Moisture Absorption and Desorption in an Ionomer-Based Encapsulant:A Type of Self-Breathing Encapsulant for CIGS Thin-Film PV Modules
- Deciphering the Origins of P1-Induced Power Losses in Cu(Inx,Ga1-x)Se2(CIGS) Modules Through Hyperspectral Luminescence
- Dedication to Clean Power and Promotion of the Energy Revolution
- Preparation of Nanoporous Carbonaceous Promoters for Enhanced CO2 Absorption in Tertiary Amines