
Regime shift in Lake Dianchi (China) during the last 50 years*
2018-08-02 02:50:36WANGYingcai王英才WANGWeibo王偉波WANGZhi王智LIGenbao李根保LIUYongding劉永定
關(guān)鍵詞:英才
WANG Yingcai (王英才) WANG Weibo (王偉波) WANG Zhi (王智) LI Genbao (李根保) LIU Yongding (劉永定)
1 Yangtze Valley Water Environment Monitoring Center, Wuhan 430010, China
2 Institute of Hydrobiology, Chinese Academy of Sciences, Wuhan 430072, China
3 Laboratory of Aquatic Botany and Watershed Ecology, Wuhan Botanical Garden, Chinese Academy of Sciences, Wuhan 430074, China
4 Institute of Geodesy and Geophysics, Chinese Academy of Sciences, Wuhan 430077, China
Abstract Lake Dianchi has undergone accelerated alternations resulting from human activities during the last 50 years, and provides an exceptional example for the study of regime shift in a shallow lake.Focusing on regime shift, we systematically studied and analysed alternations of key components of its ecosystem, including water parameters, phytoplankton and zooplankton biomass, macrophyte composition and fish populations. We found that the shifting course of Lake Dianchi went through three major phases,corresponding to three distinct states: Phase I clean, stable state during the 1950s; Phase II transitional state during the 1970s–1980s; and phase III stable, turbid state since 1993. We analysed all data and samples, identifying the threshold concentrations at which regime shift occurred: total nitrogen (TN) and phosphorus (TP) reaching 1.2 mg/L and 0.13 mg/L, respectively. Results from this study strongly suggest that the increasing input of external nutrients, reclaiming land from the lake and foreign fish invasion were major inducements to the accelerated shift of Lake Dianchi to its turbid, stable state. These findings provide valuable guidelines for potential efforts to reverse this unnatural process in Lake Dianchi. The restoration may need to: (1) thoroughly and accurately identify pollution sources to control and reduce excessive external nutrients flowing into the lake; (2) return reclaimed land to the lake and recover the littoral zone to its natural state to facilitate increased restoration of macrophytes; and (3) strategically adjust fish populations by reducing benthivorous and filter-feeding fish populations that prey on zooplankton,while enlarging zooplankton populations to control phytoplankton biomass.
Keyword: regime shift; Lake Dianchi; eutrophication; alternative state; driving force; ecosystem
1 INTRODUCTION
Regime shifts can be de fined as abrupt changes on several trophic levels (Lees et al., 2006) leading to rapid ecosystem recon figuration between alternative states (Andersen et al., 2009). This notion was initially abstracted from a sudden change occurring in an ecosystem, as described for the concurrent alternations between sardines and anchovies (Lluch-Belda et al.,1989) and outbreaks of spruce budworm in eastern Canada (Holling, 1988). The term “regime shift” was mainly used in marine ecology, describing a commercially important fish species in the North Paci fic (Collie et al., 2004), but was gradually adopted by researchers into freshwater ecosystems. The study of regime shifts quickly attracted increasing attention and effort, re flected in 12-fold more scienti fic publications during 1991 and 2006, and a doubling of research efforts in ecology (Andersen et al., 2009).
A natural lake has two distinct stable states: clean and turbid (Jeppesen et al., 1999). The clean state is often characterized by dominance of submerged macrophytes, a high piscivorous:planktivorous fish ratio, a high zooplankton:phytoplankton ratio and low phytoplankton biomass usually dominated by flagellates or Chrysophyta. In contrast, the turbid state is characterized by dominance of phytoplankton,a low piscivorous:planktivorous fish ratio, a low zooplankton:phytoplankton ratio and often high resuspension (Schriver et al., 1995; Jeppesen et al.,1999). Under natural conditions, most shallow lakes are in a clean state. However, man-made eutrophication changes this situation and induces a sharp decrease in water transparency and rapid disappearance of vegetation in shallow lakes (Scheffer et al., 1993;Hein, 2006). A natural lake can remain in a clean,stable state until a critical threshold for ecosystem resilience and time lags has been crossed. Once the threshold has passed, the lake’s biodiversity decreases;algal biomass and turbidity increase; and there may even be formation of water blooms, indicating an abrupt switch from a clear state to a turbid state(Scheffer et al., 2001).
Several methods can be used to study regime shift occurrence in lake ecosystems. One popularly used method is comparing limnology. This method uses space heterogeneity to replace succession of time series, providing that different lakes represent different states at one time instead of a lake at different states in different times. Data from field investigation of many lakes are collected and subjected to statistical analyses through regime shift detection, singular spectrum analysis or structural change detection to determine regime shift occurrence (Andersen et al.,2009). Using this method, Jeppesen et al. (1990)investigated about 200 shallow Danish lakes for comparative study and pointed out that the shift from a clear state to a turbid state occurred when total phosphate (TP) exceeded 0.05–0.15 mg/L. Wang(2007) conducted field investigations of 46 small to medium-sized lakes along the mid-lower Changjiang(Yangtze) River in China, concluding that the regime shift occurred when TP concentrations were between 0.07 mg/L and 0.10 mg/L, and suggesting this phosphorous concentration as the threshold in retaining a clean state.
Several other popularly used methods for regime shift study include experimental limnology, modelling analysis and palaeolimnology. Experimental limnology is a method that constructs a controlled ecosystem to induce the regime shift by arti ficial manipulation. It shortens the regime shift process and provides a complete course for study. Sagrario et al.(2005) and Wang et al. (2009) reported successful cases where the shift between clean state and turbid state were promoted through modulating nutrient concentrations or exerting biomanipulation in enclosure experiments or ecosystems. Scheffer (1990)used minimal models to evaluate the relationships of several different ecological components, and their function, on the existence of alternative equilibriums over a certain range of nutrient values in freshwater systems. Srinivasu (2004) used a mathematical model to study the regime shifts in eutrophic lakes and explained the cyclic behaviour observed during the management of lakes. Palaeolimnology is a method that establishes diatom-based TP transfer function to reconstruct original environments, since diatoms are ecologically sensitive to water environmental changes and they do not easily decay in the sediment after death. To date, several regional diatom-based weighted averaging TP models have been constructed for shallow lakes in southeast England, Sweden,Northern Ireland, northeastern Germany and the Changjiang floodplain in China (Anderson et al.,1993; Bennion, 1994; Bradshaw and Anderson, 2001;Sch?nfelder et al., 2002; Yang et al., 2008).
However, all the individual methods described above have limitations for extended application due to heterogeneity between major lakes; inconsistency between the controlled ecosystems or non-objective models and a natural lake; or the incomparability of isolated historical information to current ecosystem composition. They are not equal to a case study that completely covers the whole course of regime shift of a natural lake. A natural lake usually takes dozens of years, at least, to go through a complete regime shift;thus, accessing decades of data collection is extremely challenging. In this paper we present a thorough data collection and study of a natural lake, Lake Dianchi,over a period of 50 years when it has been considerably in fluenced by human activities. The data collected over the past five decades included water parameters,phytoplankton, zooplankton, fish and macrophytes,and these enabled us to evaluate a natural lake, one that is an exceptional model for regime shift occurrence from a clean, stable state, through an alternative state to a turbid, stable state.
2 MATERIAL AND METHOD
Lake Dianchi is an ancient tectonic lake in the centre of the Yunnan-Guizhou Plateau in southwest China. The regional climate is subtropical (humid monsoon type), with an annual mean temperature of about 15℃ and an annual mean precipitation of about 1 000 mm (Nanjing Institute of Geography and Limnology, 1989). It is the sixth largest freshwater lake in China and its catchments measure 2 920 km2(Feng, 1994), including Kunming (the capital of Yunnan Province), and Songming, Chenggong,Jianning and Xishan counties. The lake is divided into two parts by an arti ficial dam (Fig.1): the northern,inner part, known as Caohai, has a surface area of 7.5 km2and an average depth of 2.5 m; the southern,outer part is known as Waihai and has a surface area of 292 km2and an average depth of 4.4 m. Waihai accounts for 99% of the total volume (1.29 billion m3), and was the focus of our study.
Scienti fic data on Lake Dianchi before 2005 are available from 23 published data sets and reports(Cheng, 1958; Ley et al., 1963; He et al., 1980; Li,1980, 1985; Qu, 1983; Dai, 1985, 1986; He and Liu,1985;Wang, 1985; Chu and Chen, 1989a, b; Gao et al., 1990; Yang et al., 1994; Jin et al, 1995;Yang et al.,2010; Yu et al., 2000; Chen et al., 2001; Zhe, 2002,C1994; Luo et al., 2006; Mo et al., 2007; Zhang,2007). Our study continued from 2006 when we chose 22 sampling locations throughout the Waihai part of the lake (Fig.1). From 2008 we focused on 12 sampling stations (see solid stars in Fig.1) from our original 22 stations and continued our investigation.Water and biological samples (including phytoplankton and zooplankton) were collected 3–4 times annually at a depth of 0.5 m below the water surface. Macrophytes were collected once, in 2008.
2.1 Sample analyses
Dissolved oxygen, temperature and pH were measured using YSI 550A and YSI 63 (YSI Incorporated, OH 45387, USA). Transparency was measured using a Secchi disc (Cole Palmer, IL 60061,USA). TP was analysed by colorimetry after digestion of the total samples with K2S2O8+NaOH to orthophosphate (Ebina et al., 1983); total nitrogen(TN) was obtained from samples digested to nitrates,and their absorbance was measured at 220 nm and 275 nm. Chemical oxygen demand (CODMn) was measured using the titrimetric method after reaction with KMnO4in boiling water under acid conditions for 30 min. Chlorophyll- a (chl- a) samples were filtered onto Whatman GF/F- filters (Whatman-GE Healthcare Life Sciences, NJ 08854, USA). The filters were then air-dried, stored frozen, extracted in ethanol and measured by spectrophotometry as described previously (Vuorio et al., 2005). Samples of phytoplankton and protozoa samples were fixed with Lugol’s solution and concentrated to 30 mL from 1 000 mL after 48 h sedimentation; then 0.1 mL of the concentrated samples was counted through an inverted microscope (Leica DM2000) at 400×magni fication. Phytoplankton species were identi fied and counted as described by Hu and Wei (2006).Macrocrustacean samples were filtrated, condensed to 30 mL from 10 000 mL using a plankton net (64 μm mesh), then fixed with 5% formaldehyde solution and counted under an inverted microscope. Submerged macrophytes were investigated using a Pick-grass machine with an area of 0.168 m2. Macrophyte samples were collected stochastically from n=10 spots each time at every station with vegetation, then weighed and identi fied.

Fig.1 Sampling stations in Lake Dianchi
3 RESULT
3.1 Key water parameters of Lake Dianchi in the last 50 years
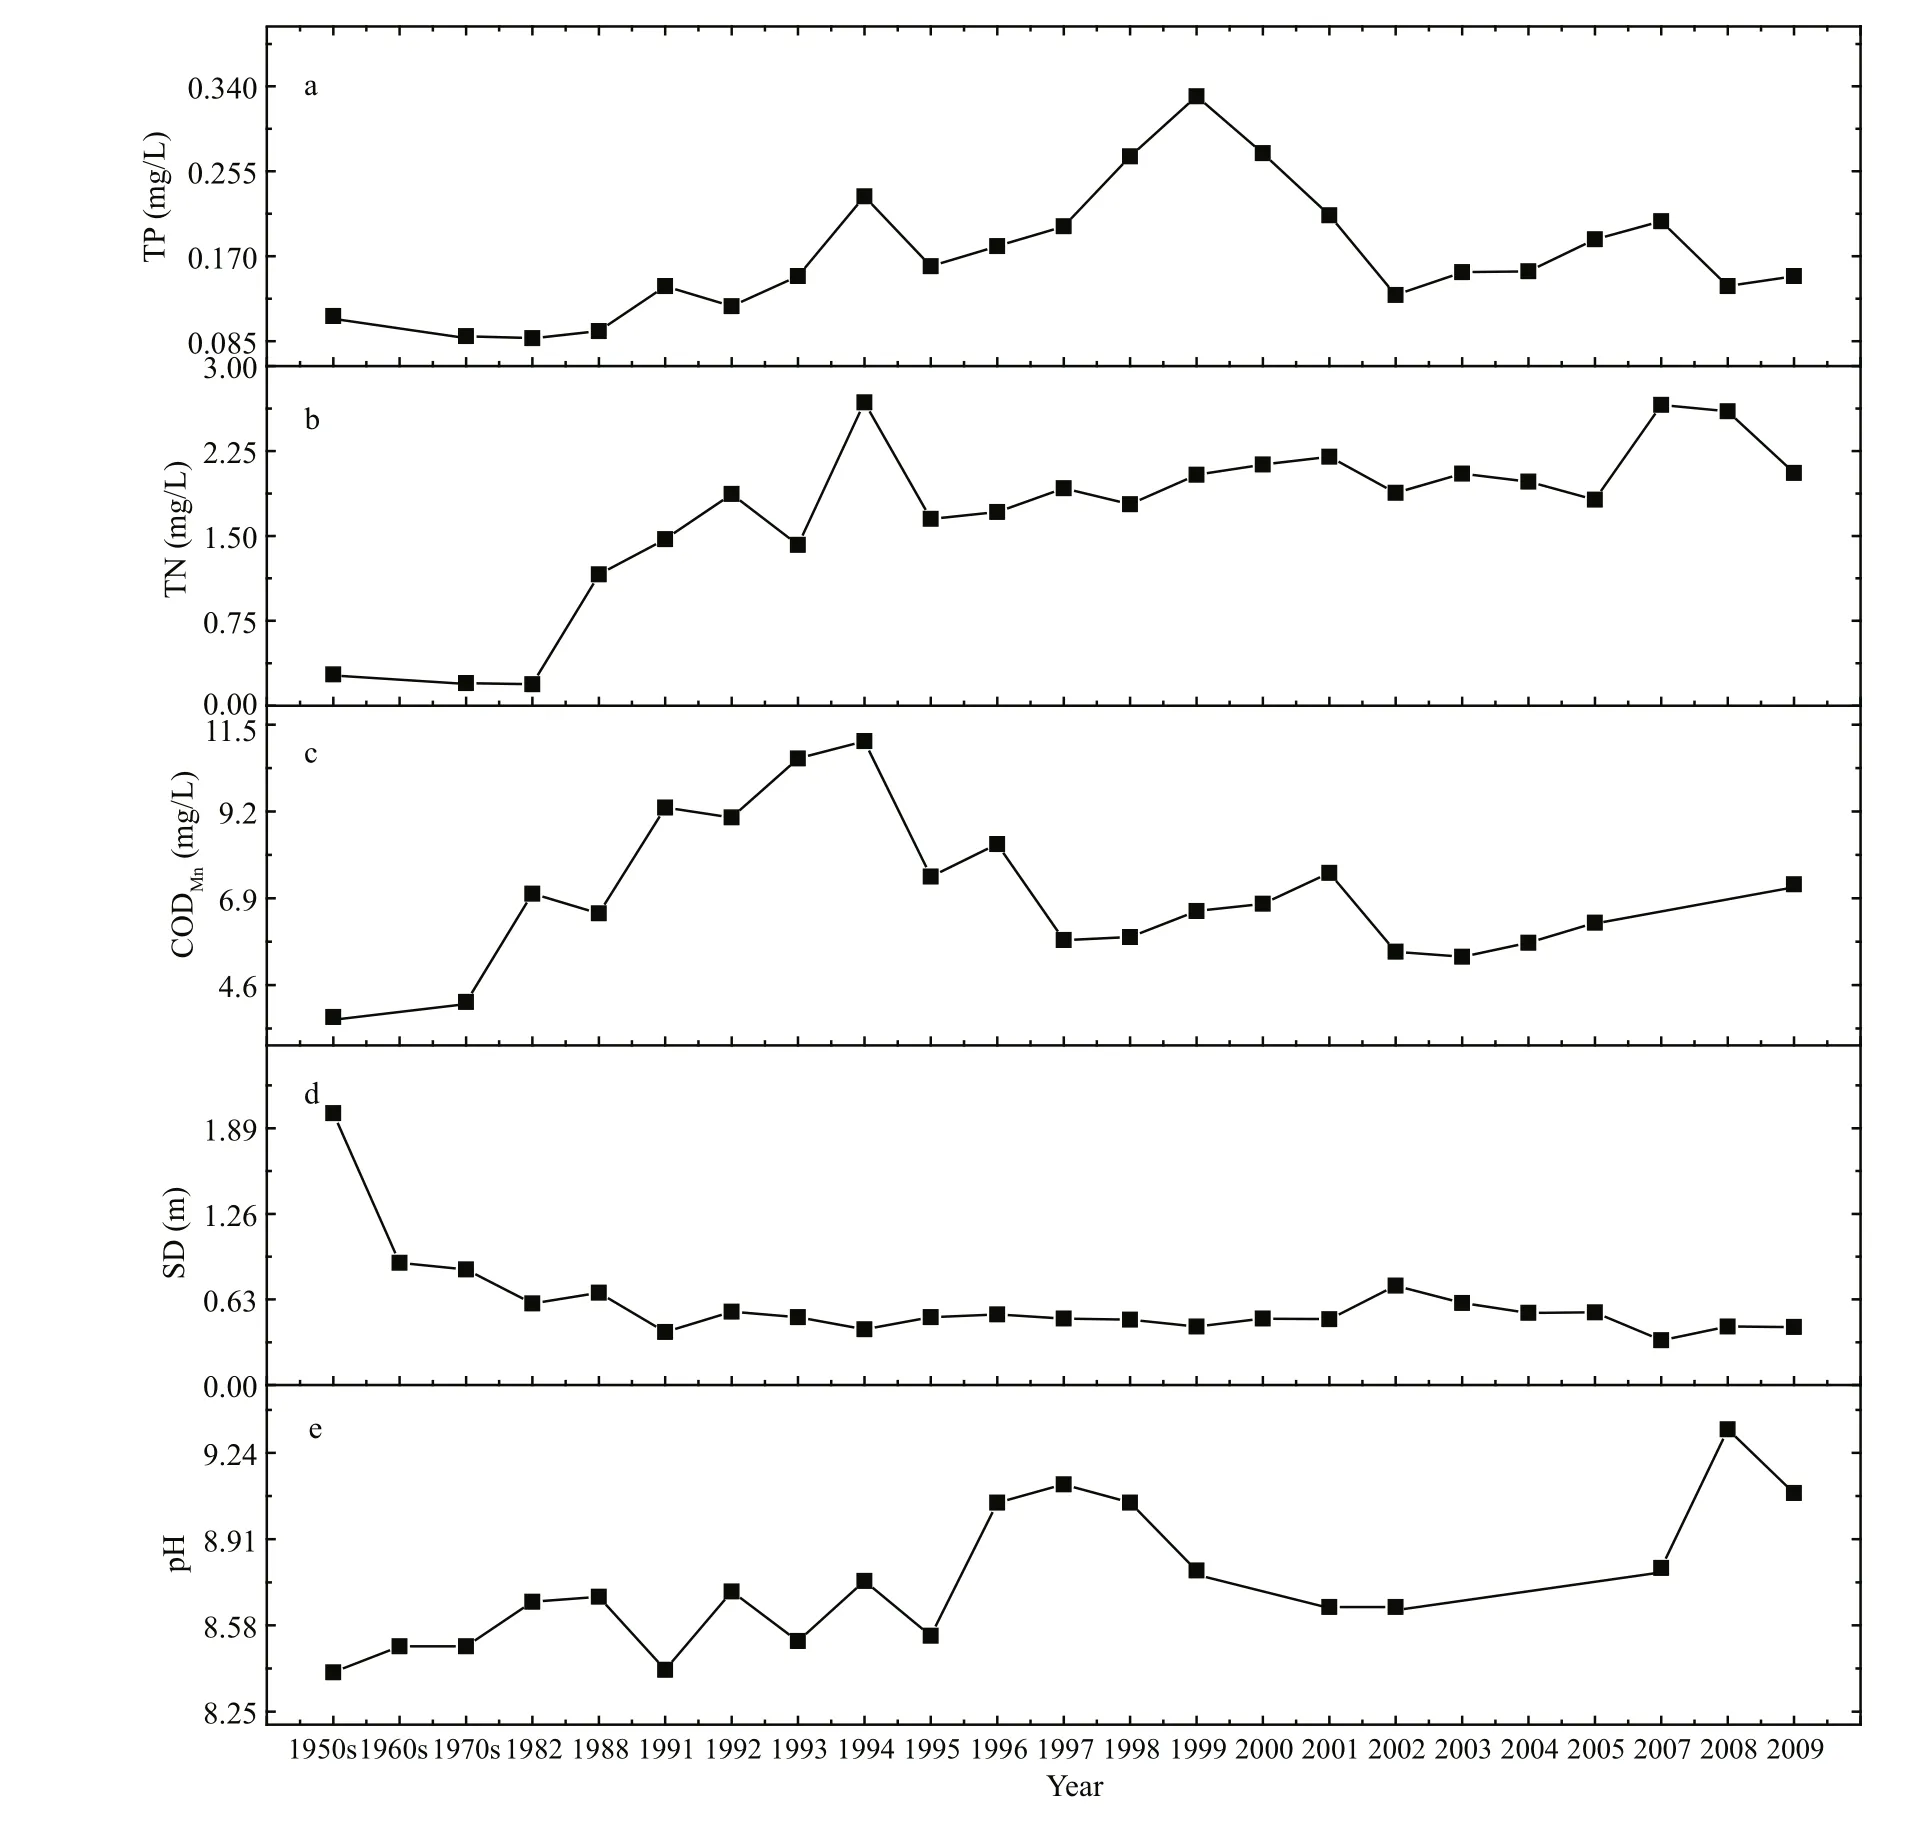
Fig.2 Key parameters of water from Lake Dianchi in the last 50 years
Figure 2 summarizes the published and collected data on TP, TN, CODMn, SD (Secchi disc) and water pH from 1950 to 2009. TP concentration in Lake Dianchi displayed a distinct pattern of variations(Fig.2a) in three different phases. Before 1990, TP concentration was low. During 1990 and 1999, it increased 3-fold, from about 0.1 mg/L to 0.33 mg/L.However, after 1999, it began to decrease. TN showed a different variation pattern (Fig.2b). Its concentration,low from the 1950s until the middle of the 1980s,began to rise quickly and reached more than 1.5 mg/L at the beginning of the 1990s: a 5-fold increase within 10 years. Since then, TN concentrations remained steadily higher, several times even reaching peak values as high as 2.5 mg/L. CODMnincreased gradually from 1957 and reached 10 mg/L in 1994;then it decreased sharply in 1995 without much variation in the following years (Fig.2c). SD was as high as 2.0 m in the 1950s, but it reduced to less than 1.0 m in the 1960s and presented an obvious decrease during the 1950s and 1990. After 1990 it remained relatively stable and fluctuated around 0.50 m(Fig.2d). Water pH increased from 8.4 in 1957 to a peak value of 9.05 in 1996; then it decreased from 1997 and remained relatively low until 2007 (Fig.2e),at which time it presented another peak in 2008.
3.2 Phytoplankton
We collected and analysed phytoplankton biomass data and they are summarized in Fig.3. Panel (a)shows that phytoplankton cell density was low in 1957, between 6.49×10⁵and 8.41×10⁶cells/L. During
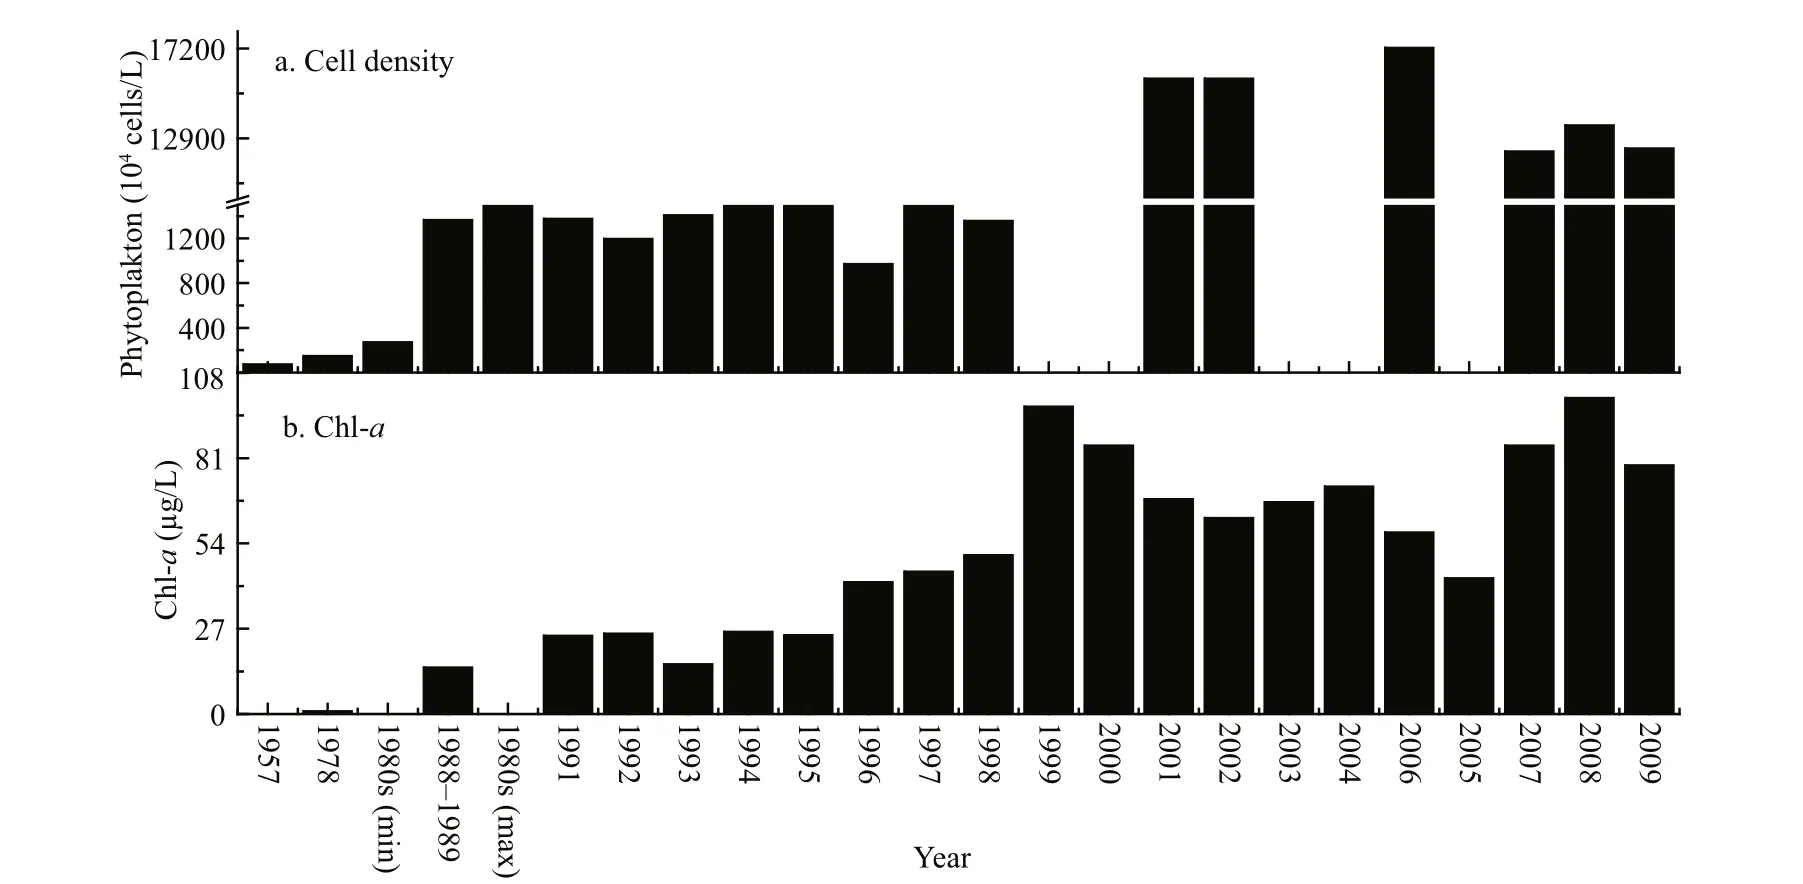
Phytoplankton biomass was evaluated by counting total phytoplankton cell density (a) and chl-a concentrations (b). The graphs are plotted from our collected and previously published data (Ley et al., 1963; Qu et al., 1983; Jin et al., 1990; Jin, 1995; Yu et al., 2010; Mo et al., 2007; Zhang, 2007; Luo et al., 2006).1980s (min) and 1980s (max) represent minimum and maximum values during the 1980s.
Fig.3 Phytoplankton biomass in Lake Dianchi from the 1950s to 20091981–1999, phytoplankton biomass increased approximately 10-fold compared with 1957 and cell density was as high as 107cells/L. After 2001,phytoplankton biomass displayed another 10-fold increase and cell density reached 108cells/L; levels have remained relatively high, as well as stable, since then. Chl- a showed a similar variation pattern to phytoplankton cell density. It was very low before the 1980s, and its concentration increased more than 4-fold during the end of the 1980s and the beginning of the 1990s, reaching 14–26 μg/L. After 1998 it displayed another (more than 3-fold) increase and its concentrations reached 57–100 μg/L. Apparently,observation showed that phytoplankton biomass presented three different phases. Before the 1980s chl- a was low and cell density was no more than 106cells/L. As the dates given were limited and discontinuous at the beginning of the 1980s, we cannot accurately state the time when phytoplankton cells reached 107cells/L. We can con firm that phytoplankton biomass had in general reached 107cells/L during 1988 and the 1990s. After 2000,phytoplankton biomass appeared to be very high and cell density reached 108cells/L.
Accompanying the phytoplankton biomass increase was a distinct variation in phytoplankton species, abundance and composition. Investigation in the 1950s revealed 8 phyla and 87 genera (Jin et al.,1990). In 1981–1983, 8 phyla, 91 genera and 205 species were found, of which 43.7% was Chlorophyta,23.4% was Bacillariophyta and 21.5% was Cyanophyta; these three phyla represented 88.6% of total species (Qian et al., 1985). Only 7 phyla, 52 genera and 97 species were found in 2006–2007, of which 53.1% was Chlorophyta, 13.5% was Bacillariophyta and 27.1% was Cyanophyta; these three phyla represented 92.7% of species. It was obvious that more than half of the species had disappeared between 1981 and 2007 and the percentage of species represented by Cyanophyta and Chlorophyta had risen. In 1957 the dominant species were Pediastrum simplex, Desmidiaceae sp., Surirella robusta and Ceratium hirundinella. The dominant genera changed to Scenedesmus, Pediastrum,Surirella and Microcystis during 1982–1983 (Qian et al., 1985). In 1988–1989 Cyanophyta, Chlorophyta and Bacillariophyta were dominant. After 2000 Microcystis dominated the populations all year,except that Aphanizomenon dominated brie fly in certain months (usually during late winter and early spring). As a species favouring clean water,Chrysophyta was never found during 2001–2002 and 2006–2007, according to our investigation.
3.3 Zooplankton

Fig.4 Zooplankton of Lake Dianchi in the last 50 years
We collected and analysed zooplankton biomass data and summarized them in Fig.4. Figure 4a shows zooplankton displaying a distinct pattern of variations.Biomass was less than 2 000 ind./L in 1957 and most individuals were protozoa (1 200–1 400 ind./L); the rest were rotifers (330 ind./L), copepods (120–135 ind./L) and cladocera (55 ind./L) (Ley et al.,1963). Biomass increased nearly 9-fold in 1982, of which protozoan biomass increased approximately 9-fold, rotifer biomass more than 20-fold and cladocera 2-fold; the copepod biomass remained relatively stable. In 1982–1994 biomass continued to increase,and it reached a peak value of more than 30 000 ind./L in 1994, approximately a 15-fold increase compared with 1957. Biomass then decreased by about twothirds in 2001–2002 compared with 1982–1994, and remained relatively stable until 2006 according our discontinuous data. Figure 4b shows that, unlike the variation in zooplankton biomass, the ooplankton biomass:phytoplankton biomass (BZ:BP) ratio(representing preying pressure on phytoplankton)displayed a ladder-like decrease pattern. This was more than 4×10⁻²in 1957; it decreased by one order of magnitude during 1982–1994; and it decreased by another two orders of magnitude after 2000.
3.4 Macrophytes
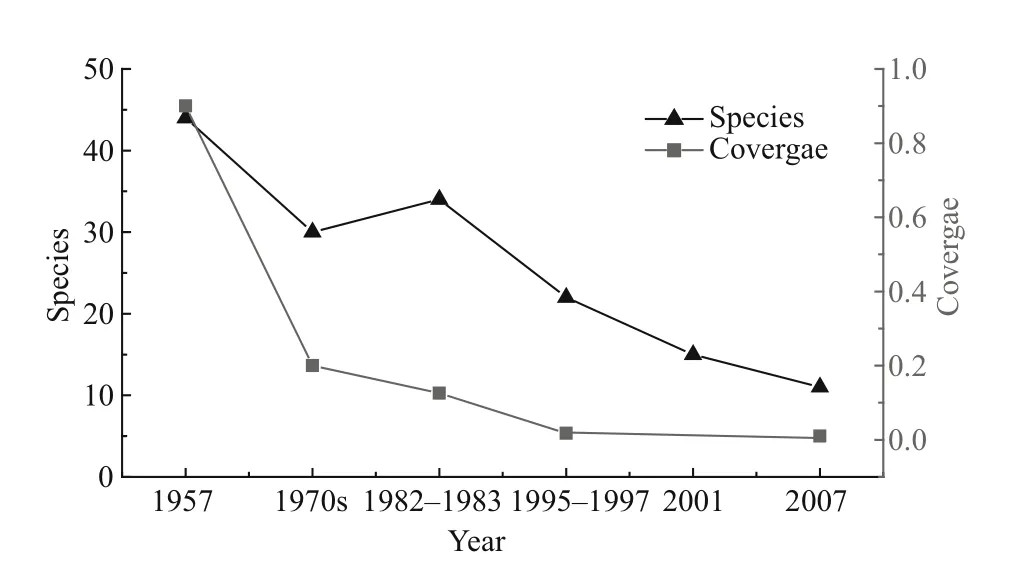
Fig.5 Macrophyte variations during the last 50 years
We collected and analysed macrophyte biomass data and they are summarized in Fig.5. This shows that both macrophyte coverage and abundance presented a persistent decrease during the last 50 years. Macrophyte coverage was more than 90% and maximum depth distribution was 4 m in the 1950s. It decreased to less than 20% in the 1970s and to 12.6%in 1981–1983 (only being found in regions about 2 m deep). It then further reduced to only about 1.8% in 1996–1997 and 1% in 2008, when it was limited to the aquatic–terrestrial ecotone and some local bays.Synchronously, population abundance showed a distinct reduction. About 44 species were found in 1957, mainly Charophyta sp, Ottelia acuminate,Potamogeton malaianus, Ottelia alismoides Pers.,Najas minor, Myriophyllum spicatum, Hydrilla verticillata, P. crispus and Ceratophyllum demersum.One-third of the species had disappeared by the end of the 1970s, and M. verticillatum began to dominate during 1981–1983. About half of the species had disappeared by 1995–1997, among them Eichhornia crassipes (which had been the first dominant species)and P. pectinatus (which had been the second dominant species); P. crispus and Vallisneria natans were at the edge of extinction. In 2001, the condition worsened and about two-thirds of the species disappeared. Among them P. pectinatus was the single dominant species, following in 2007, the relative dominance of P. pectinatus further increased but its distributing area decreased. Correspondingly,the Shannon-Weiner index exhibited a similar pattern of variation with coverage. It was as high as 1.65 in 1957, then decreased to 0.54 in the 1970s, 0.42 in the 1980s and 0.32 in the 1990s (Luo et al., 2006),decreasing by 67.3%, 74.5% and 80.6%, respectively,during the latter three decades. Clearly both macrophyte coverage and abundance dropped sharply in the 1970s.
3.5 Fish
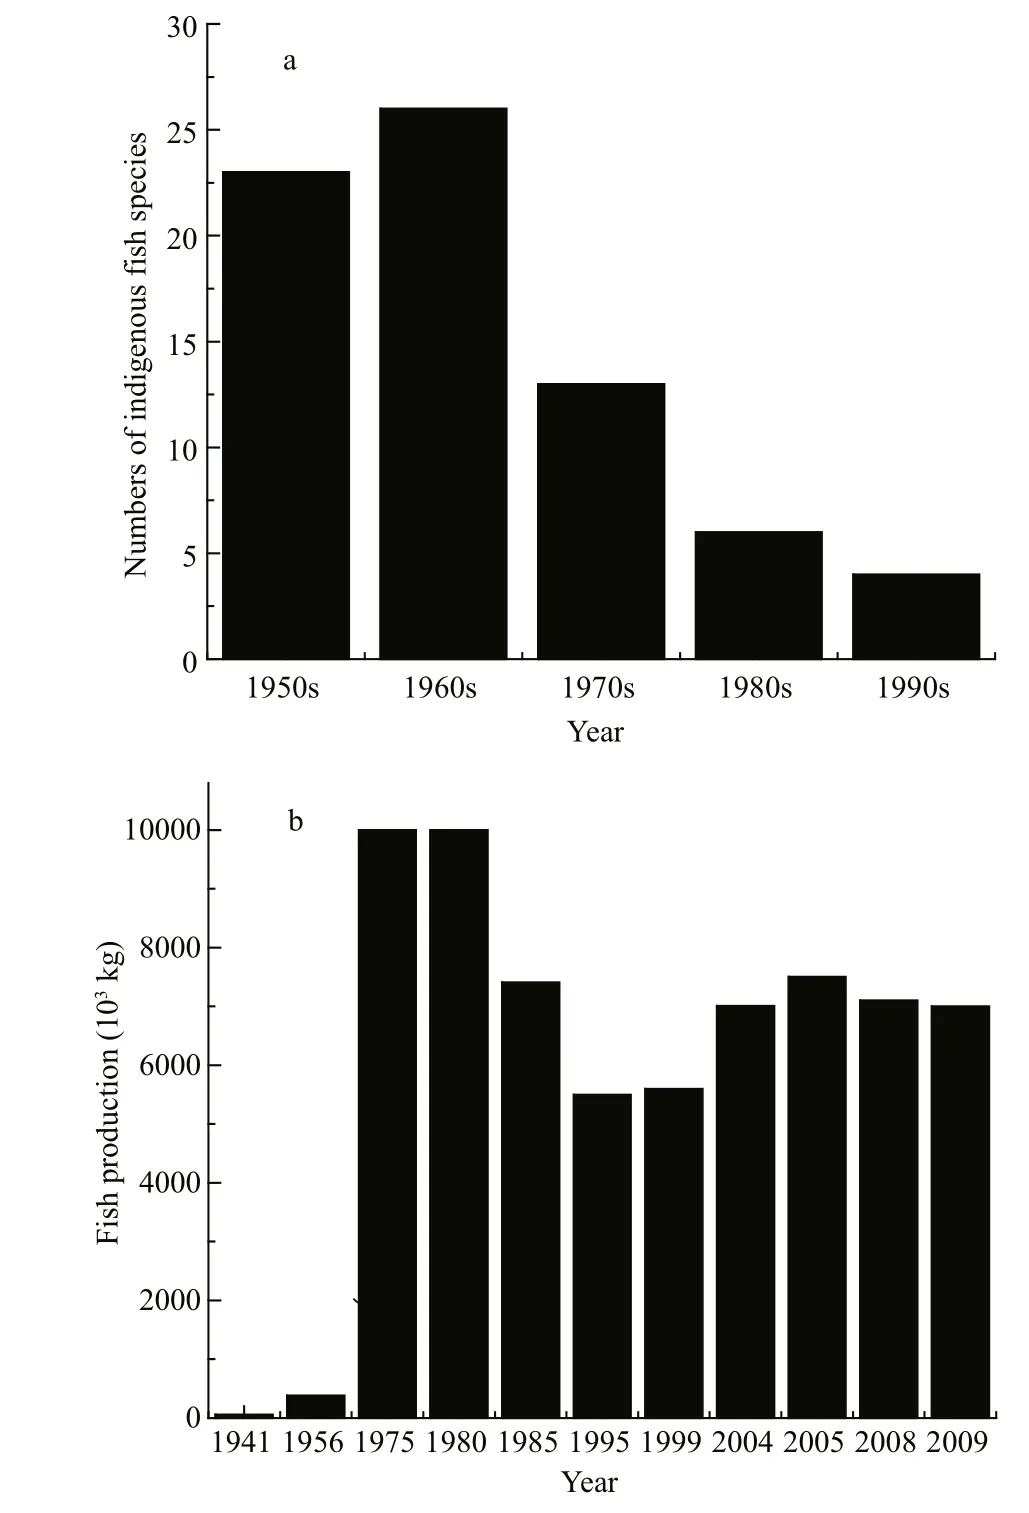
Fig.6 Fish populations in Dianchi Lake during the 1950s–1990s
We collected and analysed fish data, and summarized them in Fig.6. This shows that fish populations and productivity displayed distinct patterns of variation during recent years. Before 1957,indigenous fish abundance was high and 7 families,18 genera and 23 species were found; among them 12 species and subspecies were peculiar to Lake Dianchi.Indigenous fish, such as Anabarilius alburnops,Xenocypris yunnanensis and Cyprinus carpio chilia,dominated the population and total productivity was as low as 60×103kg in 1944 and 385×103kg in 1956(Chen, 1991). Since 1958, 29 exotic fish have been introduced into Lake Dianchi, competing with the indigenous fish for food and habitat. This has resulted in the number of indigenous fish decreasing from 23 before 1957 to 13 in the 1970s, 6 in the 1980s and 4 in the 1990s. The Shannon–Weiner index of indigenous fish decreased from 1.81 in 1956 to 1.32 in 1963 and 0.11 in 1997. Total fish productivity increased 24-fold in 1975 compared with 1956, then decreased by 20%–50% during 1985 and 1999, followed by a considerable increase since 2004 and maintained at approximately 7 000×103kg in recent years. Exotic small fish such as Rhinogobius giurinus,Pseudorasbora parva, Hypscleotris, Acanthorhodeus macropterus and Hemisalanx prognathus increased quickly to dominate the fish population from the 1970s. H. prognathus, in particular, increased to form a large population with productivity as high as 3 500×103kg in 1984, according to a report (http://www.shxb.net/html/ 20110721/ 20110721_285682.shtml), and has maintained a relatively high and stable productivity during recent years.
4 DISCUSSION
4.1 Transition between clean state and turbid state
It has been widely agreed that a natural lake has two distinct stable states, clean and turbid (Jeppesen et al., 1999). Many studies focus on these two different states and have given detailed descriptions of each(Schriver et al., 1995; Jeppesen et al., 1999). Only a few reports have mentioned a transient state existing between clear water and turbid water (Hargeby et al.,2007; Ibelings et al., 2007), thus the concept did not receive enough attention and as a result we know few of its characteristics. In fact, our observation of the course of regime shift in Lake Dianchi suggested the transient state lasts several years or more with an appearance of being clean before it shifts to a turbid state.
In the 1950s, the nutrient level for TP was about 0.1 mg/L and TN was less than 0.3 mg/L; this was low and did not pass the threshold concentration shift to a turbid state. Macrophytes dominated the ecosystem and showed high coverage (>90%) and abundance, and dominant species were mainly those favouring a clean state. Indigenous fishes dominated the population,having high diversity and low total productivity; thus the effect of sediment disturbance was small, helping the lake to maintain its clean state. BZ:BP ratio was high (Fig.4b) and enabled great prey pressure on phytoplankton. These typical characteristics, which included low nutrient level, macrophytes with high coverage and dominance, low fish productivity, high BZ:BP ratio, limited phytoplankton growth and maintenance of low phytoplankton density (105–106cells/L), all suggested that Lake Dianchi was in a clean state during the 1950s (Table 1).
During the 1970s–1980s there was a distinct increase in nutrients, particularly of TN which rose as high as 1.16 mg/L, passing the threshold concentration shift to a turbid state (Table 1). A previously published study indicated that in 1982–1983 Lake Dianchi wasmainly in a mesotrophic state and that most of it was in a eutrophic state in 1988–1989 (Luo et al., 2006).Macrophyte coverage decreased by more than 70%and passed the minimum of 30% coverage to secure clear water conditions in the longer term (Jeppesen et al., 1994). Many species of phytoplankton and macrophytes favouring a clean state disappeared,while pollutant-tolerant species began to dominate,apparently indicating an ecosystem beginning to undergo a marked shift. Foreign benthivorous and filter-feeding fishes increased quickly to supplant indigenous fishes, disrupting the original population balance. Consequently increased preying pressure on zooplankton and its disturbing effect accelerated nutrient release. All these promoted phytoplankton growth, and its density had reached 107cells/L by the end of the 1980s, making it impossible for the lake to maintain a clean state. The alternation of components above suggested that the ecosystem deteriorated quickly, and its stability began to be destroyed during this period. Persuasive evidence for instability was the Microcystis bloom in 1988–1989. Although many components suffered great alternation during the 1970s–1980s, the ecosystem seemed not shift to a turbid state, possibly because of its resilience and time lag, and so Lake Dianchi remained in a transient state during this period. When these alternations had accumulated by the 1990s, Lake Dianchi underwent a huge shift and ultimately moved into a turbid state.
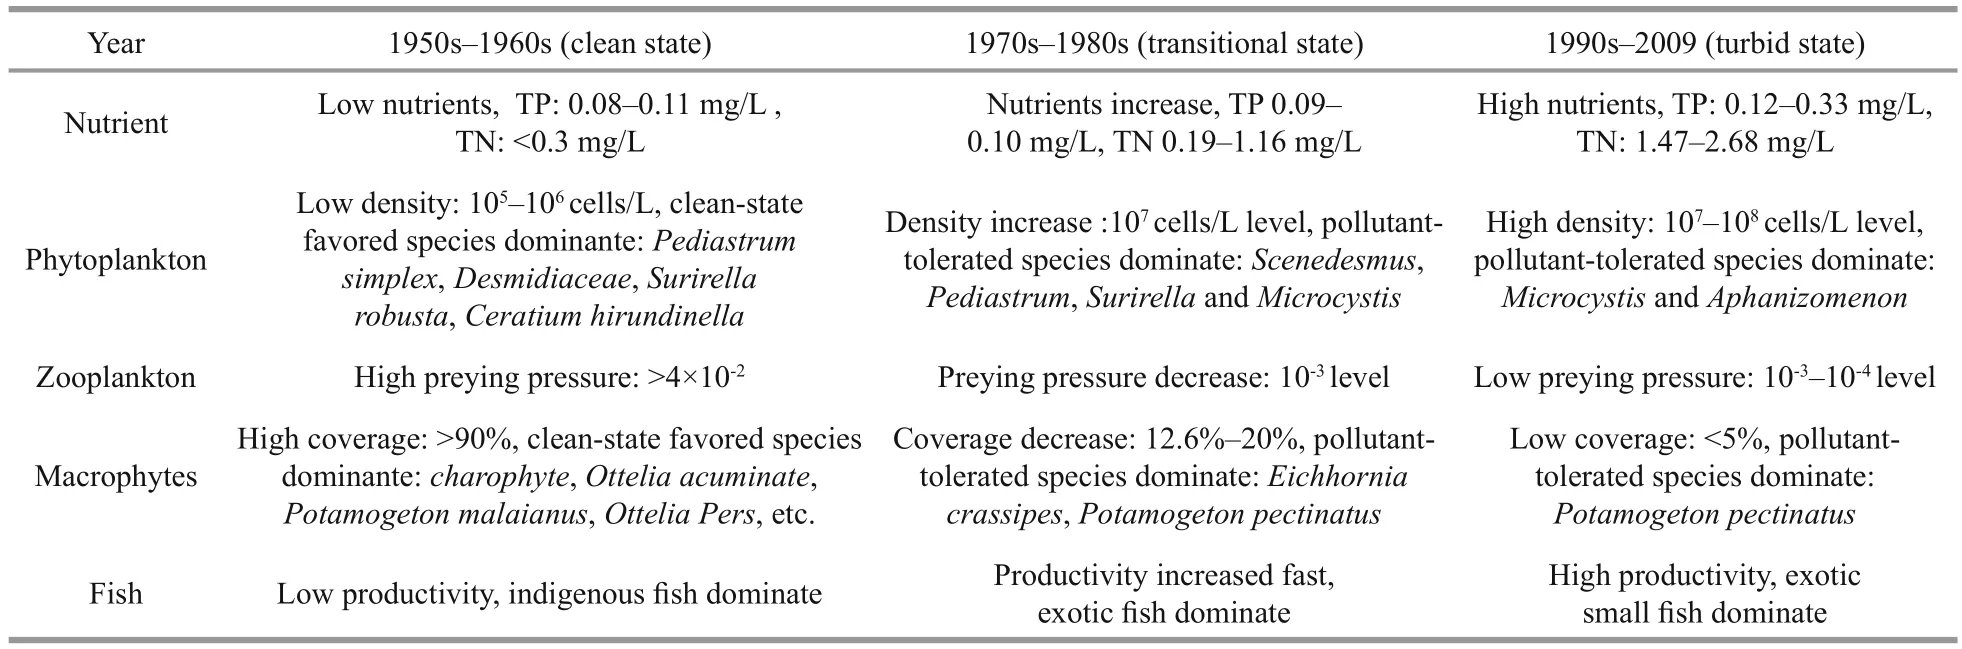
Table 1 Key nutrient and ecosystem indicators of the three states of Lake Dianchi
Traditional theory considers that regime shift is a sudden process (Jeppesen et al., 1999; Scheffer et al.,2001), whereas observations of transitional states between clean and turbid in natural lakes (including Dianchi in China, Lake Veluwe in the Netherlands,Lake T?kern and Krankesj?n in Sweden; Hargeby et al., 2007; Ibelings et al., 2007) con firmed the existence of a relatively prolonged transitional state before an abrupt shift took place. Studies of Lake Dianchi showed that biological components underwent a distinct shift during this transitional period: for example, some sensitive dominant species exhibited clear succession and turned out to be premonitors for the following abrupt shift (Table 1). Therefore, it seems more reasonable to assume that a natural lake can exhibit three states: clean, transitional and turbid.The distinct characteristics to differentiate these states are the parameters of nutrient level; phytoplankton biomass and structure; macrophyte coverage and structure; and BZ:BP ratio. The variations in Lake Dianchi during the last 50 years strongly support this,particularly by the data from phytoplankton biomass,zooplankton biomass and BZ:BP ratio which all distinctly exhibited three-ladder variations, suggesting three distinct states. Our previous observations and experiments on enclosures had shown that the transitional state was not stable and could switch between clean and turbid depending on external and internal variables (Hargeby et al., 2007; Wang et al.,2009; Tátrai et al., 2009). Therefore, careful attention to the transitional state can be crucial since it provides a warning to take precautions before the lake shifts to a turbid state.
4.2 When has regime shift finished?
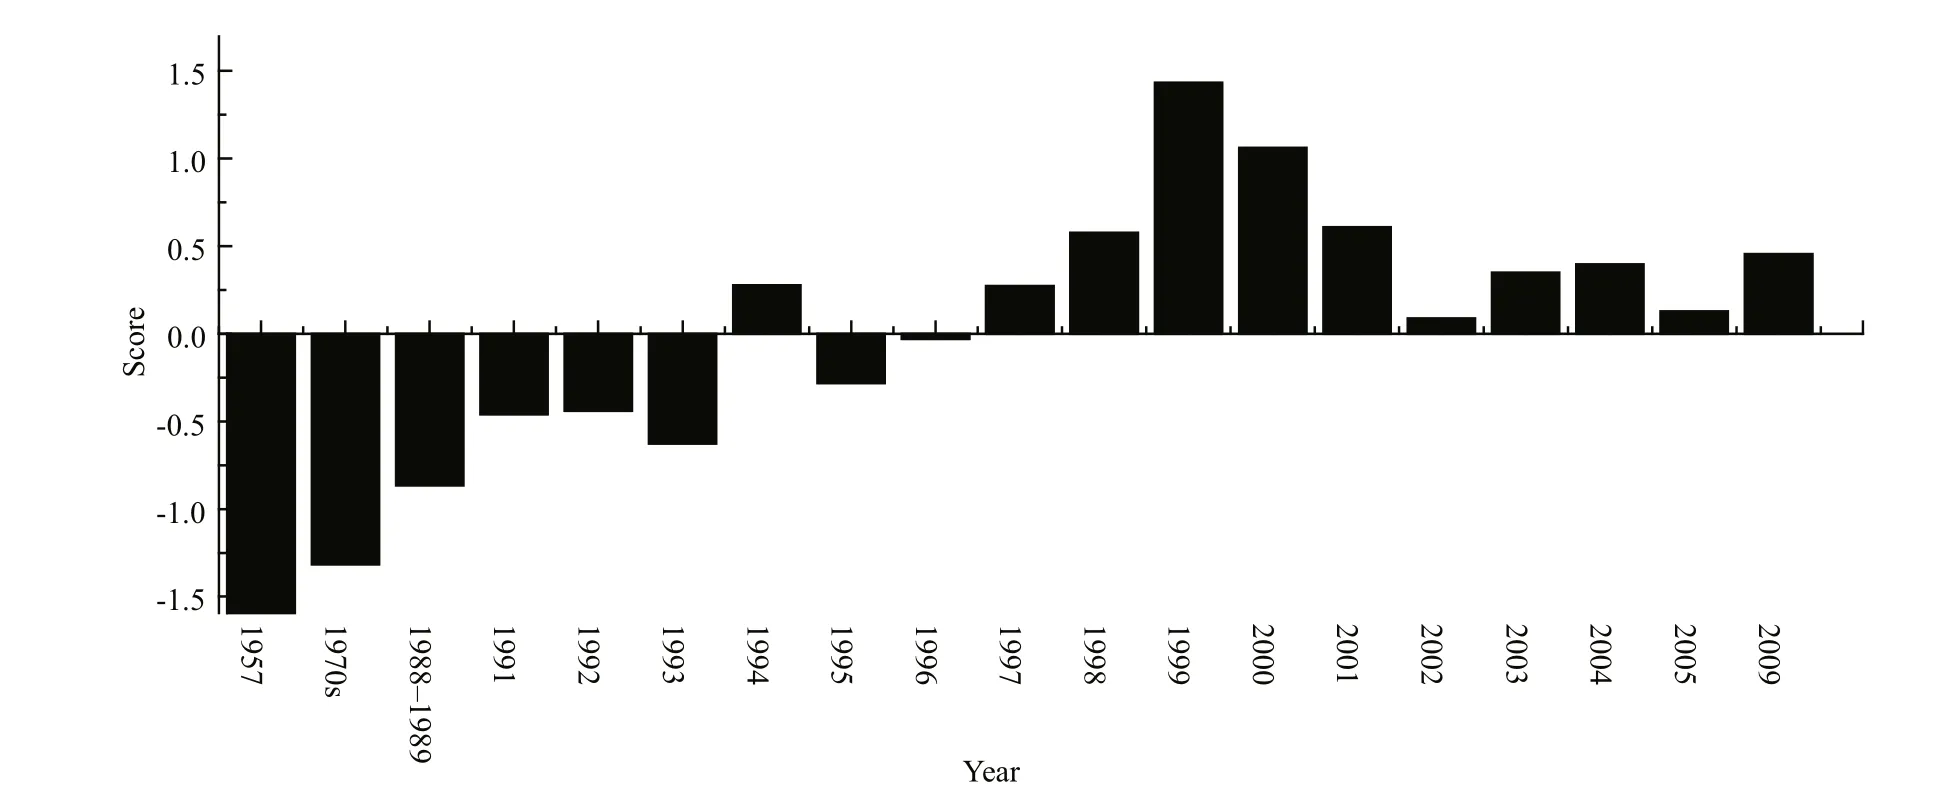
Fig.7 Evolving trends of different parameters of Lake Dianchi during the 1950s to 2009
After 1990 the nutrients in Lake Dianchi increased further; its TP and TN concentrations passed the threshold towards a turbid state (Scheffer, 1990;Srinivasu, 2004; Wang, 2007; Wang et al., 2009), and the resilience and time lag of the ecosystem could not maintain its transitional state. Phytoplankton density was 107cells/L and the first large area of cyanobacterial bloom was in 1992 (Li et al., 2005); there were frequent cyanobacterial blooms after 2000.Cyanophyta (mainly Mi crocystis and Aphanizomenon flos- aquae) dominated all year, typical characteristics of a turbid state and consistent with a previous report by Tátrai et al. (2009). In 1994–2001, macrophytes retrogressed to the edge of disappearance; zooplankton biomass decreased sharply by about 70%; and the BZ:BP ratio decreased by two orders of magnitude(Fig.4a). These huge alternations suggested the controlling effect on phytoplankton from macrophytes and zooplankton was greatly weakened. Indigenous fish populations had been replaced by small-sized fish from the middle-lower reaches of the Changjiang River (Chen et al., 1998). These benthivorous and filter-feeding fish preyed on zooplankton (indirectly favouring phytoplankton growth) and disturbed the sediment, accelerating nutrient recycling (Hargeby et al., 2007), thus promoting the shift of Lake Dianchi towards a turbid state.
In conclusion, key water parameters; phytoplankton and zooplankton biomass; macrophyte coverage and composition; and fish populations all indicated a fundamental shift, and all these components exhibited the typical characteristics of a turbid state during the 1990s. Our results from principal component analysis(PCA) have also illustrated that the ecosystem had experienced fast changes since 1957, and these changes constantly accumulated to induce an abrupt regime shift around 1993 (Fig.7). All these alternations indicated that Lake Dianchi moved into a stable,turbid state at about this time.
Since diatoms are ecologically sensitive to changes in water environment and do not easily decay in sediment after death, we can study shifts in lake state by collecting information from diatoms maintained in the sediment. Previous palaeolimnological study of diatoms (Gong et al., 2009) and our present results appear highly consistent. Before 1958, abundance and relative abundance (%) of different dominant taxa in Lake Dianchi were relatively stable; diatom species were relatively abundant and exhibited a high degree of endemism (Ley et al., 1963; Gong et al., 2009).These indicated that the state of Lake Dianchi before 1958 was stable and consistent with our discussion above. Then, in 1958–1985, the relative abundance of Aulacoseira granulat a and Cyclostephanos dubius showed different variation patterns in that the former decreased, whereas the latter clearly increased and the absolute abundance maintained correspondingly stable. These variations seemed likely to be signals for ecosystem response to environmental variation and gradual loss of stability. Since 1985, the absolute abundance of total diatoms began to increase and absolute abundance of A. granulate increased,whereas its relative abundance continued to decrease.Simultaneously, both absolute abundance and relative abundance of C. dubius clearly increased. These changes accumulated without a break and accelerated sharply around 1992, indicating a sudden shift in ecosystem state; this coincided with our PCA analysis results. Conclusions from alternation of nutrients,macrophytes, phytoplankton, zooplankton, fish and palaeolimnology suggest that regime shift occurred around 1993, and regime detection analysis shows that the threshold concentrations at which regime shift occurred were about TN 1.2 mg/L and TP 0.13 mg/L. This is consistent with previous studies(Jeppesen et al., 1990; 1999; Tátrai et al., 2009).
4.3 Mechanism of regime shift in Lake Dianchi
The most remarkable characteristic of regime shift is dominance alteration between macrophytes and phytoplankton. Previous study has indicated that the most important factor differentiating a turbid state from a clean state was macrophyte coverage, and macrophyte communities are of vital importance for maintaining a clear state in shallow lakes (Moss,1990; Scheffer et al., 1993; Jeppesen et al., 1997;Tátrai et al., 2009). The factors that induce macrophytes to lose their dominance, or phytoplankton to become dominant, are therefore important in regime shift.
There are several causes of the accelerated macrophyte disappearance in Lake Dianchi. One was land reclamation land from Lake Dianchi. In 1970,about more about 30 km2(accounting for 10% of total lake surface lake surface) during 1958–1970 was reclaimed to land (Chen et al., 1998). This destroyed the littoral zone and had a signi ficant in fluence on macrophytes, as well as on the whole ecosystem,resulting in the sudden disappearance of many macrophyte communities and a sharp decrease in coverage (70%). It disturbed the dominance of macrophytes and turned out to be the most direct and important cause of macrophyte disappearance.
Another cause was untreated residential and factory wastewater from nearby cities (Li, 1985).Increased nutrient loading promoted phytoplankton growth, a sharp decrease in SD (Figs.2, 3) and light penetration. These restricted the growth of submerged macrophytes and consequently accelerated their disappearance. Regression and correlation analysis con firms this finding (Fig.8a–c, e).
Exotic fish invasion also was an important cause of macrophyte disappearance. In 1969–1973, 30.85 million fish were introduced into Lake Dianchi.Among them, 36.9% (11.37 million) were planktivorous fish (mainly Ctenopharyngodon idellus) (Gao et al., 1981). These largely preyed on macrophytes and became an important factor in macrophyte disappearance (He et al., 1980; Li, 1985).The disappearance of macrophytes depressed their ecological functions such as their ability to stabilize sediments, adsorb nutrients, provide refuges for zooplankton, restrain phytoplankton growth and increase transparency (Vermaat et al., 2000) and,inversely, further decreased SD and reduced the resilience of the ecosystem. Since macrophytes play a decisive role in the development of water conditions(Tátrai et al., 2009), their disappearance can directly induce a lake to shift to a turbid state.
Fish populations experienced an abrupt shift resulting from external pollution, habitat destruction by land reclamation and exotic fish invasion. External pollution destroyed spawning grounds and in fluenced the reproduction of indigenous fish by accelerating macrophyte disappearance (Chen et al., 1998). In addition, exotic fish competed with indigenous fish for food and niches, eating their eggs and so accelerating their disappearance. In contrast, the populations of small fish ( Rhinogobius giurinus, Hypseleotris swinhonis and Hemisalanx prognathus) enlarged quickly and became dominant because there was abundant food, no natural enemies and they had better reproducibility (He et al., 1980; He and Liu, 1985).These small fish were mainly benthivorous or filterfeeding fish. They not only disturbed the sediment and accelerated nutrient releasing and cycling to increase the nutrient level; they also preyed on zooplankton and became mainly responsible for the low BZ:BP ratio in subtropical lakes (Jeppesen et al., 2005, 2007;Meerhoff et al., 2007; Iglesias et al., 2008; Havens et al., 2009; Teixeira-de Mello et al., 2009). Our results showed that large populations of benthivorous and filter-feeding fish enhanced preying pressure on zooplankton and resulted in a three-ladder decrease in the BZ:BP ratio (Fig.4). This led to an alleviated preying rate on phytoplankton and indirectly bene fited its growth, as well as the decrease in SD. These observations are consistently supported by the results shown in Fig.8d, indicating that R2=0.959, P=0.003,SD and BZ:BP are signi ficant correlated at the 0.01 level; and the results shown in Fig.8i indicating that R2=0.935 4, P=0.000, log(BZ:BP) and log(Chl- a) are signi ficantly correlated at the 0.01 level. The regression analysis suggested that the BZ:BP ratio was mainly responsible for phytoplankton growth and SD decrease in Lake Dianchi. Therefore, the alternation in fish populations induced by exotic fish invasion had a controlling role in the BZ:BP ratio and was an important cause of regime shift in Lake Dianchi. Our regression analysis results also indicate that nutrients(TP, TN and CODMn) were signi ficantly correlated with SD (Fig.8a–c), suggesting that nutrient loading was a key factor in SD decrease. In addition, Fig.8g–i show that chl- a was signi ficantly correlated with TN,TP, BZ:BP and macrophyte coverage (their R2values were 0.473, 0.297 7, 0.935 4 and 0.925 9, respectively;and P values were 0.000, 0.011, 0.000 and 0.033,respectively). These values indicated that nutrients,zooplankton predation and macrophyte competition were main factors determining phytoplankton biomass.
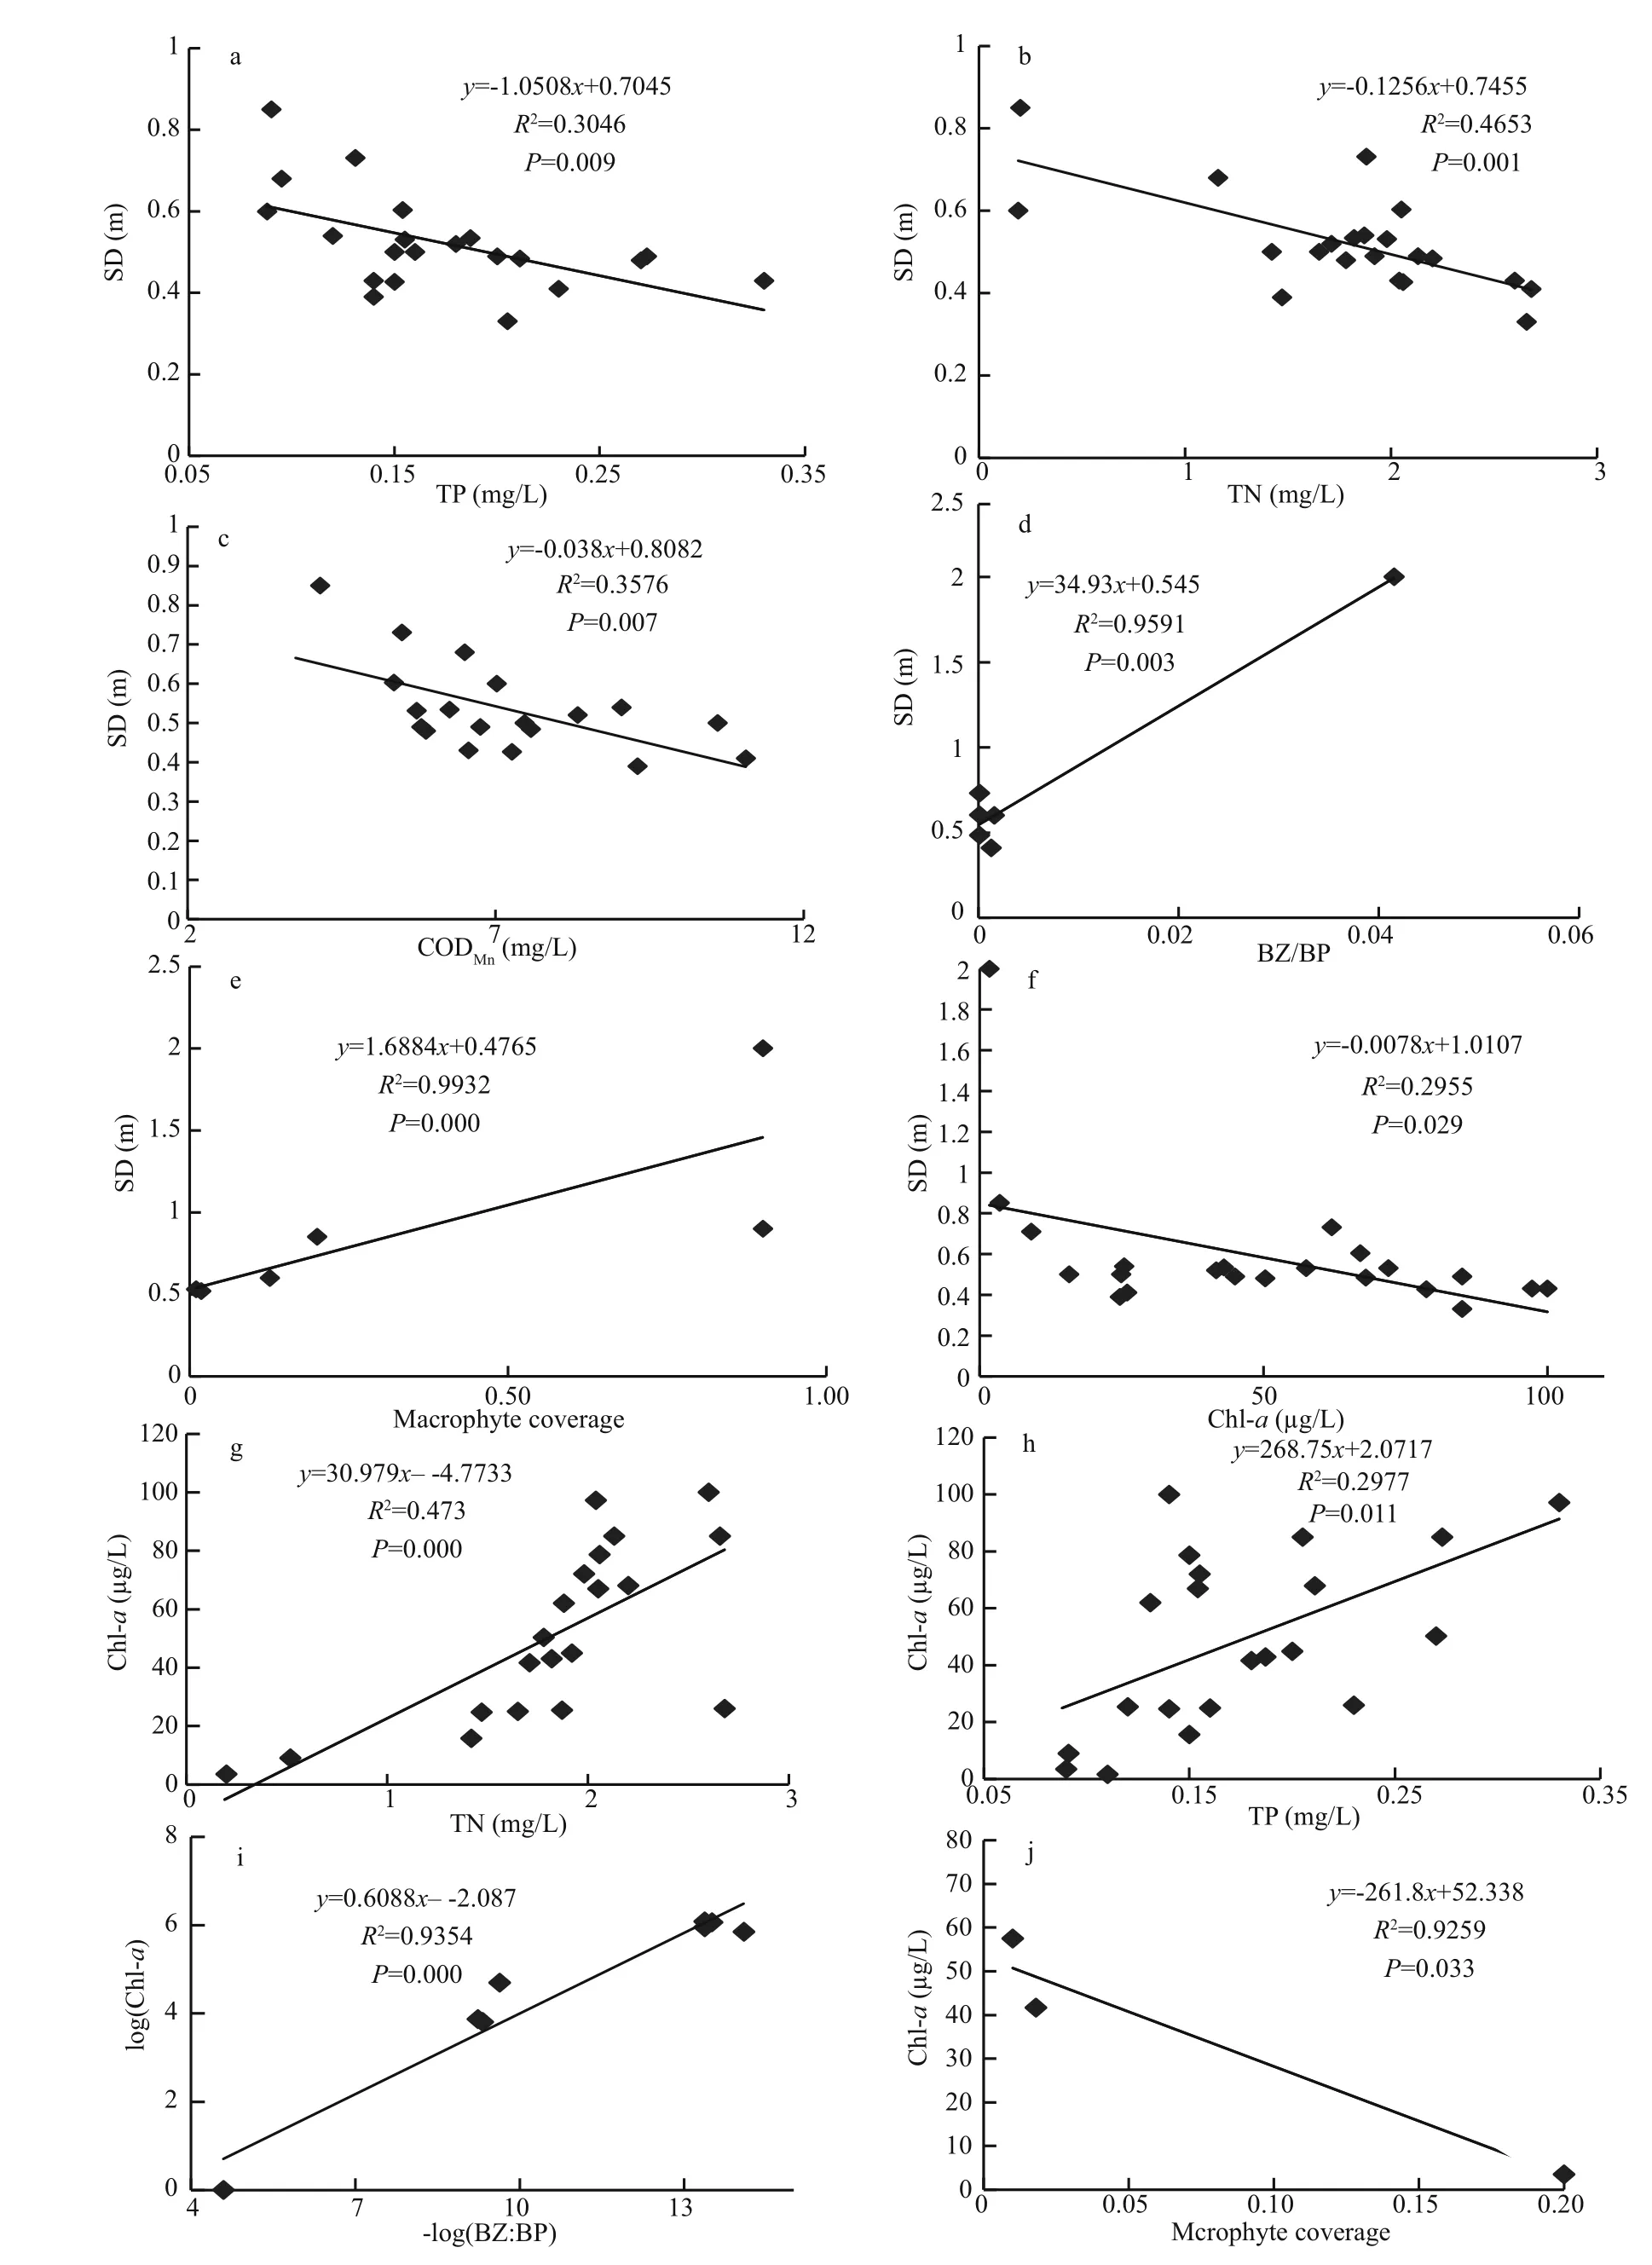
Fig.8 Regression analysis of SD and chl- a vs other variables of Lake Dianchi during the last 50 years

Fig.9 Model indicates function of different components in regime shift course of Lake Dianchi
In altering from a clean to a turbid state, different components function reciprocally (Fig.9) and thus make explanation very complicated. Taking macrophyte disappearance as an example, it can be directly destroyed by land reclamation (destroying function), fish ( Ctenopharyngodon idellus) predation,SD decrease (light limited) and phytoplankton competition; where reversely, macrophyte disappearance brings impact on BZ:BP ratio (reducing refuge for zooplankton), SD (less function of stabling sediment and resuspension), phytoplankton (less competition). However, in concluding our discussion of these complex connections, we think nutrient loading was the primary driving force for regime shift in Lake Dianchi, because it promoted phytoplankton growth, SD decrease, fish population degradation and macrophyte disappearance. Large-scale land reclamation was the most direct and important cause for macrophyte disappearance in the 1970s. It was disastrous for macrophytes, hugely damaged the whole ecosystem, destroyed fish spawning grounds and refuges for zooplankton and resulted in accelerating the degradation of indigenous fish and imbalance of the BZ:BP ratio (Figs.4, 8, 9). Therefore,‘It is therefore difficult to evaluate the long-term,cascading after-effects on the ecosystem induced by land reclamation’.
Fish are at the top of the biological chain in freshwater ecosystems. Experimental evidence and large-scale biomanipulation of lakes show that the fish community has a major in fluence on the system structure of shallow, eutrophic lakes (Meijer et al.,1990; Scheffer et al., 1993; Hansson et al., 1998;Meijer, 2000; Mehner et al., 2002; Hargeby et al.,2007). Once the fish population has altered, cascading effects will follow and affect the other trophic levels.Introduced exotic fish (mainly planktivores,benthivorous or filter-feeding) formed a large population in Lake Dianchi; they dominated and enhanced predation on macrophytes and zooplankton,and indirectly promoted phytoplankton growth and SD decrease. In conclusion, we can state that nutrient loading, land reclamation and fish invasion functioned together to promote macrophyte disappearance and phytoplankton increase, then further produced a series of trophic cascading effects and finally prompted the lake to change from a clean to a turbid state.
4.4 Considerations for lake restoration
Since the end of the 1990s the municipal government has made great efforts to restore Lake Dianchi, in view of its importance to the upriver Kunming city(residential consumption, agricultural irrigation and other purposes). The measures that have been taken included reducing external pollution loading, chemical stabilization of sediment, macrophytes restoration,dredging and biomanipulation. Although TP and CODMndecreased signi ficantly, the restoration effect was not remarkable, since levels of TN and general nutrients remained high, and the arti ficially planted macrophytes did not grow well and failed to extend into the open zone, and Microcystis blooms still occur regularly.
The likely reason for the unsuccessful restoration is that external and internal pollution has not been controlled effectively, and nutrient levels have remained above the threshold of the turbid state.According to an investigation in 2007–2009, mean concentrations of TP and TN were 0.165 mg/L and 2.4 mg/L, respectively. These levels are much higher than the threshold concentrations (TP 0.13 mg/L and TN 1.2 mg/L) at which it shifted from a clean state to a turbid state. In fact, considering the resilience of the ecosystem, we need to decrease nutrients to another,lower threshold concentration (we suggest TP<0.03 mg/L and TN<0.4 mg/L) to return the lake to a clean state. Therefore, to achieve a better result, we suggest dynamic restoration through three critical measures: (1) to control pollution loading, both externally and internally, bringing nutrient concentrations below the thresholds of TP<0.03 mg/L and TN<0.4 mg/L; (2) to gradually return reclaimed land to the lake and return the littoral zone to its natural state, so macrophytes will be able to increase steadily; and (3) to adjust fish populations. This should be done by controlling the population of benthivorous and filter-feeding fish, and so to enlarge the zooplankton population, controlling phytoplankton and reducing sediment resuspension as well as nutrient release. Since Lake Dianchi is a huge shallow lake, it is difficult to eliminate these benthivorous and filter-feeding fish using nets or other instruments. A good choice may be to enlarge the aboriginal piscivorous fish by arti ficial propagation to control the benthivorous and filter-feeding fish populations,sequentially reducing preying pressure on zooplankton and increasing control of phytoplankton. This study suggests that, when managing a lake, the transitional state provides a good opportunity to restore lake ecosystems, because resilience and time lags tend to maintain its clean state during this period. Once a lake shifts to a turbid state, the resilience and time lags tend to maintain turbidity, and increase the difficulties in reversing its state.
5 CONCLUSION
By systematically collecting and studying alternations of key components of Lake Dianchi over the past five decades, including key water parameters,phytoplankton and zooplankton biomass, macrophyte composition and coverage, fish populations and productivity, and palaeolimnological date, we found that a transitional state existed between a clean state and a turbid state. The shifting course of Lake Dianchi went through three major phases, corresponding to these three distinct states. We focused on transitional states as these may provide a good opportunity to restore the lake’s ecosystem.
We identi fied that the regime shift occurred around 1993. The threshold concentrations at which regime shift occurred were TN and TP reaching 1.2 mg/L and 0.13 mg/L, respectively. Results from this study strongly suggest that the increasing input of external nutrients, land reclamation and invasion by foreign fish were major causes inducing the accelerated shift of Lake Dianchi to its turbid, stable state. These findings provide valuable guidelines for potential efforts to reverse this unnatural process in Lake Dianchi.
6 DATA AVAILABILITY STATEMENT
All data generated or analysed during this study are included in this published article.
7 ACKNOWLEDGEMENT
We would like to acknowledge Professor WEI Feng from the University of California-Davis,California, USA, for his suggestions on how to improve this paper.
猜你喜歡
應(yīng)用數(shù)學(xué)(2023年4期)2023-10-06 10:44:06
防爆電機(jī)(2022年4期)2022-08-17 06:00:02
當(dāng)代黨員(2022年9期)2022-05-20 16:24:34
華人時(shí)刊(2020年15期)2020-12-14 08:10:48
沈陽(yáng)體育學(xué)院學(xué)報(bào)(2019年3期)2019-07-24 10:44:30
河南畜牧獸醫(yī)(2017年20期)2018-01-19 02:48:19
河南畜牧獸醫(yī)(2017年8期)2017-11-24 03:22:18
河南畜牧獸醫(yī)(2017年12期)2017-11-13 04:05:18
環(huán)球市場(chǎng)信息導(dǎo)報(bào)(2016年41期)2017-01-19 09:26:37
公民與法治(2016年11期)2016-05-17 04:13:19
 Journal of Oceanology and Limnology2018年4期
- Journal of Oceanology and Limnology的其它文章
- Editorial Statement
- Effects of seawater acidi fication on the early development of sea urchin Glyptocidaris crenularis*
- Dietary effects of A zolla pinnata combined with exogenous digestive enzyme (Digestin?) on growth and nutrients utilization of freshwater prawn, Macrobrachium rosenbergii(de Man 1879)
- Preliminarily study on the maximum handling size, prey size and species selectivity of growth hormone transgenic and non-transgenic common carp Cyprinus carpio when foraging on gastropods*
- Hydrodynamic characteristics of the double-winged otter board in the deep waters of the Mauritanian Sea*
- De novo transcriptome sequencing reveals candidate genes involved in orange shell coloration of bay scallop Argopecten irradians*