
Comparative study of probable maximum precipitation and isohyetal maps for mountainous regions, Pakistan
2018-04-08 00:52:09MuhammadWaseemBootaGhulamNabiTanveerAbbasHuiJunJinAyeshaYousafMuhammadAzeemBoota
Muhammad Waseem Boota , Ghulam Nabi , Tanveer Abbas , HuiJun Jin ,Ayesha Yousaf , Muhammad Azeem Boota
1. Department of Technology (Civil), The University of Lahore, Lahore 54500, Pakistan
2. Centre of Excellence in Water Resources Engineering, University of Engineering and Technology Lahore, Lahore 54890, Pakistan
3. State Key Laboratory of Frozen Soils Engineering, Cold and Arid Regions Environmental and Engineering Research Institute, Chinese Academy of Sciences, Lanzhou, Gansu 730000, China
4. Department of Mechanical Engineering, University of Engineering & Technology Lahore, Lahore 54890, Pakistan
5. Department of Agricultural Engineering, The University of Agriculture Faisalabad, Faisalabad 38040, Pakistan
1 Introduction
Water scarcity appears to be a future problem for Pakistan. This problem is an existential threat which can potentially hurt economic growth as well as jeopardize agriculture growth. Water is expensive and inexpensive depending on its availability according the law of demand and supply (Adebayo, 2007). The agricultural sector is highly dependent on the limited water reservoirs of Pakistan. This sector is the largest component of Gross Domestic Product (GDP) in Pakistan and it contributes 25% of total GDP (Khosoet al., 2015). Water scarcity has serious ramifications on agriculture and has become the foremost priority.Reliable estimation of PMP is vital for the construction of dams, storage reservoirs and other hydraulic structures. If spillways are improperly operational then dam overtopping may occur. Overtopping may increase the chance of a dam breach, causing significant human, economic and property loss. Hydrologist utilized the PMP value for the estimation of Probable Maximum Flood (PMF) regarding its temporal and spatial distribution for the catchment area of a dam. In many regions of the world, PMF has become a standard method for dam design. The accuracy and reliability of PMP depends on the quantity and quality of rainfall data (Casaset al., 2011). Also, there is an undeniable effect of water scarcity problems on poverty and economic growth rate, which is receiving increased attention worldwide (Naseer, 2013). This problem has become an issue of grave importance in Pakistan and there is an urgent need for water reservoirs (mini, large) to cope and overcome water deficit problems. The severity of this problem could be alleviated by soil and water conservation measures such as construction of large to small dams, and dam maintenance. Another objective of these structures is to reduce the increased depletion of ground water. Dam construction cannot be undertaken without ample knowledge of PMP which leads to a pre-conditional success.
PMP studies are very helpful in dam design,which provides rational information that assist in optimal design of dam height and reservoir storage capacity of water conservation and flood-carrying structures (spillway and flood carrying tunnel). A variety of techniques are available for PMP estimation based on different parameters,i.e., location and accessibility of rainfall data (Wiesner, 1970; WMO, 1973,2009; Schreiner and Reidel, 1978; Collier and Hardaker, 1996). The approaches used for PMP estimation can be broadly classified as (1) statistical which involves Hershfield analysis on extreme precipitation observation (2) storm models that involves maximization of actual storm, and (3) approaches involving wind-moisture maximization (WMO, 1986).Complete details on these techniques can be found in Hershfield (1961a, 1965, 1981), Foufoula-Georgiou(1989), Roth and Schulze (1991). Koutsoyiannis D(1999) estimated PMP using probabilistic treatment of Hershfield's technique, suggesting that this technique can be improved by using long series precipitation data. Casaset al. (2011) estimated PMP in Barcelona(Spain) by using the Hershfield method and physical approach based on maximization of storm. Chavan and Srinivas (2015) estimated PMP in the Mahanadi River Basin (India) using the storm model approach and Hershfield method. There is a great mismatch of PMP results obtained from these approaches.Rakhechaet al. (1992) estimated one-day PMP in India using the hydro-meteorological approach and concluded that the physical approach gives higher results compared to statistical approach. Papalexiou and Koutsoyiannis's (2006) PMP study concluded that results obtained from the moisture maximization method are inconsistent compared with probabilistic approach. It is suggested that the probabilistic technique is more consistent and reliable for computing extreme rainfall values for designing purposes. Kennedy(1982) suggested using the Generalised Short Duration Method (GSDM) for estimating PMP, based on short duration precipitation data provided by the United State. It is suggested that GSDM is applicable only for a few short duration rain showers in Australia. Rezacovaet al. (2005) estimated PMP for river basins in the Czech Republic (CR) using different techniques. Radar based rainfall data was used in assessing PMP as well as area reduction factor. Results show that peak area precipitation over small CR catchments did not increase 63% of the corresponding PMP values.
The Hydro-metrological/physical approach is used worldwide for PMP estimation in larger watersheds(Fattahiet al., 2010). In the physical approach, moisture maximization is most commonly used and accepted method for PMP studies (WMO, 1986). The moisture maximization (MM) approach is defined as the ratio of extreme precipitable water to storm precipitable water which is calculated from maximum dew point and storm dew point temperature. The wind maximization approach is the ratio of maximum recorded wind run to storm wind run. Svensson and Rakhecha (1998) used the hydro-meteorological approach to estimate PMP for Chinese dams in the Hongru Rver Catchment. Calculated values of PMP for 1-,2- and 3-day durations were 1,200, 1,460 and 1,910 mm, respectively. Chang and Hui (2001) used the MM approach to estimate PMP for Hong Kong. It was concluded that for both PMPs estimation for 4-hour and 24-hour, the updated computation is normally smaller than previous obtained computation because seasonal adjustment is not considered. Fernando and Wickramasuriya (2011) used the hydro-meteorological technique for different scenarios to estimate PMP in Sri Lanka. It was concluded that maximum moisture and wind speed are two scenarios, which gives compatible results compared with statistical results. Hauck E (1983) estimated PMP using physically approach as well as absolute highest values in Oder River (Europe) for peak floods in relation to maximum rainfall for reservoir safety installation. Al-Mamun and Hashim (2004) developed the PMP isohyetal map for Malaysia using the reliable hydro-meteorological method. Isohyetal maps were generated using the Kriging method. Calculated PMP values are higher in West Malaysia compared with other parts of Malaysia. In this approach, the relationship among rainfall depth and moisture content in the atmosphere is used (Breuer and Kreue?s, 1985, Ruheet al., 1985.The physical approach was also used in Indian regions where monsoon depressions cause major floods(Rakhecha and Kenndey, 1985). In this study, two PMP techniques were considered, namely the statistical method (Hershfield approach) and hydro-meteorological method (including MM and WMM approaches). Data availability for mountainous region is reliable and deemed adequate for the estimation of PMP using the aforementioned techniques. These methods provide reliable PMP estimation results for a target location scale or grid location (Rezacovaet al.,2005). The purpose of this study is to evaluate the best technique between statistical and meteorological approaches for PMP estimation, and to suggest the best fit distribution for estimating maximum precipitation at different return periods. The PMP appraisal is used to construct PMP maps which is useful for construction of hydraulic structures.
2 Study area description and data collection
This study was conducted in the northern mountainous region of Pakistan, and all five major rivers originating from this region is presented in Figure 1.Seven stations namely Murree, Mianwali, Jhelum,Chaklala, Chirah Bridge, Kallar Syedan and Gujjar Khan were selected for the study area. There are great variations in precipitation, topography and vegetation,with diverse climatic conditions in the study area.Summer starts from May and continues till October,with May, June and July as the hottest months, and average temperatures varies of 18-30 °C. The average minimum and maximum temperature during the winter is -7 °C and 17 °C, respectively. Twenty-fourhour precipitation data over the period of 1961-2015 along with storm parameters.i.e., relative humidity,dew point temperature, pressure and hourly basic precipitation data were collected from the Pakistan Meteorological Department (PMD). Precipitation data and storm parameters data were used in the statistical approach as well as the physical approach for PMP appraisal. Annual one-day maximum and minimum precipitation recorded during different years for a period of 30 years is presented in Figures 2a, 2b. Results reveal that highest 1-day rainfall of 242.20 mm and lowest of 135 mm for a period of 30 years were observed in Jhelum and Gujjar Khan.
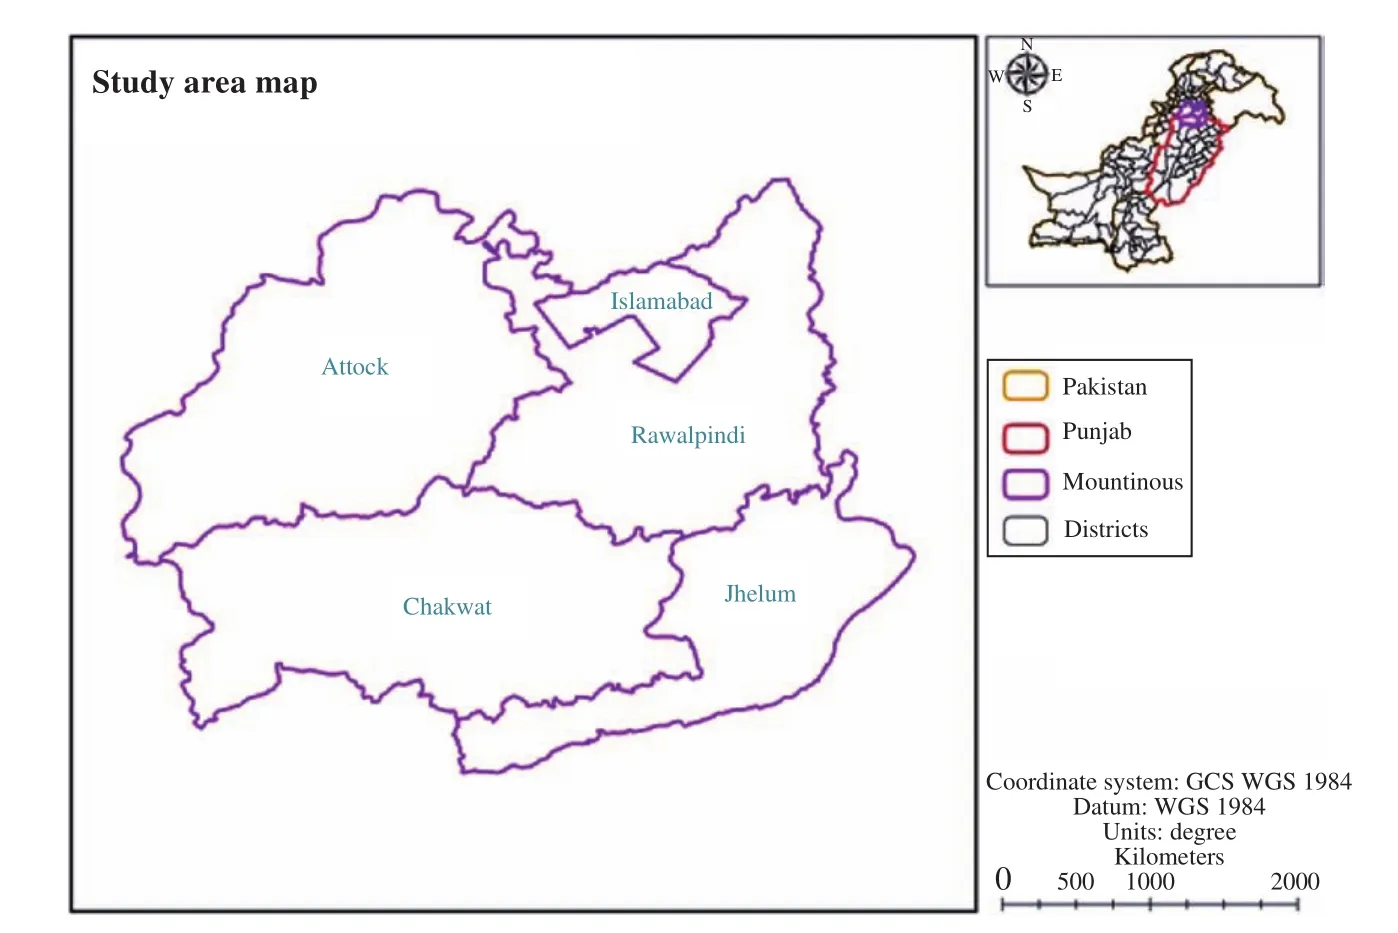
Figure 1 Location of mountainous region and stream network considered for the study area
2.1 Data consistency test
Data reliability and relative homogeneity was checked and matched with data taken from neighboring stations of the Water and Power Development Authority (WAPDA) for PMP accuracy. The double mass curve (DMC) approach was applied to check rainfall record consistency as presented in Equation(1). DMC is a very easy technique used by hydrologist to check for data correction. A small change in slope occurs when DMC is applied (average 0.16%)by chance or due to micro climatic properties, that is not a consistent significant period variation in the double mass curve. Moreover, precipitation data was collected using Excel-2013, as well as Easy Fit version 5.5 software which is very handy for interpreting and evaluating rainfall data. Arc Map10 software was also used to develop PMP isohyetal maps with the following formula:

wherePadandPobare adjusted and observed rainfall values, andMoslope of DMC corresponds to the rainfall value to which the observed rainfall value is being adjusted.
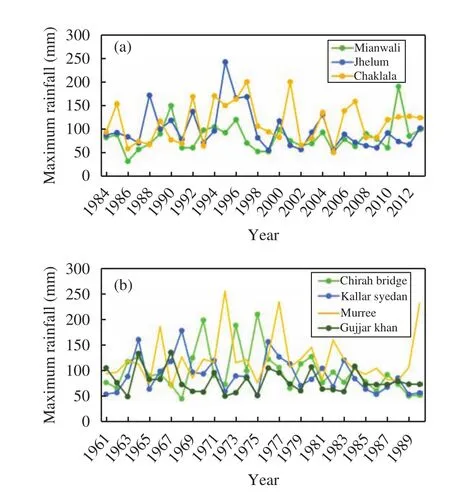
Figure 2 Twenty-Four highest precipitation for stations of Mianwali, Jhelum and Chaklala (a) Chirah Bridge, Kallar Syedan, Murree and Gujjar Khan (b)
3 Methodology
Statistical approaches (Hereshfield technique,Gumble method of extreme values and Log Pearson type- III distribution) were used for PMP estimation.Storm selection was done on a diurnal basis for PMP estimation. Storm analysis is comprised of storm hyetograph, mass curve construction, storm intensity,and maximum depth duration curve of the selected station.
The physical based hydro-meteorological approach was used for PMP appraisal in the study area.In the physical based approach, storm maximization was estimated using the moisture maximization method and wind moisture maximization of selected storms. Details of different approaches used in this study are described in the following sections:
3.1 Hershfield technique (statistical approach)
Statistical approaches are used for PMP appraisal when sufficient rainfall data is accessible for the target site (gauge/grid). Hershfield (1961a,b) developed and modified (1965) a procedure based on a frequency equation by Chowet al. (1988) as

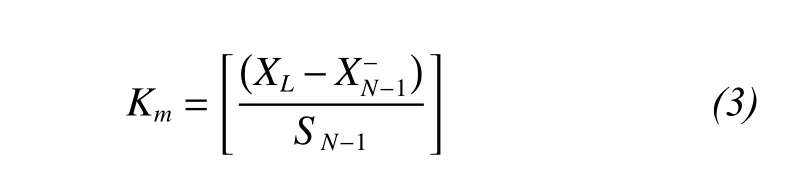
whereXLis the highest value of the annual series rainfall,andare mean annual maximum series and standard deviation of annual maximum series after removing the highest value.
3.1.1Frequency analysis using frequency factors
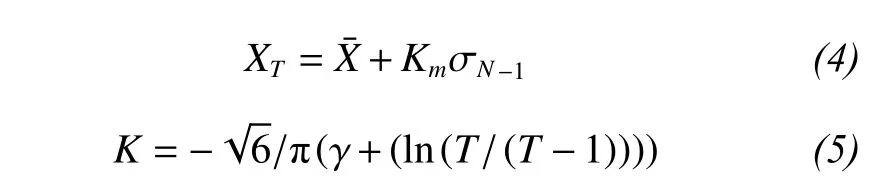
Chowet al. (1988) developed a relationship between frequency factor and return period for various probability distributions. Koutsoyiannis (2003,2004) used Gumble's Distribution (1958, 1960) for estimating extreme values given by the following equations.whereXTis the highest value of event,σN-1is standard deviation of the sample,Kmis called the frequency factor,γis the Euler number (0.577216),andTis the return period.
Ahmadet al. (2016) applied GOF tests such as Anderson Darling Test, Root Mean Square Error, and Kolmorgorv Smirnov test to annual daily maximum precipitation in Pakistan. They concluded that no single distribution could be considered as best fit distribution for all stations. Different GOF tests are ap-plied to various distributions such as Generalized Extreme Value, Gumble, LP-III, Normal, Log Normal,Generalized Logistic and Generalized Pareto distributions. Results reveal that Gumble and LP-III distribution give best fit results to annual daily maximum precipitation in Pakistan. Ahsanet al. (2016) applied various frequency distributions for estimation of discharge against different return periods which is used in development of an envelope curve for Jhelum and Indus River Basin in Pakistan. It was observed that Gumble distribution show reasonable trend analysis for all gauging stations compared with LP-III distribution. It was also concluded that LP-III distribution gave very low values of discharge at higher return periods compared to other distributions. Zakaullahet al. (2012) applied frequency analysis on runoff which is generated in the Jhelum River Basin and rainfall data. Four probability distributions (Gumble, Pearson Type III, LPIII and Log Normal distributions) were applied. Based on Chi-square test, it suggests that Gumble distribution is best fit for flood frequency analysis and as well as for rainfall. Olofintoyeet al.(2009) suggested that LP-III distribution performed best results to estimate peak rainfall by using the following formulas:
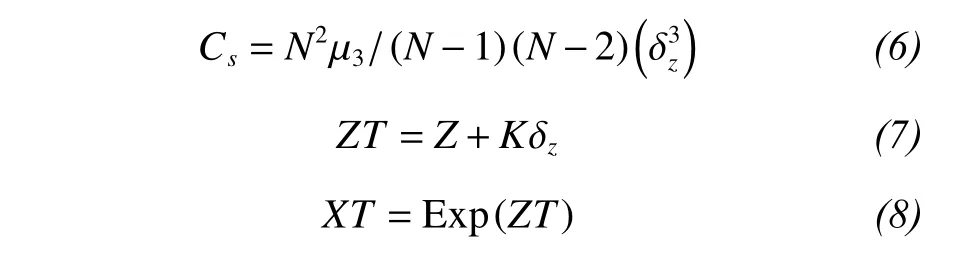
whereNrepresents total number of observation,Csis the coefficient of skewness,δzis standard deviation,μ3is variance,Kis frequency factor,ZTis one parameter (standard) distribution, andXTis the highest amount of rainfall. Presently, Gumble and LPIII distribution as well as GOF tests are applied for estimating the magnitude of daily maximum rainfall.
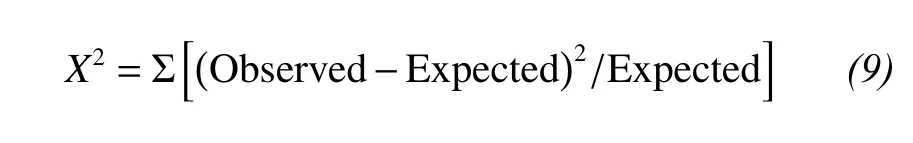
3.1.2Chi- Square goodness of fit test
There are several GOF tests but most commonly used test is chi-square for empirical data to specify theoretical frequency distribution. Oseni and Ayoola(2012) suggested using GOF tests such as chi-square and kolmogorov-smirnov applied to daily rainfall in IBADAN to check fitting analysis of statistical distribution. The equation used for chi-square test is as follows:
3.2 Hydro-metrological approach
A selection of major storms and storm analysis was used for PMP assessment. The physical approach was carried out using the following methods (1)Moisture maximization of storm, (2) Wind moisture maximization of storm.
3.2.1Storm model approach (moisture maximization method)
The moisture maximization (MM) method involves maximizing the meteorological conditions(e.g., water content) that control the occurrence of convective rainfall. In this approach, precipitable water is maximized in the air column above the target site. Moisture maximization method is a worldwide accepted procedure for PMP estimation (Fattahiet al.,2010). Surface dew point data was used to compute precipitable water in storm locations and this precipitable water was used to estimate PMP by moisture adjustment factor given below;
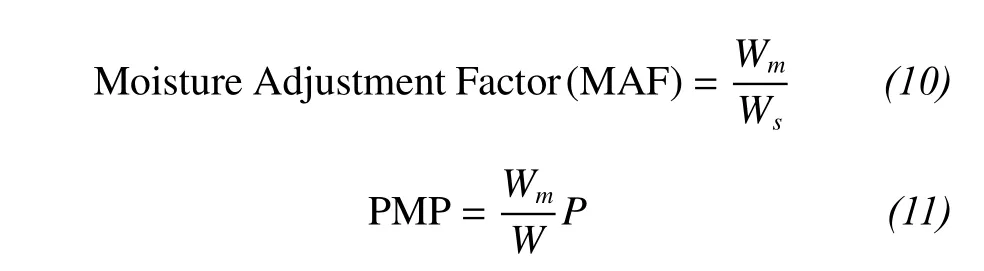
Smith WL (1966) developed the following equations forWestimation.

whereWm,WsandPrepresents precipitable water against highest dew point, 12-h persisting dew point and observed rainfall depth in mm, respectively. Theλsymbolizes the relationship between height of atmospheric column and water profile mathematically in form of an exponent of power law. The value ofλdepends on seasonal year and latitude of target location for observed storms (London, 1957). The termTdrepresents dew point surface temperature which is observed on storm day and ifTdrecord is not readily available then it can be calculated using the following equation.
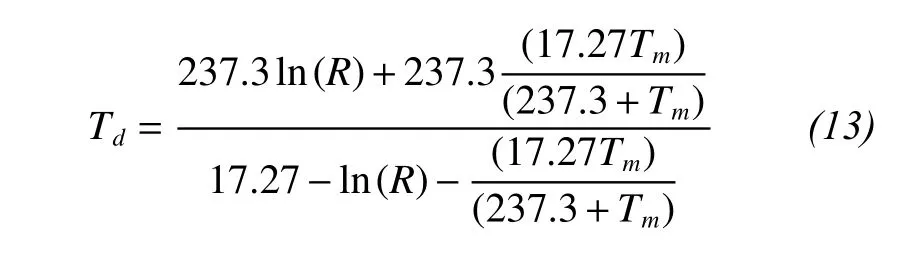
whereTmandRrepresents surface temperature maximum (in degree Celsius) and relative humidity,respectively.Wmestimates are based on the following equation.
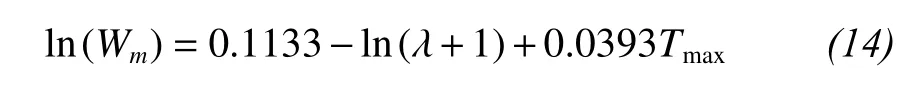
When surface dew point temperature value is at least 50 years long, thenTmaxis assumed to be highest historicalTdvalue corresponding to storm occurrence month (WMO, 1986).
3.2.2Wind-moisture maximization of storm
Calculated moisture maximization factor as mentioned above is multiplied to wind moisture maximization (WMM) adjustment factor to compute PMP.The formula for wind moisture maximization adjustment factor is given below:
Wind moisture maximization adjustment factor

whereM1is used for observed storms of maximum wind speed andM2is observed storm of 12-h persisting wind speed of storm.
3.2.3Isohyet Map
The isohyet map of the study area was produced by the Spline method using the GIS tool. Maximum precipitation maps at different return periods were developed which are useful in planning and management of various hydraulic structures for optimum utilization of water resources in the study area.
4 Results and discussions
Statistical and physical approaches were applied to daily precipitation data in mountainous regions in order to calculate the 1-day PMP. One-day PMP maps were constructed from the results obtained after analysis. Details about the application of these approaches are discussed in the following sections. Statistical are discussed in sections 4.1, 4.2, physical in section 4.3, and factor of safety in section 4.4. Subsequently, comparison and utilization of 1-day PMP maps appraisal based on statistical approach and physical approach is discussed in section 4.5.
4.1 Application of statistical approaches
Statistical approaches such as Hershfield method,Gumbel's distribution and LP-III distribution were used to determine PMP and 1-day maximum rainfall at various return periods. Estimated PMP for the study area varies from 175.00 mm to 302.10 mm as presented in Table 1. The highest one-day rainfall distribution of different months in a year is illustrated in Figure 3. Monthly distribution of precipitation is extremely useful for water resources development and management. It can be seen that the month of July receives the highest amount of precipitation as presented in Figure 3, and more than 60% rainfall is received in months of June, July, August and September. A pie chart shows that if water is stored during the highest precipitation months then stored water can be used for irrigation, domestic and stock purposes. It is inferred that water scarcity scenarios is due to lack of water management; so this study is very crucial and useful to diminish the water security issue.
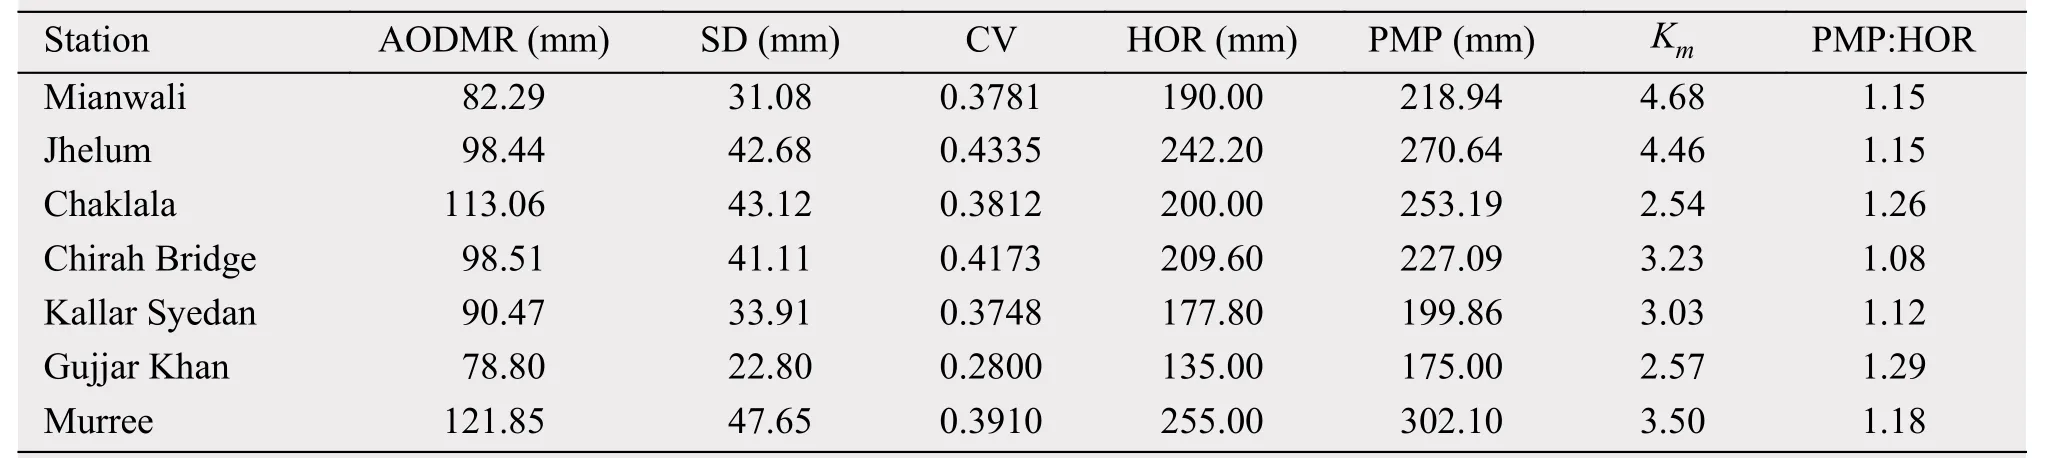
Table 1 Rainfall characteristic and PMP in study area
Tables 2 and 3 show the expected highest 24-hour precipitation, reduced variate, frequency and frequency factor using the Gumble and Log Pearson type-III distribution at different return periods. To study the GOF model, the coefficient of determination (R2) is an easy tool used by many professionals.The nomograph of highest 24-hour precipitation for various return periods up to 1,000 years was plotted which is used for estimation of 24-hour precipitation represented in Figure 4. The trend analysis was carried out for the highest 24-hour precipitation at all stations. In Mianwali Station, logarithm trend line givesR2value of 0.9987 in Gumble distribution.Whereas, logarithm and power trend line givesR2values of 0.9929 and 0.9284 in LP-III distribution. Results show that Gumble logarithm trend line value ofR2= 0.9987 is higher from the logarithm and power trend lineR2= (0.9929, 0.9284) values in LP-III distribution. Thus, it is inferred that Gumble distribution give better values ofR2compared withR2values of LP-III distribution in Mianwali as well as for other stations.
Chi-Square test for GOF (X2= Σ [(Observed-Expected)2/ Expected]) was also applied in Gumble and LP-III distribution. Results show that Chi-Square value in Gumble distribution is much better as compared to LP-III distribution as presented in Table 4.Chi-Square GOF test and R2value shows that Gumble distribution give efficient results as compared to LP-III distribution in the mountainous regions of Pakistan. The expected highest 1-day precipitation for 50 and 100 years return period in mountainous regions vary from 138-245 to 150-271 mm, respectively. The highest 75 mm to 114 mm precipitation can possibly occur in the study area at every two years.Durbude (2008) has recommended different return periods and PMP values for design of various soil and water conservation structures. Durbude (2008) further recommends that Stock water dams, field diversion, vegetated and terrace outlets, gully control structures and dams-storage having natural spillway could be designed at return periods of 25, 15, 10, 10-15 and 25-50 years. Accordingly, PMP at various return periods for different soils and water conservation structures were calculated for mountainous regions and presented in Table 5.
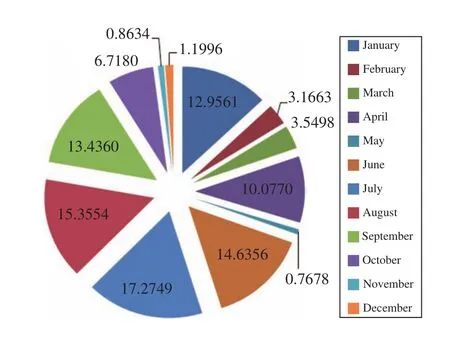
Figure 3 Monthly distribution of one-day highest rainfall during 30 years
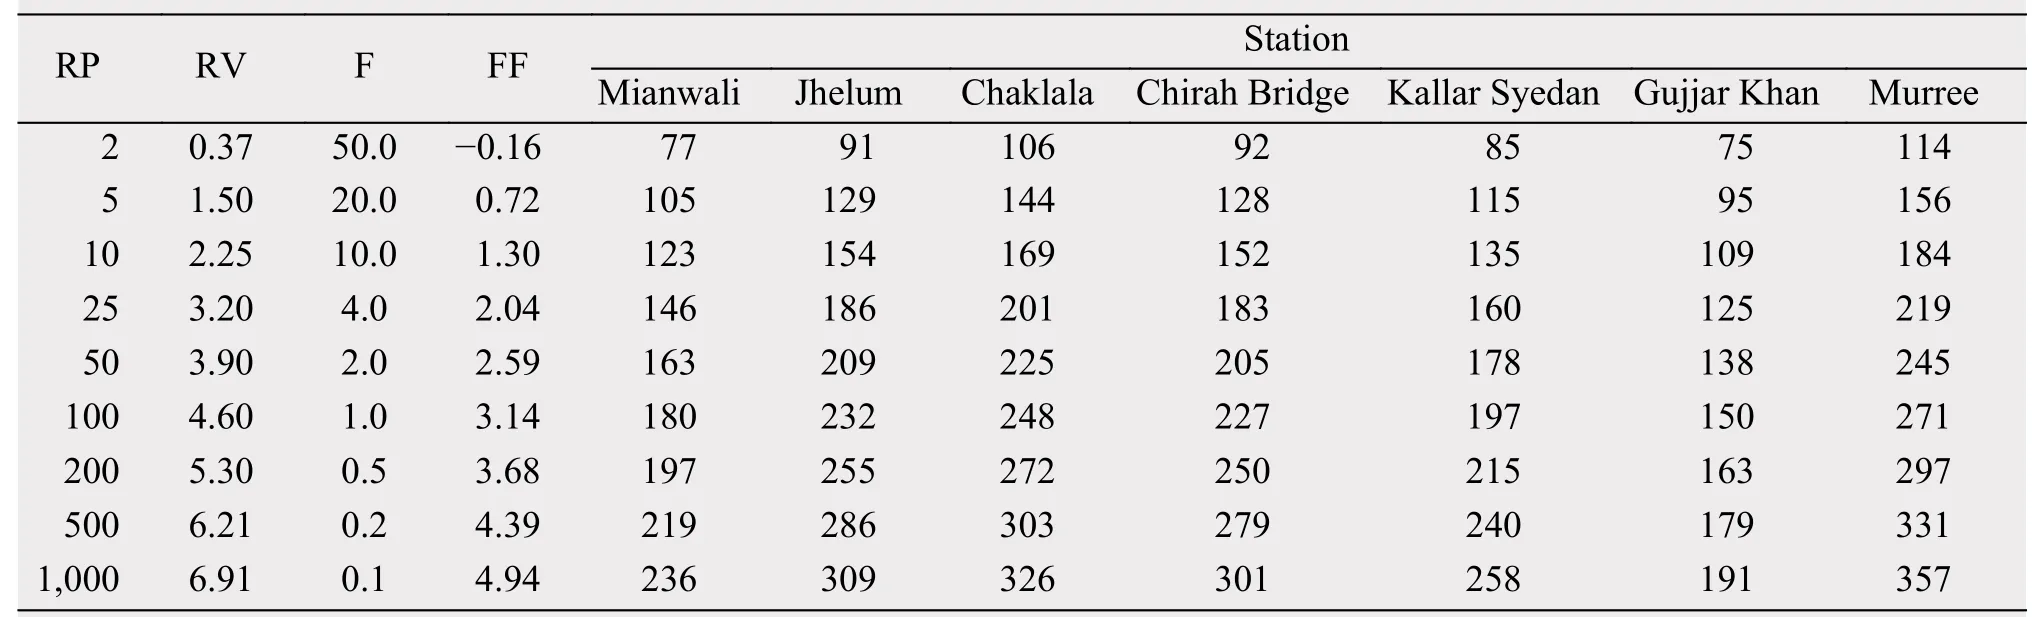
Table 2 Estimated maximum rainfall using Gumble's Distribution
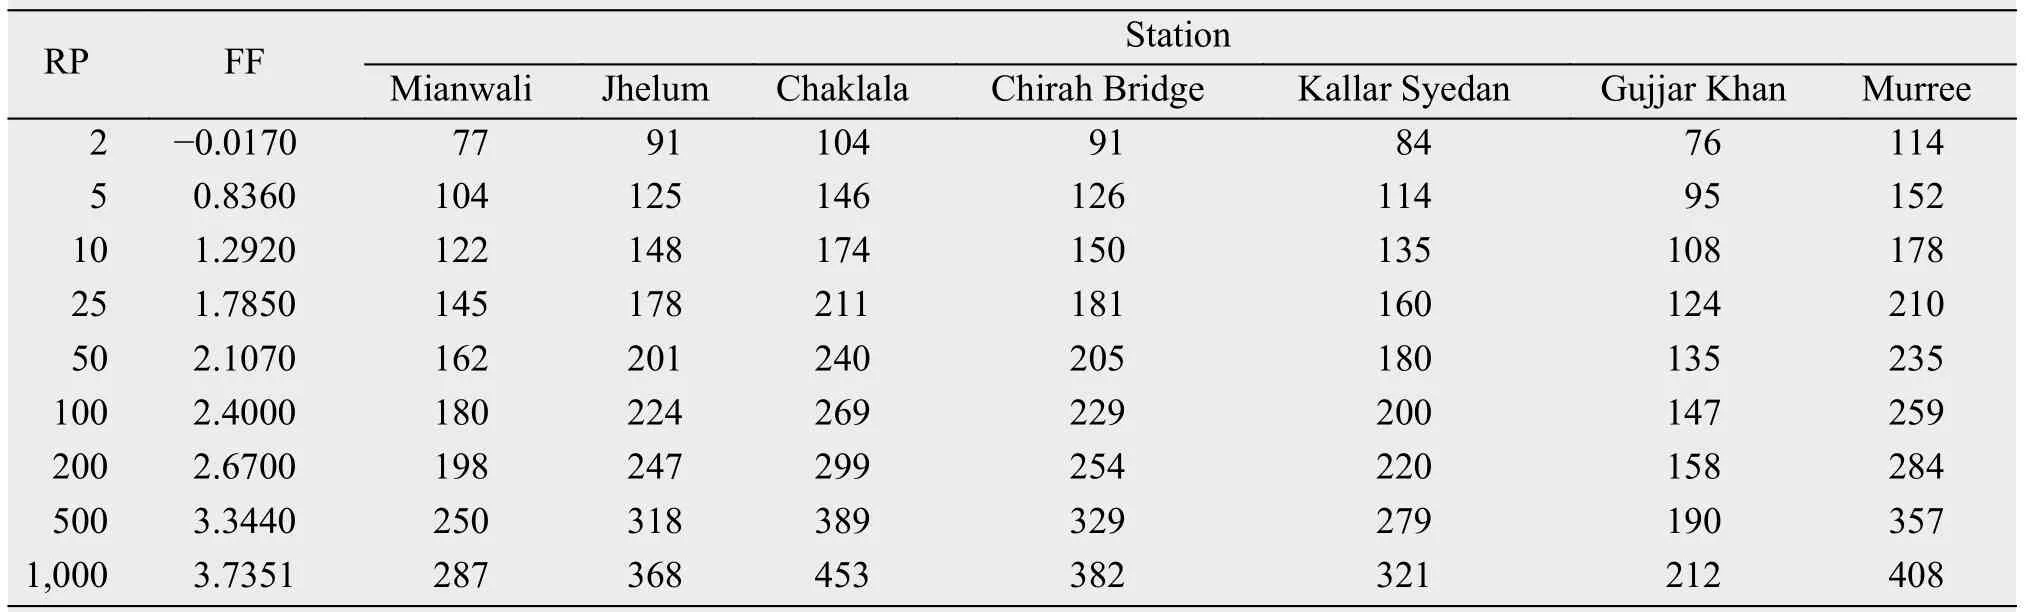
Table 3 Estimated maximum rainfall using Log Pearson type-III Distribution

Figure 4 Estimated maximum one-day rainfall for different return periods
4.2 Comparison of frequency factor (Km) with previous studies
Frequency factor (Km) values varies from minimum 2.54 (Chaklala station) to maximum 4.68 (Mianwali station) with an average value of 3.43 and coefficient of variance of 37.94%. Frequency factor variation is due to change in record length or micro cli-matic conditions of the rain gauge stations. Peak rainfall of rare magnitude occurred for a short duration event, called outlier. This outlier is compensated after adjustment of mean () and standard deviation (Sn) of annual series for peak observed precipitation (Hershfield, 1961b). TheandSnvary with increase of record length, because the frequency distribution of peak precipitation is skewed on right side which is adjusted for length of record (Hershfield, 1961b). Similarly, calculated PMP values are multiplied to the adjusted based on hourly data to true maxima values given in WMO manual.

Table 4 Chi-Square Goodness of fit test
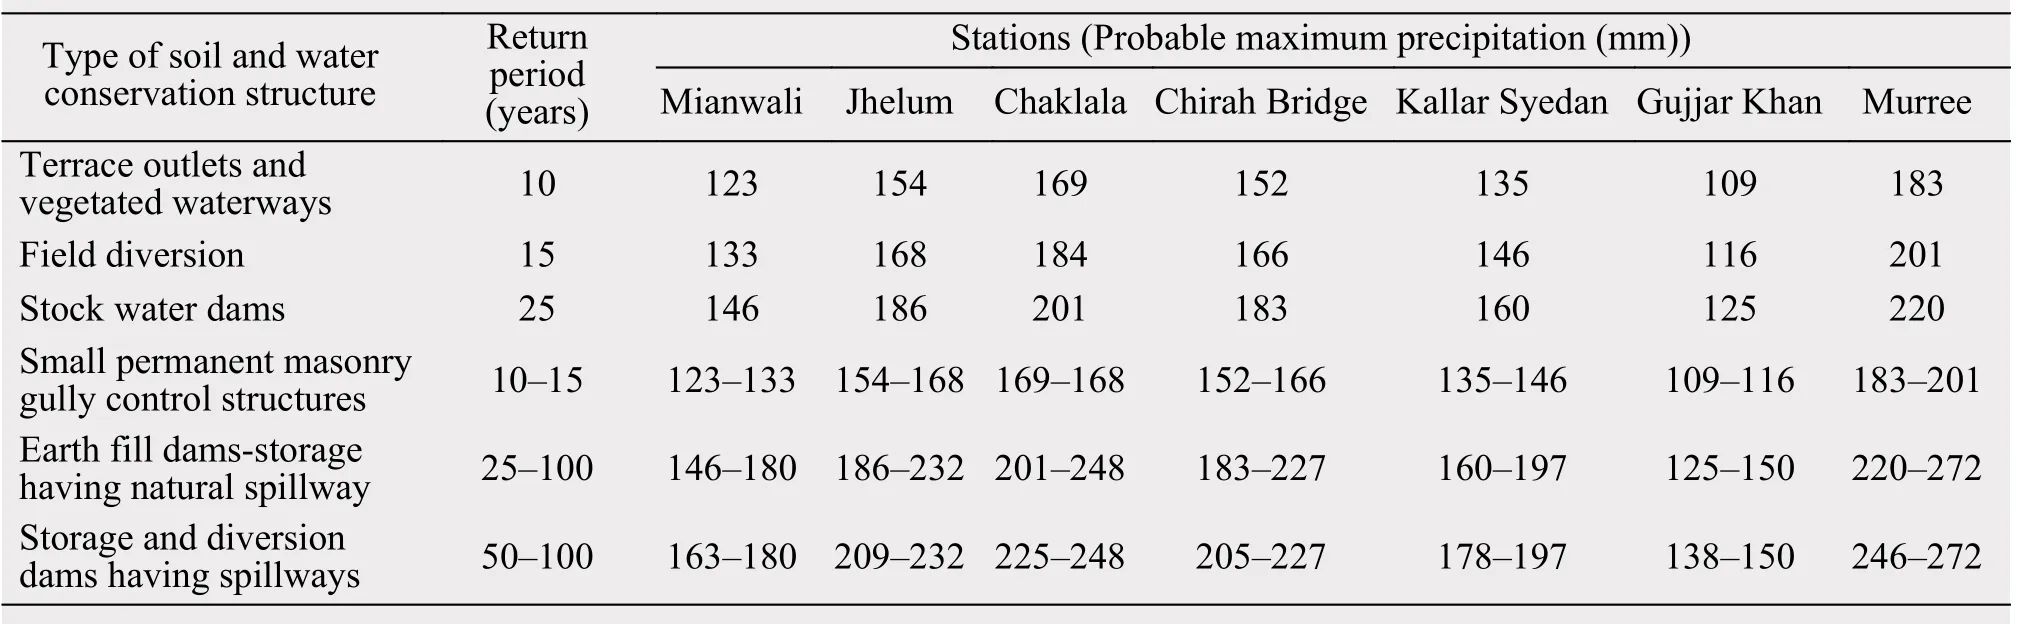
Table 5 The return period and PMP for design of various structures
The observed frequency factor enveloping (4.68)is 68.8%, 51.2%, 46.2%, 23.5%, 20.6%, and 8.23%variation from the Peak HershfieldKm, for Atrak Basin in Iran, and regions of Puigcerda, Spain, Jhalarapatan, India, Tigray, Ethiopia, and Cadaques, Spain,respectively (Table 6). The lower value of frequency factor from findings under local conditions is not significant for regions of Jhalarapatan, India, Tigray,Ethiopia and Cadaques, Spain. The variation in estimated frequency factor from Hershfield peakKmimplies that, considering (Km=15) for appraisal of probable maximum precipitation will give an overestimated value of PMP.
4.3 Application of Hydro-meteorological Approaches
Thirty-year (1980-2011) daily rainfall events were identified from daily rainfall data. Daily observations of relative humidity (R) were available andTdwere unavailable over the entire period.Tdvalue is computed from the values ofRusing Equation(12).Subsequently, computed values ofTdwere utilized to compute the precipitable waterWcorresponding to each daily precipitation events using Equation(11).To findWmappraisal corresponding to each of 30-year events by Equation(11),Tmaxis assumed to be one hundred year quintile computed which is based on historically monthly highest values ofTdcorresponding to the occurred event month, as available record is less than 50 years. For this purpose, Gumble distribution of extreme value was fitted to monthly highest value ofTd, Gumble distribution which was found to be suitable for chi square test and kolmorgive smirnov test at 95% confidence level. London (1957) suggested the value of power law exponentλto be 3.12.
For PMP estimation using hydro-meteorological approaches, storm analysis was done based on the storm hyetograph, development of mass curve, and high intensity storm with maximum depth duration analysis (Kennedy, 1982). Storm hyetograph for Mianwali and Chaklala station inferred that 22.7 mm/h and 11 mm/h maximum precipitation intensity was recorded. Subsequently, mass curve shows that 211 mm and 200 mm rainfall occurred in these two stations.Mass curve gives the cumulative precipitation where results show that that there are two intervals of precipitation in Mianwali station whereas only one period of interval is greater than 100 mm of rainfall. The second interval is less than 100 mm of rainfall with constant increase. Similarly, mass curve of Chaklala shows that there are three rainfall intervals whereas the first interval is greater than 100 mm rainfall,second interval with constant rainfall of 170 mm between 9 to 18 hours intervals, and third interval is varying rainfall of 170-211 mm between 18 to 24 hours. Hourly precipitation is used to plot the maximum depth and intensity duration curves for the selected storms. In Mianwali station, maximum intensity was observed to be 25 mm/h and the minimum intensity was observed to be 2.5 at 10 hours time period.The maximum depth of Mianwali Station was observed to be 210 mm with increasing steep slope.Table 7 shows that MMF is related with dew points temperatures. The maximum dew point temperatures observed were higher ranging from 24 °C to 26 °C.Thirty-year track record has been used for the estimation of MMF and WMAF, whereas there is no wind speed data available in other stations and only limited records for Kallar Syedan. The calculated moisture and wind moisture maximization factors for selected storms are used to compute PMP. The duration of estimated PMP is 24 hours for Mianwali and Chaklala areas. The values of these two factors for Mianwali(July 29, 2010) and Chaklala (July 24, 2001) are presented in Table 7. Results obtained from the calculation of PMP values in hydro-meteorological approaches show that PMP values estimated by wind moisture maximization method is substantially greater than PMP estimated by moisture maximization method and statistical method as presented in Table 8.
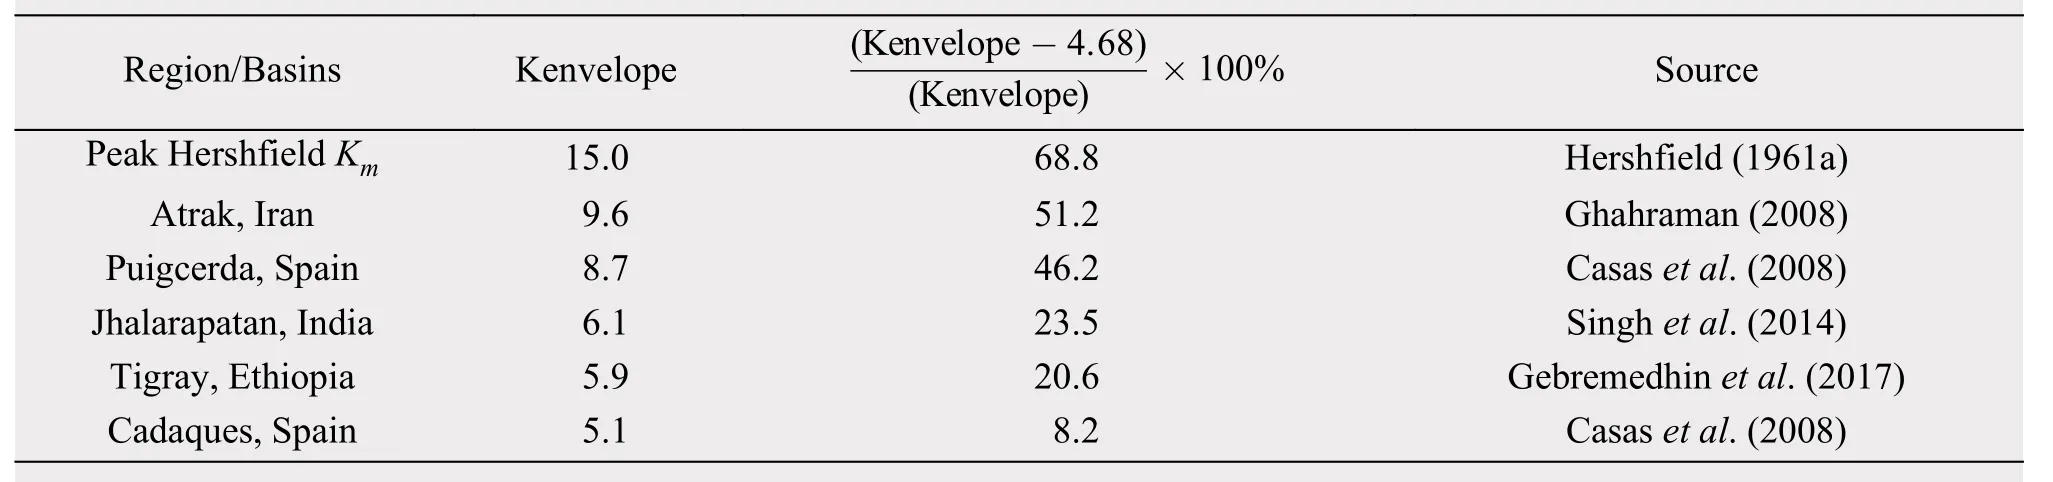
Table 6 The highest frequency factors for different regions
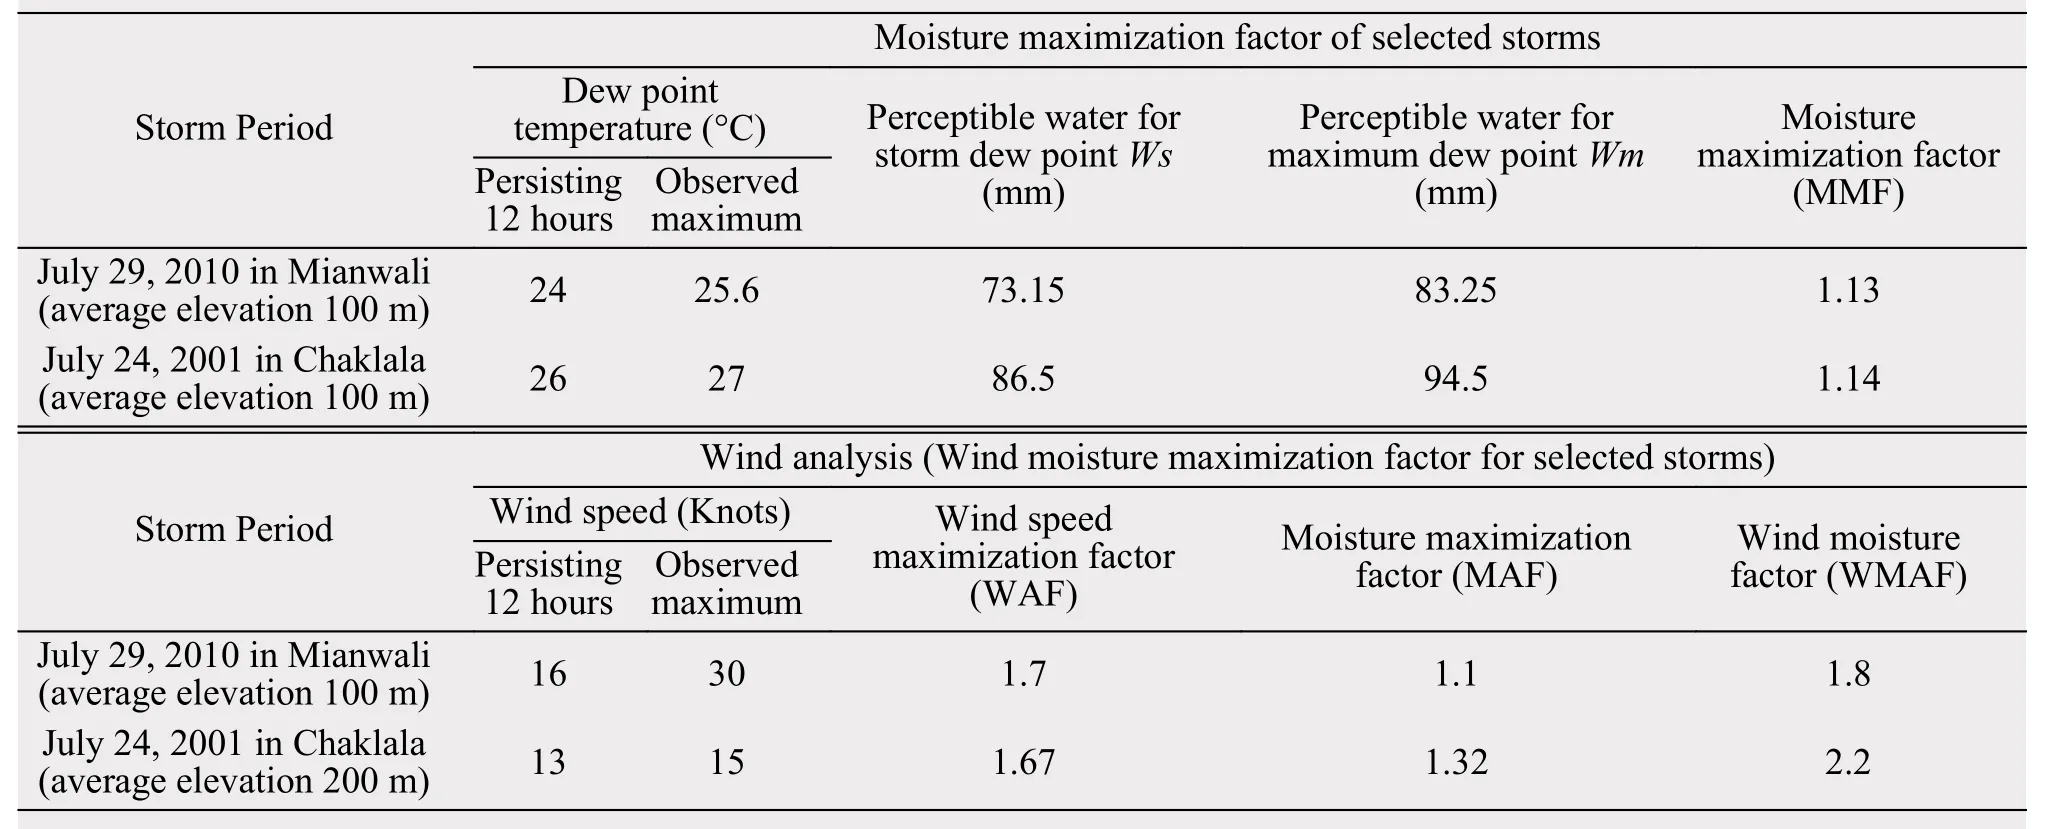
Table 7 Storm Model and Wind Moisture Maximization factor of selected storms
4.4 Factor of safety (PMP Ratio to design depth of rainfall at various return periods)
The estimated ratio of PMP to depth of rainfall at different return periods were computed and ratio varies from 2.97 (at 5 years) and 0.68 (at 1,000 years) are presented in Table 9.
Factor of safety (FOS) predicted PMP values around their corresponding ratio to design depths of rainfall at different return periods. FOS can be used for designing of hydraulic structures, with usual values of 1.5 to 2.0 for geotechnical design and 1.4 to 1.7 for structural engineering (Gebremedhinet al.,2017). It is concluded that estimated PMP is realistic for designing of various hydraulic structures for 10 and 50 years return periods, and designing against 5 years return period is stable but comparatively costly. It is also concluded that designing of hydraul-ic structures at 100, 1,000 and 10,000 years return periods are unreliable, therefore, PMP technique could resolve the limitations of commonly probabilistic methods.

Table 8 Estimated PMP by physical approaches
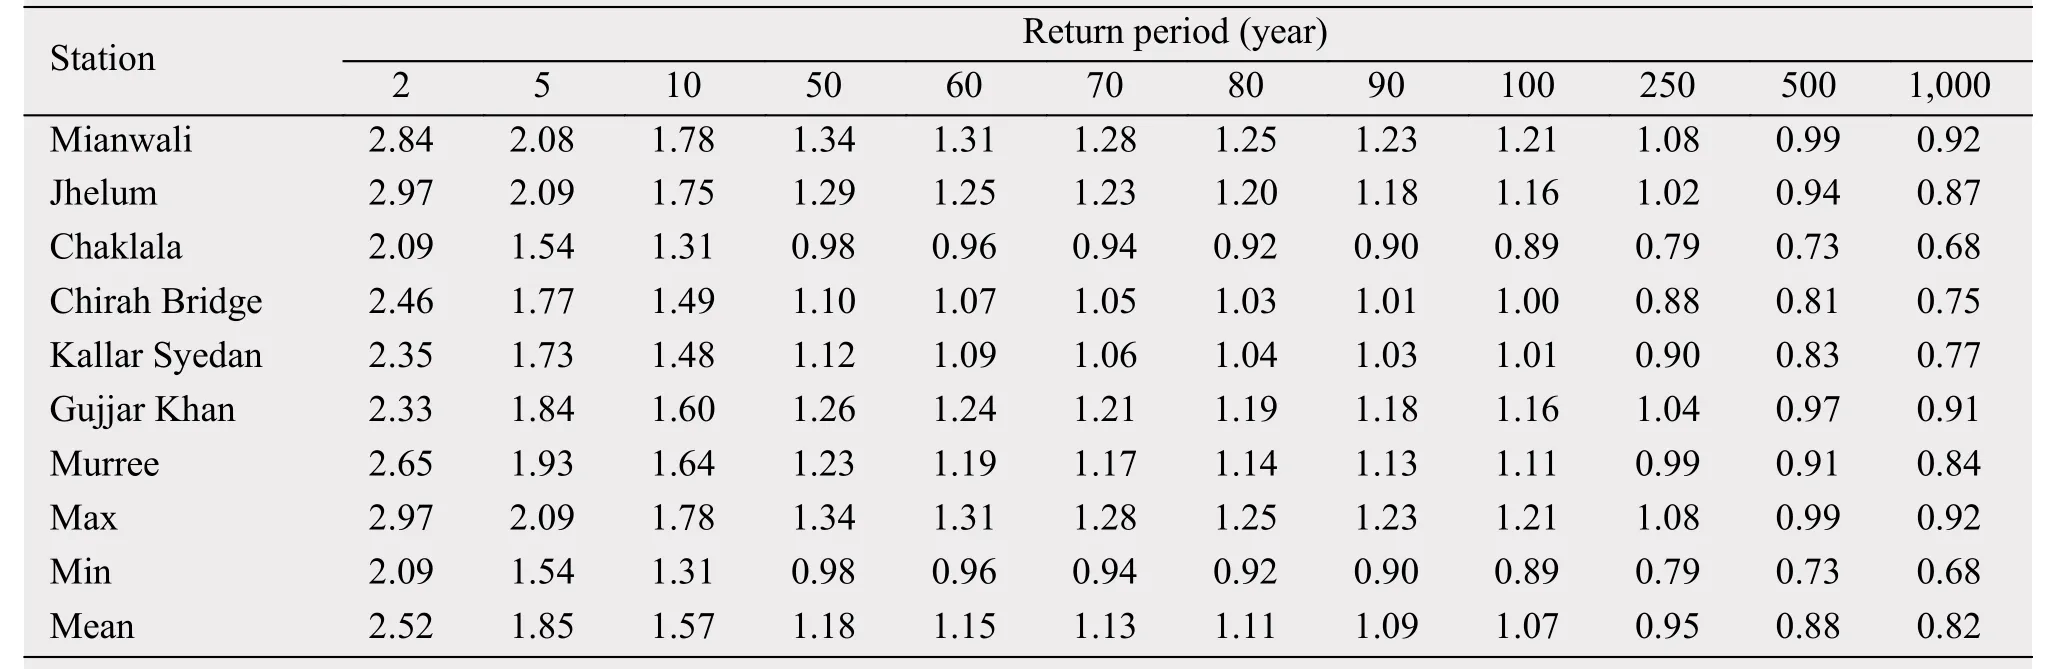
Table 9 PMP Ratio to design depth of rainfall at various return period
4.5 Comparison and utilization of 1-day PMP maps appraisal based on statistical approach and physical approach
From comparative studies, it is inferred that there is significant mismatch in PMP appraisal resulting from Hershfield, storm model and wind moisture maximization approaches as presented in Table 7. In general, PMP estimates using WMM tends to be more than the MM method and Hershfield approach. Subsequently, the Hershfield approach provides slightly more PMP values compared with storm model approach. Higher values of the WMM approach are due to sporadic weather events during the recorded period.It is advised that the record length should be considered while doing analysis and computation of PMP. It is suggested that a long record length will give reliable estimation of PMP as compared to short record length in the Hershfield technique. If long length of daily rainfall data is available, there could be variation inXb,SdandCvwhich provide better PMP values compared with short length of rainfall record. The record length does not affect MM and WMM approaches, and hydro-meteorological parameters data are required in selected storms for PMP estimation using the hydro-meteorological approach. Moisture maximization approach is very accurate, fast and preferred over WMM and Hershfield techniques, if meteorological parameters data of selected storm are easily available. The Hershfield technique is used when recording rain gauges are not available in the study area, and rainfall data consistency should be checked by using double mass curve with reference to neighboring stations.
The isohyetal map showing spatial rainfall distribution of PMP for one-day duration was developed as well (Figure 5a). Isohyetal maps provide fast estimation of PMP for ungauged catchments and generated by means of Arc GIS software which helps to understand rainfall distribution. Isohyetal maps at different return periods are very useful for proper designing,planning and management of various water resources projects. The north region has a PMP around 302 mm and PMP varies from 150 mm to 320 mm in mountainous regions of Pakistan. In the central area PMP is about 230 mm and rapidly increases to 300 mm as the altitude increases, south of the study area PMP declines to about 150 mm. Figure 5b shows that PMP values at 20 return period varies from 121 mm to 201 mm. PMP values varies from 150.83 to 161.81 mm in Fateh Jangh and Kallar Syedan, and varies from 143.92 mm to 150.83 mm for Chakwal and Talagang station. PMP values varies from 168.72 to 176.25 mm for Chirah Bridge, and 176.35 to 184.41 mm for Jhelum. Figure 5c shows that PMP values range from 138 mm to 233 mm at 50 return period. PMP values were 155.97, 167.56, 179.90, 194.49 and 233.39 mm for Gujjar Khan, Talagang, Fateh Jang, Jhelum and Murree station, respectively for 50 return period. Similarly, Figure 5d represent PMP values that varies from 150 mm to 258 mm at 100 return period in the study area. PMP values were 169.93, 182.65, 190.27,204.68, 234.77, 234.77, and 258.08 mm for Gujjar Khan, Chaklala, Kallar Syedan, Fateh Jang, Chirah Bridge, Talagang, and Murree stations, respectively at 100 return period. These isohyetal maps are complete data banks which is suitable for detailed projects of specific storm studies and for speedy appraisal of design storms for smaller or medium catchments.
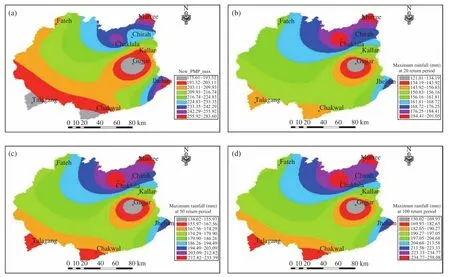
Figure 5 Probable maximum precipitation (PMP) map of study area (a), Maximum rainfall (mm) at 20 return period (b),Maximum rainfall (mm) at 50 return period (c), Maximum rainfall (mm) at 100 return period (d)
5 Conclusions
In this paper, comparison between statistical and meteorological approaches was carried out for PMP estimation. Hershfield, storm model and wind moisture maximization approaches were applied to examine the 1-day PMP maps for mountainous regions based on daily precipitation data. PMP maps were utilized to compute 1-day PMP for catchments to seven stream gauges in the study region. Results reveal that PMP estimate using WMM tends to be more than the MM method and Hershfield approach. Subsequently, the Hershfield approach gives more PMP values compared to storm model approach. Further detailed research for upcoming publications on 1-day PMP is underway in conjunction with rainfall-runoff(R.F-R.O) modeling to arrive at PMF estimates for mountainous regions of Pakistan.
This research work was part of Msc thesis and supported by Centre of Excellence in Water Resources Engineering, University of Engineering and Technology Lahore. We also express special appreciation to Pakistan Meteorological Department (PMD) for providing climatic data to conduct this research.
Adebayo A, 2007. Adaptive water management system in Nigerian Peri-urban Center. In: Proceedings of the 4th Annual Association of Nigerian Geographers Conference. Abuja, Nigeria, 2007.
Ahmad I, Abbas A, Saghir A,et al., 2016. Finding probability distributions for annual daily maximum rainfall in Pakistan using linear moments and variants. Polish Journal of Environmental Studies,25(3): 925-937. DOI: 10.15244/pjoes/61715.
Ahsan H, Nabi G, Boota MW,et al., 2016. Development of envelope curve for Indus and Jhelum River basin in Pakistan and estimation of upper bound using envelope curve. Journal of Himalayan Earth Sciences, 49(1): 98-109.
Al-Mamun A, Hashim A, 2004. General long duration probable maximum precipitation (PMP) isohyetal map for Peninsula, Malaysia.Journal of Spatial Hydrology, 4(1): 156-179.
Breuer LJ, Kreue?s RK, 1985. Berechnung und Prognose des PMP im Emscher- und Lippegebiet (Calculation and forecast of PMP for drainage basin of Emscher River and Lippe River). Emschergenossenschaft und Lippeverband, Ww-Bericht 84/02.
Casas MC, Rodríguez R, Prohom M,et al., 2011. Estimation of the probable maximum precipitation in Barcelona (Spain). International Journal of Climatology, 31(9): 1322-1327. DOI: 10.1002/joc.2149.
Casas MC, Rodriguez R, Nieto R,et al., 2008. The Estimation of Probable Maximum Precipitation. Trends and Directions in Climate Research: Annals of the New York Academy of Sciences, 1146:291-302.
Chang WL, Hui TW, 2001. Probable Maximum Precipitation for Hong Kong. Reprint 482. Hong Kong: Hong Kong Observatory.
Chavan SR, Srinivas VV, 2015. Probable maximum precipitation estimation for catchments in Mahanadi river basin. Aquatic Procedia,4: 892-899. DOI: 10.1016/j.aqpro.2015.02.112.
Chow VT, Maidment DR, Mays LW, 1988. Applied Hydrology. New York: McGraw-Hill.
Collier CG, Hardaker PJ, 1996. Estimating probable maximum precipitation using a storm model approach. Journal of Hydrology,183(3-4): 277-306. DOI: 10.1016/0022-1694(95)02953-2.
Durbude DG, 2008. Estimation of probable maximum precipitation for planning of soil and water conservation structures. Journal of Soil and Water Conservation, 17: 31-35.
Fattahi E, Noorian AM, Noohi K, 2010. Comparison of physical and statistical methods for estimating probable maximum precipitation in southwestern basins of Iran. Desert, 15(2): 127-132.
Fernando WCDK, Wickramasuriya SS, 2011. The hydro-meteorological estimation of probable maximum precipitation under varying scenarios in Sri Lanka. International Journal of Climatology, 31(5):668-676. DOI: 10.1002/joc.2096.
Foufoula-Georgiou E, 1989. A probabilistic storm transposition approach for estimating exceedance probabilities of extreme precipitation depths. Water Resources Research, 25(5): 799-815. DOI:10.1029/WR025i005p00799.
Gebremedhin YG, Quraishi S, Itefa H, 2017. Development of one day probable maximum precipitation (PMP) and isohyetal map for Tigray Region, Ethiopia. Global Journal of Science Frontier Research: H Environment & Earth Science, 17(2): Online ISSN:2249-4626 & Print ISSN: 0975-5896.
Ghahraman B, 2008. The estimation of one day duration probable maximum precipitation over atrak watershed in Iran. Iranian Journal of Science & Technology, Transaction B, Engineering, 32(B2):175-179. DOI: 10.22099/IJSTC.2008.722.
Gumbel EJ, 1958. Statistics of Extremes. New York: Columbia University Press.
Gumbel EJ, 1960. Statistics of Extremes. 2nd. New York: Columbia University Press.
Hauck E, 1983. Beitrage zur Wahl des Bemessungshochwassers und zum vermutlich grobten Niederschlag (Contribution to the choice of maximum flood and to the probable maximum precipitation),DVWK-Schriften 36. Hamburg: Paul Parey.
Hershfield DM, 1961a. Rainfall frequency atlas of the United States.Technical Paper No. 40. Washington DC: Weather Bureau, United States Department of Commerce.
Hershfield DM, 1961b. Estimating the probable maximum precipitation. Journal of the Hydraulics Division, 87(HY5): 99-106.
Hershfield DM, 1965. Method for estimating probable maximum precipitation. Journal of the American Water Works Association, 57:965-972.
Hershfield DM, 1981. The magnitude of the hydrological frequency factor in maximum rainfall estimation. Hydrological Sciences Bulletin, 26(2): 171-177. DOI: 10.1080/02626668109490874.
Kennedy MR, 1982. The estimation of probable maximum precipitation in Australia- Past and current practice. J-GLOBAL ID:200902015090151362, Reference number: 83A0151396, Page:26-52.
Khoso S, Wagan FH, Tunio AH,et al., 2015. An overview on emerging water scarcity in Pakistan, its causes, impacts and remedial measures. Journal of Applied Engineering Science, 13(1): 35-44.DOI: 10.5937/jaes13-6445.
Koutsoyiannis D, 2003. On the appropriateness of the Gumbel distribution for modelling extreme rainfall. Proceedings of the ESF LESC Exploratory Workshop. Bologna, Italy: European Science Foundation.
Koutsoyiannis D, 1999. A probabilistic view of Hershfield's method for estimating probable maximum precipitation. Water Resources Research, 35(4): 1313-1322. DOI: 10.1029/1999WR900002.
Koutsoyiannis D, 2004. Statistics of extremes and estimation of extreme rainfall: II. Empirical investigation of long rainfall records.Hydrological Sciences Journal, 49(4): 610. DOI:10.1623/hysj.49.4.591.54424.
London J, 1957. A study of the atmospheric heat balance. Final Report,Contract No. AF 18(122)-165. New York University, College of Engineering, Research Div., University Heights, New York, pp. 99.
Naseer E, 2013. Pakistan Water Crisis Special Report Part 1. Spearhead Research Special Report. (2013-12-31). http://spearheadresearch.org/wp-content/uploads/2014/04/Water-Crisis-2.0.pdf.
Olofintoye OO, Sule BF, Salami AW, 2009. Best-fit Probability distribution model for peak daily rainfall of selected Cities in Nigeria.New York Science Journal, 2(3): 1-12.
Oseni BA, Ayoola FJ, 2012. Fitting the statistical distribution for daily rainfall in IBADAN, based on chi-square and Kolmogorovsmirnov goodness-of-fit tests. European Journal of Business and Management, 4(17): 62-70.
Papalexiou SM, Koutsoyiannis D, 2006. A probabilistic approach to the concept of Probable Maximum Precipitation. Advances in Geosciences, 7: 51-54. DOI: 10.5194/adgeo-7-51-2006.
Rakhecha PR, Kenndey MR, 1985. A generalised technique for the estimation of probable maximum precipitation in India. Journal of Hydrology, 78(3-4): 345-359. DOI: 10.1016/0022-1694(85)90112-X.
Rakhecha PR, Deshpande NR, Soman MK, 1992. Probable maximum precipitation for a 2-day duration over the Indian Peninsula. Theoretical and applied climatology, 45(4): 277-283. DOI:10.1007/BF00865518.
Rezacova D, Pesice P, Sokol Z, 2005. An estimation of the probable maximum precipitation for river basins in the Czech Republic.Atmospheric Research, 77(1-4): 407-421. DOI: 10.1016/j.atmosres.2004.10.011.
Roth R, Schulze O, 1991. Taximeter Gebietsniederschlag (Probable maximum precipitation) DVWKSchriften 97. Hamburg: Paul Parey.
Ruhe W, Roth R, Tetzlaff G, 1985. Berechnung des vermutlich grofiten Niederschlages (PMP) im Einzugsgebiet der M?hnetalsperre (Calculation of probable maximum precipitation(PMP) for the drainage basin of M?hne River reservoir installation). Hannover: University of Hannover.
Schreiner LC, Reidel JT, 1978. Probable maximum precipitation estimates. United States east of the 105thmeridian. Hydrometeorological Report No. 51. Washington DC: United State National Weather Service.
Singh B, Prakash S, Singh J, 2014. Estimation of probable maximum precipitation for one day duration in jhalarapatan region of Rajasthan. Indian Journal of Soil Conservation, 42(2): 130-134.
Smith WL, 1966. Note on the relationship between total precipitable water and surface dew point. Journal of Applied Meteorology,5(5): 726-727. DOI: 10.1175/1520-0450(1966)005<0726:NOTRBT>2.0.CO;2.
Svensson C, Rakhecha PR, 1998. Estimation of probable maximum precipitation for dams in the Hongru river catchment, China. Theoretical and Applied Climatology, 59(1-2): 79-91. DOI:10.1007/s007040050014.
Wiesner CJ, 1970. Hydrometeorology. London: Chapman and Hall,232.
WMO, 1973. Manual for Estimation of Probable Maximum Precipitation. WNO-No. 332, Report No. 1.
WMO, 1986. Manual for Estimation of Probable Maximum Precipitation. Operational Hydrology Report No. 1, WNO-No. 332. 2nd ed.Geneva: World Meteorological Organization.
WMO, 2009. Manual on Estimation of Probable Maximum Precipitation. WNO-No. 1045. 3rd ed. Geneva: World Meteorological Organization.
Zakaullah, Saeed MM, Ahmad I,et al., 2012. Flood frequency analysis of homogeneous regions of Jhelum River Basin. International Journal of Water Resources and Environmental Engineering, 4(5):144-149. DOI: 10.5897/IJWREE12.013.
 Sciences in Cold and Arid Regions2018年1期
- Sciences in Cold and Arid Regions的其它文章
- An improvement of soil temperature simulations on the Tibetan Plateau
- Effects of freeze-thaw cycles on soil N2O concentration and flux in the permafrost regions of the Qinghai-Tibetan Plateau
- Applicability of an ultra-long-range terrestrial laser scanner to monitor the mass balance of Muz Taw Glacier,Sawir Mountains, China
- High-resolution mass spectrometric characterization of dissolved organic matter from warm and cold periods in the NEEM ice core
- Precipitation isotopes in the Tianshan Mountains as a key to water cycle in arid central Asia
- From highly polluted inland city of China to "Lanzhou Blue":The air-pollution characteristics