
Interannual variation of nutrients along a transect across the Kuroshio and shelf area in the East China Sea over 40 years*
2018-04-02 03:03:54HUYingying胡瑩英GUOXinyu郭新宇ZHAOLiang趙亮
關鍵詞:趙亮
HU Yingying (胡瑩英) GUO Xinyu (郭新宇) ZHAO Liang (趙亮)
1 Center for Marine Environmental Studies, Ehime University, Matsuyama 7908577, Japan
2 Key Laboratory of Marine Environment and Ecology, Ministry of Education, Ocean University of China, Qingdao 266100,China
3 College of Environmental Science and Engineering, Ocean University of China, Qingdao 266100, China
4 College of Marine and Environmental Sciences, Tianjin University of Science and Technology, Tianjin 300457, China
1 INTRODUCTION
Marginal seas of the Northwest Pacific Ocean exhibit high primary and secondary productivity,which is supported by high nutrient concentrations(Hama et al., 1997; Gong et al., 2003). These are generally important fishing grounds, and millions of people along the coasts make a living from the seas.However, fisheries cannot be maintained without new production, which relies upon external source of nutrients (Chen, 2008). Therefore, studies of spatialtemporal variations in nutrient concentration in the marginal seas of the North Pacific Ocean make significant contributions to both the shore-side ecosystem and the economy.
The important role of nutrients in the ocean has spurred much attention from social and scientific standpoints, and much scientific research on nutrients in the ocean has been conducted starting several decades ago. Taking the East China Sea as an example,early research on nutrient concentration was mostly confined to riverine exports or to the estuaries and coastal areas (Lü et al., 1985; Huang et al., 1986; Hu et al., 1990). Wang (1991) produced a Marine Atlas,which is one of the most comprehensive reports on the spatial distribution of nutrients in the East China Sea, the Bohai Sea, and the Yellow Sea. Based on this atlas, Chen (2009) produced several maps of nutrient distributions (nitrate, phosphate and silicate) in the surface and bottom layers in summer and winter in the East China Sea with additional information from Korea, Taiwan and Japan.
Although we have some fundamental information on the distribution of nutrients and seasonal variations,we have little information on long-term trends. There are only a few published reports that address this issue. Guo et al. (2012) used in-situ data from 88 cruises along transect PN from 1987 to 2009 and found an increasing nitrate concentration averaged along the transect. Lui et al. (2014) analyzed the same data and found that while nitrate and phosphate concentrations in the Kuroshio Intermediate Water(KIW) have increased, the dissolved oxygen (DO)concentration has decreased starting as early as 1982.Aoyama et al. (2008) found that nutrient concentration in the upper 200 m has been decreasing while dissolved oxygen content and sea water temperature have been increasing in the upper 200 m in the main stream of the Kuroshio in the East China Sea during the period of 1950 to 2004. Moreover, almost none of published reports examine interannual variation of nutrients.
This study examines seasonal and interannual variation of temperature, salinity, DO, nitrate and phosphate levels from 1970 to 2013 along the transect in the East China Sea that is identified as section PN.Correlations between PDO and the other variables are made to find relationships in interannual variations between North Pacific Ocean and East China Sea.
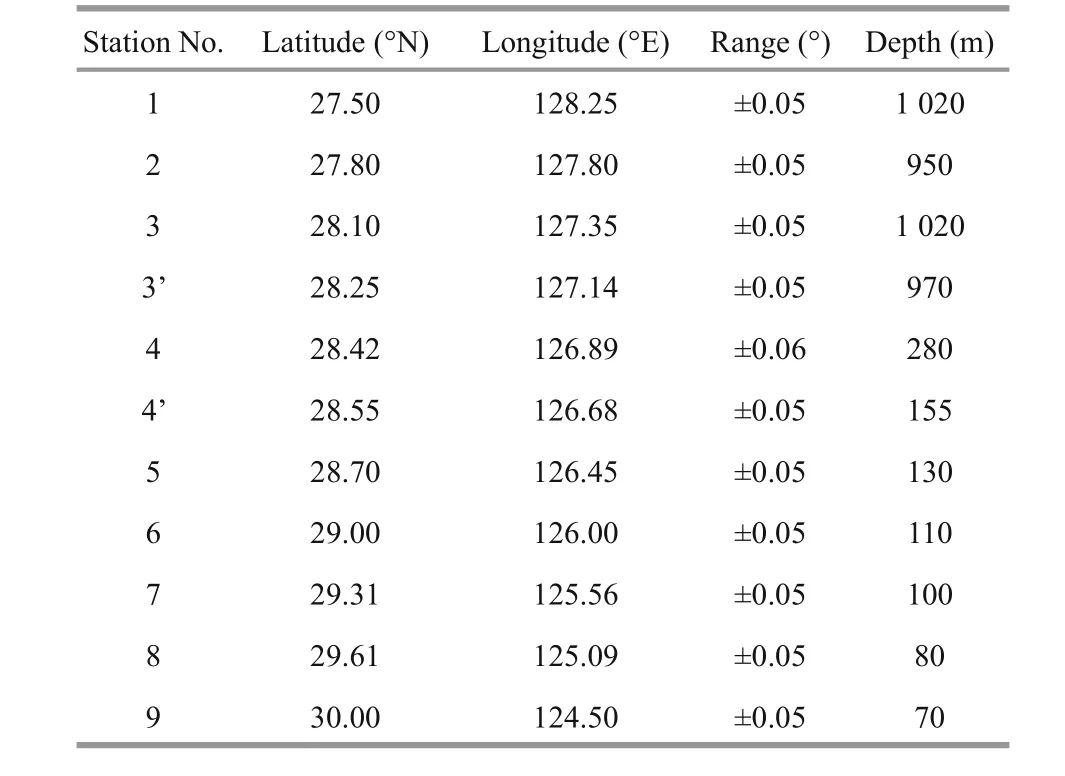
Table Locations and water depth at stations along section PN
2 DATA AND METHOD
Oceanographic and marine meteorological observation data from Japan Meteorological Agency(JMA) surveys conducted in the western North Pacific and in the seas adjacent to Japan by JMA research vessels from 1970 to 2013 were used in this study. In consideration of the study purpose, 11 stations along the classical PN section having locations and depths shown as Table 1 were chosen (Fig.1a).
Surveys were conducted four times per year along section PN starting from April 1972, except for Stn. 3’and 4’ where observations were started from July 1977. From October 1996, observations at Stn. 7 to 9 were discontinued (Fig.1b).
Most observations included measurements of water temperature, salinity, dissolved oxygen,phosphate, nitrate and chlorophyll a. We used temperature, salinity, dissolved oxygen, phosphate and nitrate in this study. Before further analysis of the data, several data processing steps were conducted to all parameters. Here we chose temperature as an example to explain the data processing procedure:
1. Linear interpolation of data into standard levels.The observation data were not taken at exactly standard depths. So we used data at depths less than 10 m as surface data. And linear interpolated data to standard depths of 10 m, 20 m, 30 m, 50 m, 75 m,100 m, 125 m, 150 m, 200 m, 250 m, 300 m, 400 m,500 m, 600 m, 700 m and 800 m.
2. Calculation of seasonal variation. All data from the same depth and collected in the same calendar month were averaged (pink line in Fig.2b).
3. Seasonal variation correction. Monthly averages(Fig.2b) were subtracted from raw data (Fig.2a) from the same month. In Section 3.1, we used results in January, April, July and October from this procedure to represent spatial distributions of each parameter in winter, spring, summer and autumn.
4. Annual variation correction. The average of monthly anomalies in the same year gives the annual average anomalies (pink line in Fig.2c).
5. Smoothed averages (5-year smoothed averages)were calculated to evaluate long-term variation of annual average anomalies (pink line in Fig.2d).
3 RESULT
3.1 Spatial distributions of parameter values
Seasonal variations of temperature and salinity(Fig.3a–h) are almost identical to the findings of Hinata (1996). In winter (Fig.3a), water temperature was vertically uniform due to strong mixing from Stn.5 to 9 on the continental shelf. A warm core corresponding to the Kuroshio was observed in layers shallower than 100 m from Stn. 2 to 4’. Compared to the mean water temperature during 1972 to 1993(Hinata, 1996), the 22°C isotherm expanded eastward to Stn. 2. In the layer deeper than 200 m from Stn. 2 to 4, the thermocline was slightly elevated toward the continental shelf. In spring, the water temperature was nearly the same as in winter in the surface layer on the continental shelf while it decreased considerably in the bottom layer (Fig.3b). In summer, a clear thermocline formed over the continental shelf(Fig.3c). Sea surface temperature was more than 28°C and showed less horizontal diff erence (Fig.3c)compared to in spring (Fig.3b) and winter (Fig.3a). In autumn, water temperature became vertically uniform in layers shallower than 50 m over the continental shelf due to the increase in vertical mixing (Fig.3d).As solar input decreased in autumn, sea surface temperature decreased compared to that in summer.
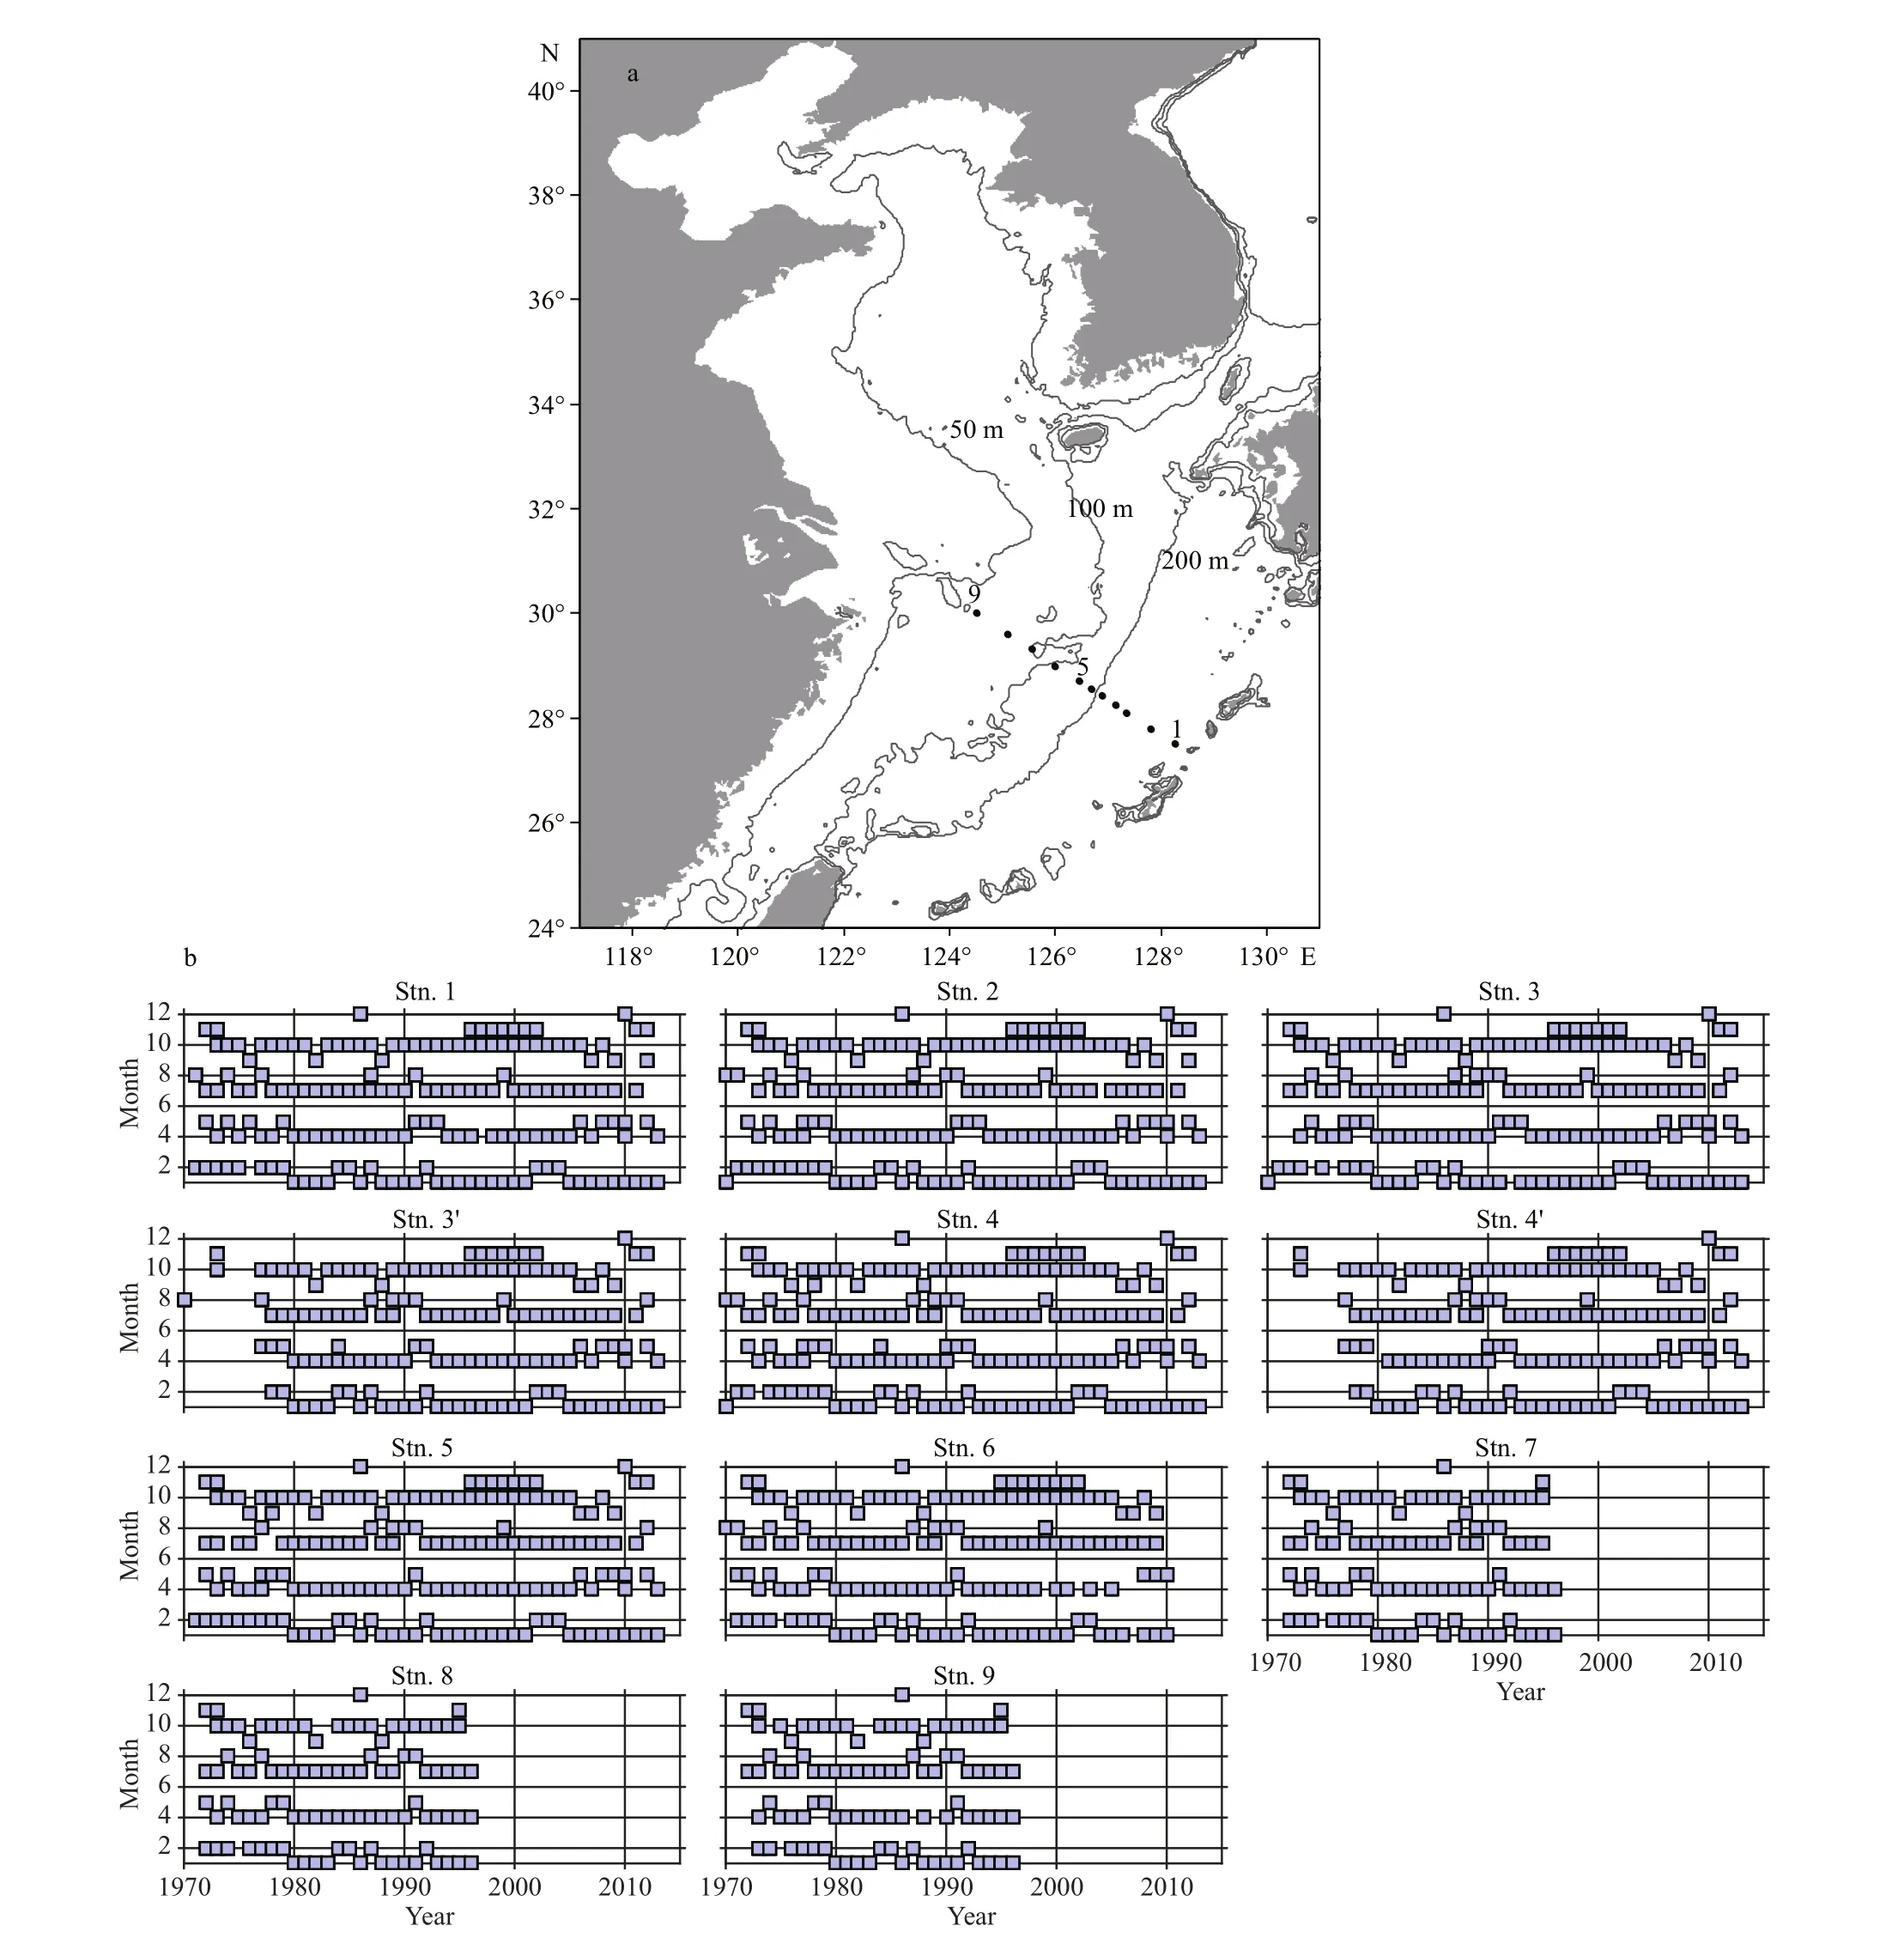
Fig.1 a. map of study area showing station locations (filled circles) along section PN. Contours indicate isobaths of 50, 100 and 200 m; b. timing of temperature observations over the range of years
Mean salinity along section PN is shown in Fig.3e–h. Salinity over the continental shelf was vertically uniform in winter when it exceeded 34, the maximum of the four seasons (Fig.3e). Maximum salinity occurred in layers between 100 and 250 m,which represent the Kuroshio subsurface water(Fig.3e). In spring, salinity on the continental shelf decreased due to the increase of river discharge and increase of precipitation (Fig.3f). In summer, salinity above the halocline was much lower compared to in winter and spring while salinity below the halocline was almost the same as that in other seasons (Fig.3g).In autumn, the eff ect of Changjiang diluted water was smaller, and salinity over the continental shelf increased compared to that with summer (Fig.3h).
DO results (Fig.3i–l) also showed clear seasonal variation on both the continental shelf and Kuroshio region. DO was highest in spring on the continental shelf, especially at the surface (more than 260 μ mol/L)due to high primary production (Fig.3j). The second highest DO levels appeared in winter because of mixing and lower water temperature, which leads to higher saturated dissolved oxygen (Fig.3i). In deeperwater, DO decreases and is the lowest (<100 μ mol/L)at Stn. 3’ (depth, 800 m). Similar to distributions observed for water temperature and salinity, DO contours increased slightly toward the continental shelf.

Fig.2 Temperature data with data processing
For nitrate, higher concentrations were observed in winter on the shelf region (>1 μ mol/L, Fig.4a). As water temperature increases, production becomeshigher, and nitrate concentration in the euphotic layer decreases (Fig.4b). On the shelf bottom, high nitrate concentration is evident closer to the continental shelf than from the Kuroshio region. In spring, summer and autumn, the bottom water of the shelf had a higher nitrate concentration of 5–10 μ mol/L, which is larger than in the winter. In deeper water, nitrate increases and even exceeds 10 times that in the surface layer.
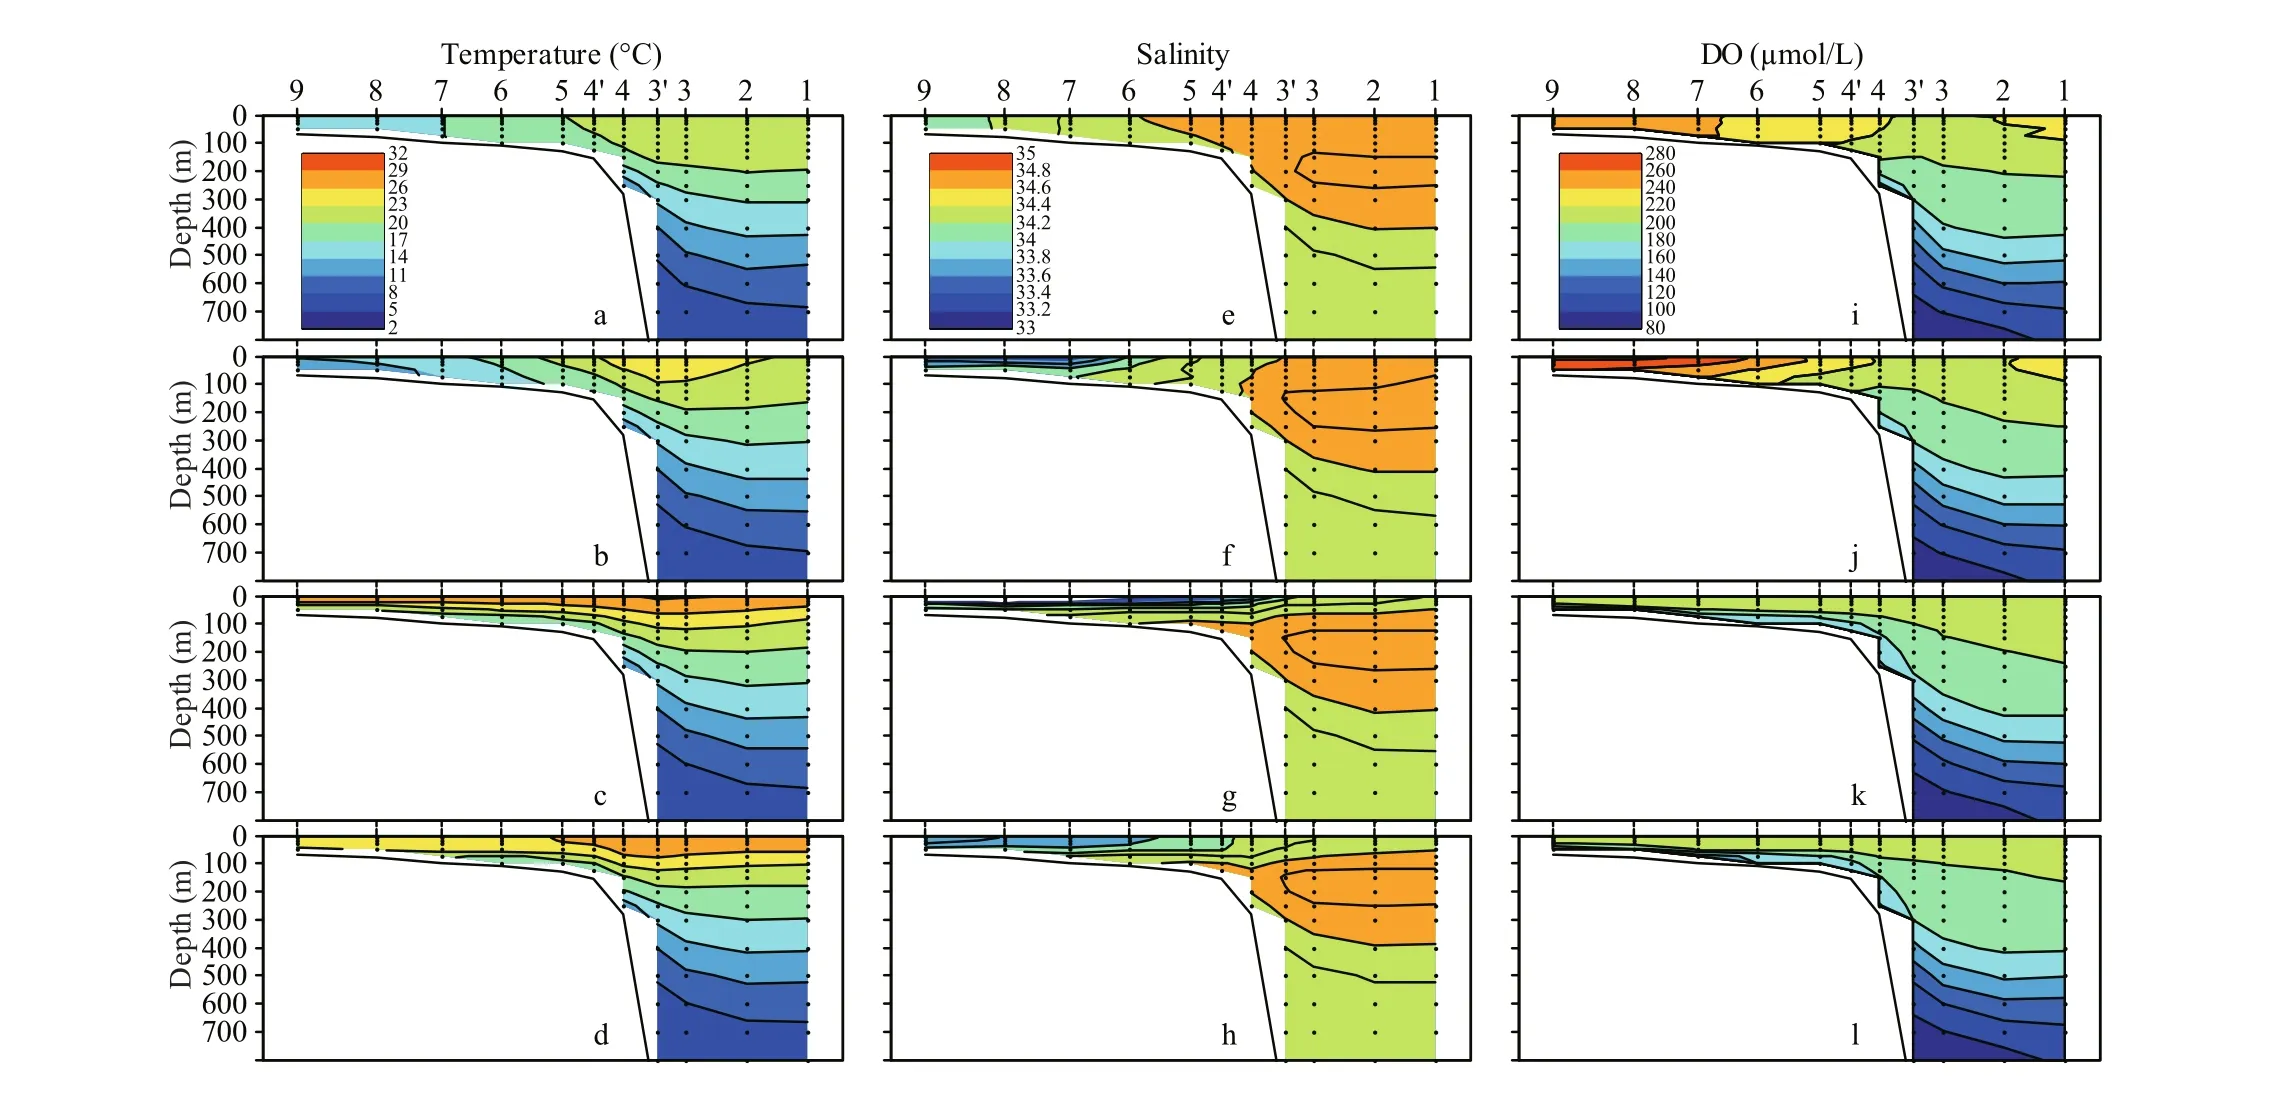
Fig.3 Average values over 1973 to 2013 along section PN and depth for (a–d) temperature, (e–h) salinity, (i–l) DO in January(row 1), April (row 2), July (row 3) and October (row 4)
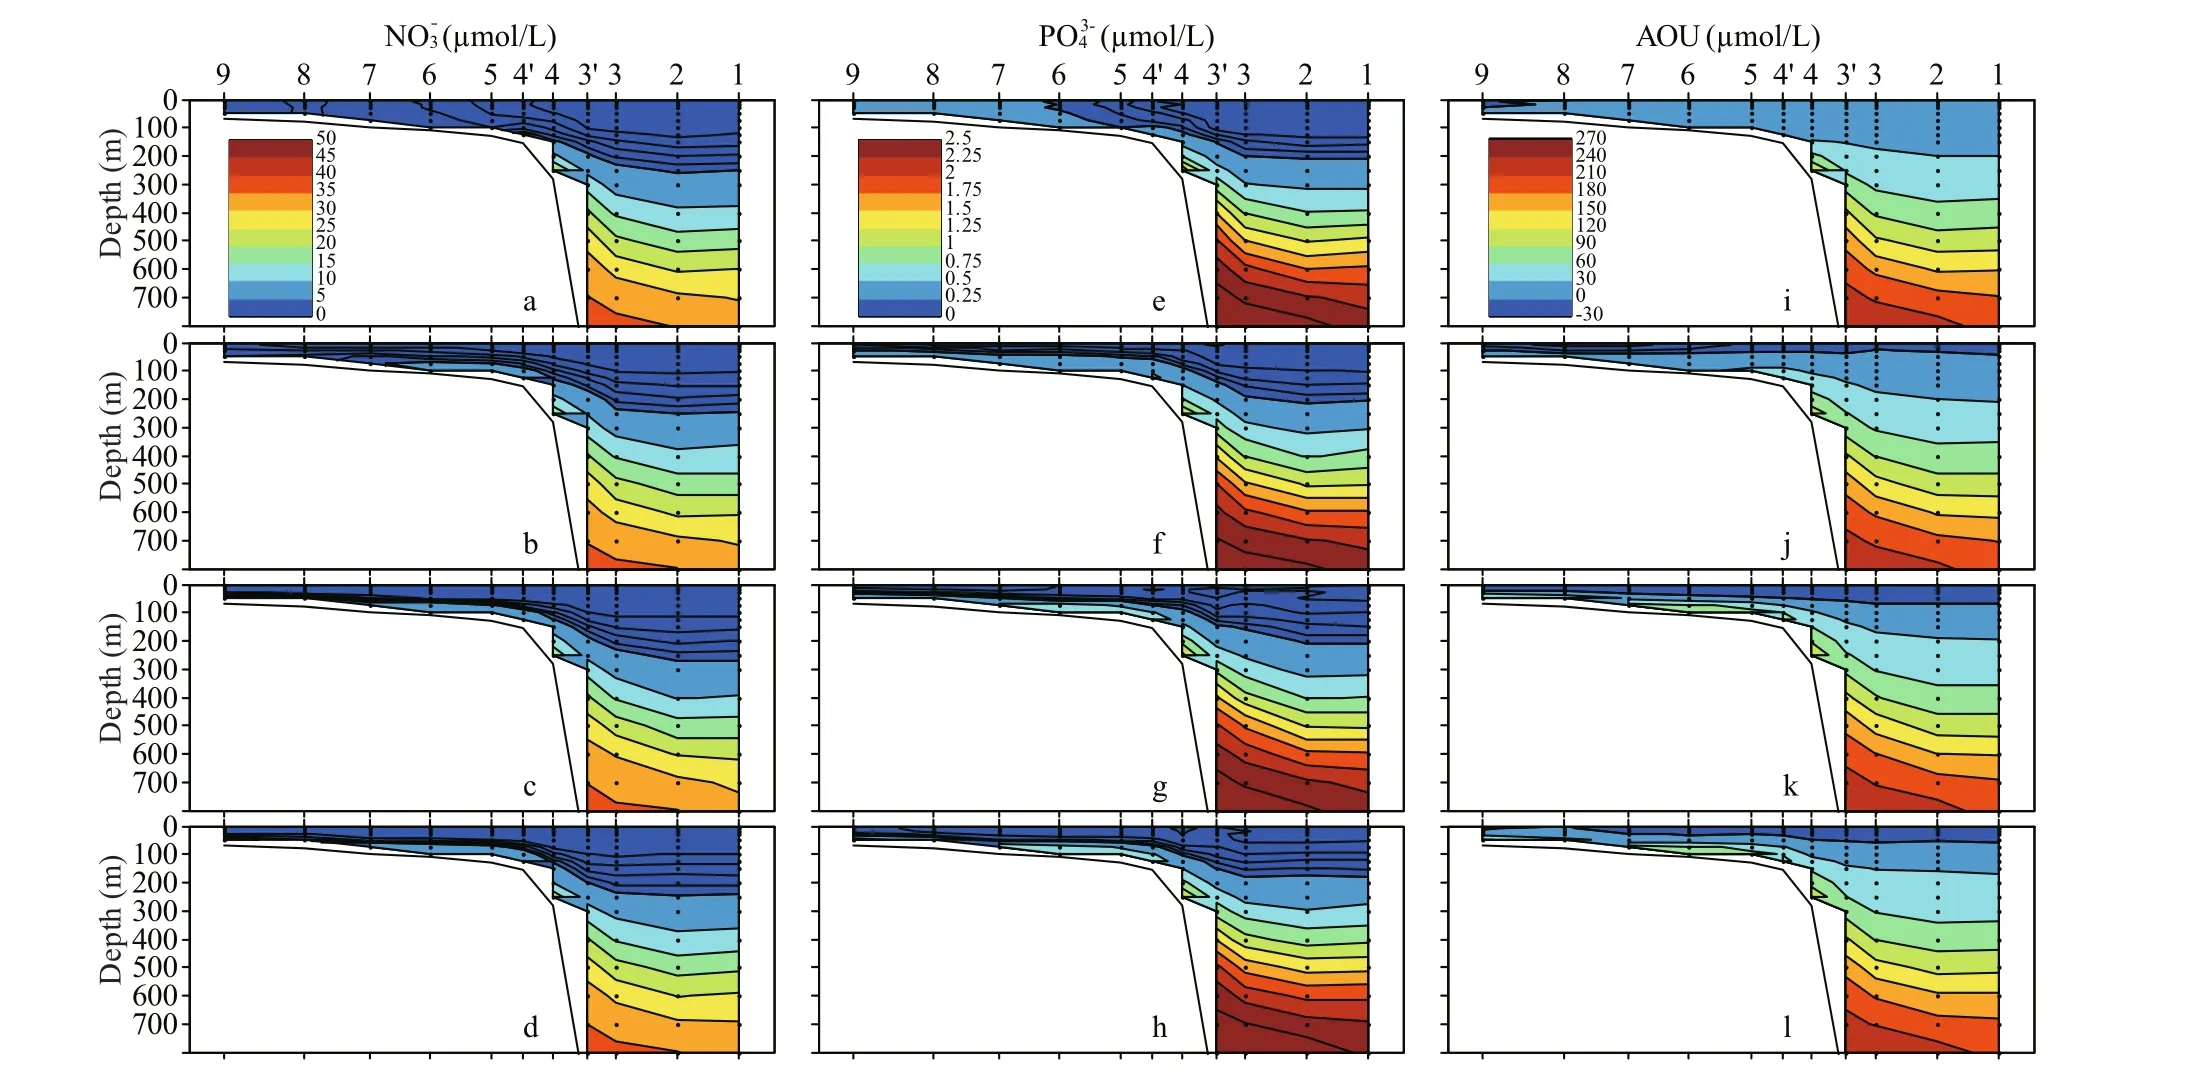
Fig.4 Average values over 1973 to 2013 along section PN and depth for (a–d) nitrate, (e–h) phosphate, (i–l) AOU in January(row 1), April (row 2), July (row 3) and October (row 4)
Spatial distribution of phosphate was similar to that of nitrate. Over the four seasons, shelf region(Stn. 6–9) had the highest phosphate concentration(0.25–0.5 μ mol/L) in winter, and shelf bottom water had the highest phosphate concentration (0.5–0.75 μ mol/L) in summer and autumn.
Apparent oxygen utilization (AOU) is defined as the diff erence between O2' and O2, where O2' is the amount of oxygen the water would hold if it is in equilibrium with the atmosphere at the temperature and salinity of the water and O2is the dissolved oxygen actually measured in the water sample. AOU can represent how much dissolved oxygen respiration occurred in the water. Results show that a low value on the surface, which can be less than 0 μ mol/L, is a result of primary production being greater than consumption. There was no significant seasonal variation in the deep layers.
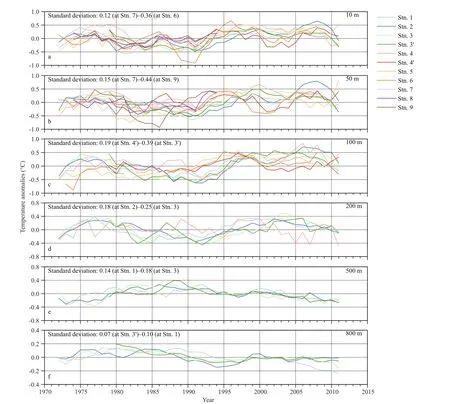
Fig.5 Interannual variations of temperature along section PN by depth
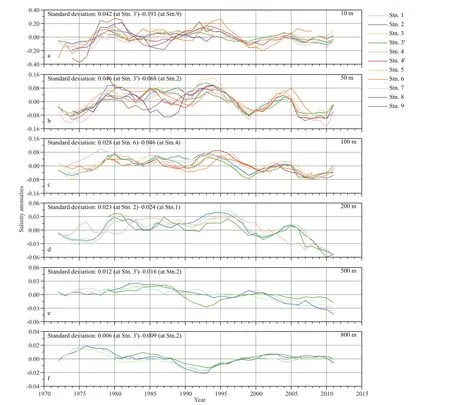
Fig.6 Interannual variations of salinity along section PN by depth
3.2 Interannual variation
Using 5-year smoothed averages for each parameter, interannual variations of each variable were examined at depths of 10, 50, 100, 200, 500 and 800 m in this study. Water temperature at depths of 10–200 m showed a similar pattern. Water was relatively warm around 1975 to 1980 and 1990 to 2005 while relatively cold in 1972, 1980 to 1990 and after 2008. Water temperature on the continental shelf showed a slightly diff erent pattern, especially around year 1985, when water temperature at 50 m at Stn. 9 reached a low value. Water temperature at 500 m was increasing before the late 1980s and decreasing after the late 1980s.
The magnitude of interannual variation is represented by the standard deviation. Large interannual variation in water temperature was found at the surface (largest value, 0.44°C at 50 m at Stn. 9)and lowest (0.07°C) at 800 m at Stn. 3’.
Interannual variation of salinity is shown in Fig.6.For depths shallower than 100 m, there were three high salinity periods around 1980, 1993 and 2004.Despite these three short high salinity periods, salinity showed an obvious increasing trend before 1993 and a decreasing trend after 1993. At deeper layers,changes in salinity showed diff erent patterns: at 500 m, increasing before 1985 and decreasing afterward;but at 800 m, a high in 1976 and a low in 1993 followed by an increasing trend. If we focus on the years after 2005, salinity in shallow layers was less than that at 100 m increasing slightly, while salinity in deeper layers (more than 200 m) was decreasing.
The largest magnitude of interannual variation in salinity was found on the surface at Stn. 9 because this area can be influenced by Changjiang diluted water, which has a much lower salinity than Kuroshio water. At greater depths, the magnitude of the variation decreases and is at the smallest at 800 m.
DO in Kuroshio surface and subsurface water was lowest around 1979, similar to the pattern of DO in surface water in the shelf region (Fig.7). DO increaseduntil 1990. In the bottom water of the shelf region(50 m at Stn. 7–9), DO anomalies suddenly decreased after 1988/1989 from +5 μ mol/L to -5 μ mol/s within 3 years, while at 50 m in Stn. 1–6, DO decreased slightly from 1990 to end of the 1990s. DO at 0–200 m was the highest around 2005, decreased from 2005 to 2010 and increased after the 2000s. From 200 to 800 m, the same pattern of high (1972) to low (1977)to high (1992/1993) to low (1998/1999) to high(2004) to low (2009) was observed. However, for long-term variation, an increasing trend was observed before 1992/1993 and decreased thereafter. The decreasing trend after 1992 was most obvious at 500 m as a ratio was around -0.43 μ mol/(L?yr).Similar results were also found in the North Pacific Intermediate Water (NPIW) by Takatani et al. (2012)as a particularly significant decreasing trend in DO after the mid-1980s with a ratio of (-0.36±0.08) μ mol/(kg?yr). This significant decreasing trend of DO in the NPIW is occurring a few years in advance of the trend observed here.
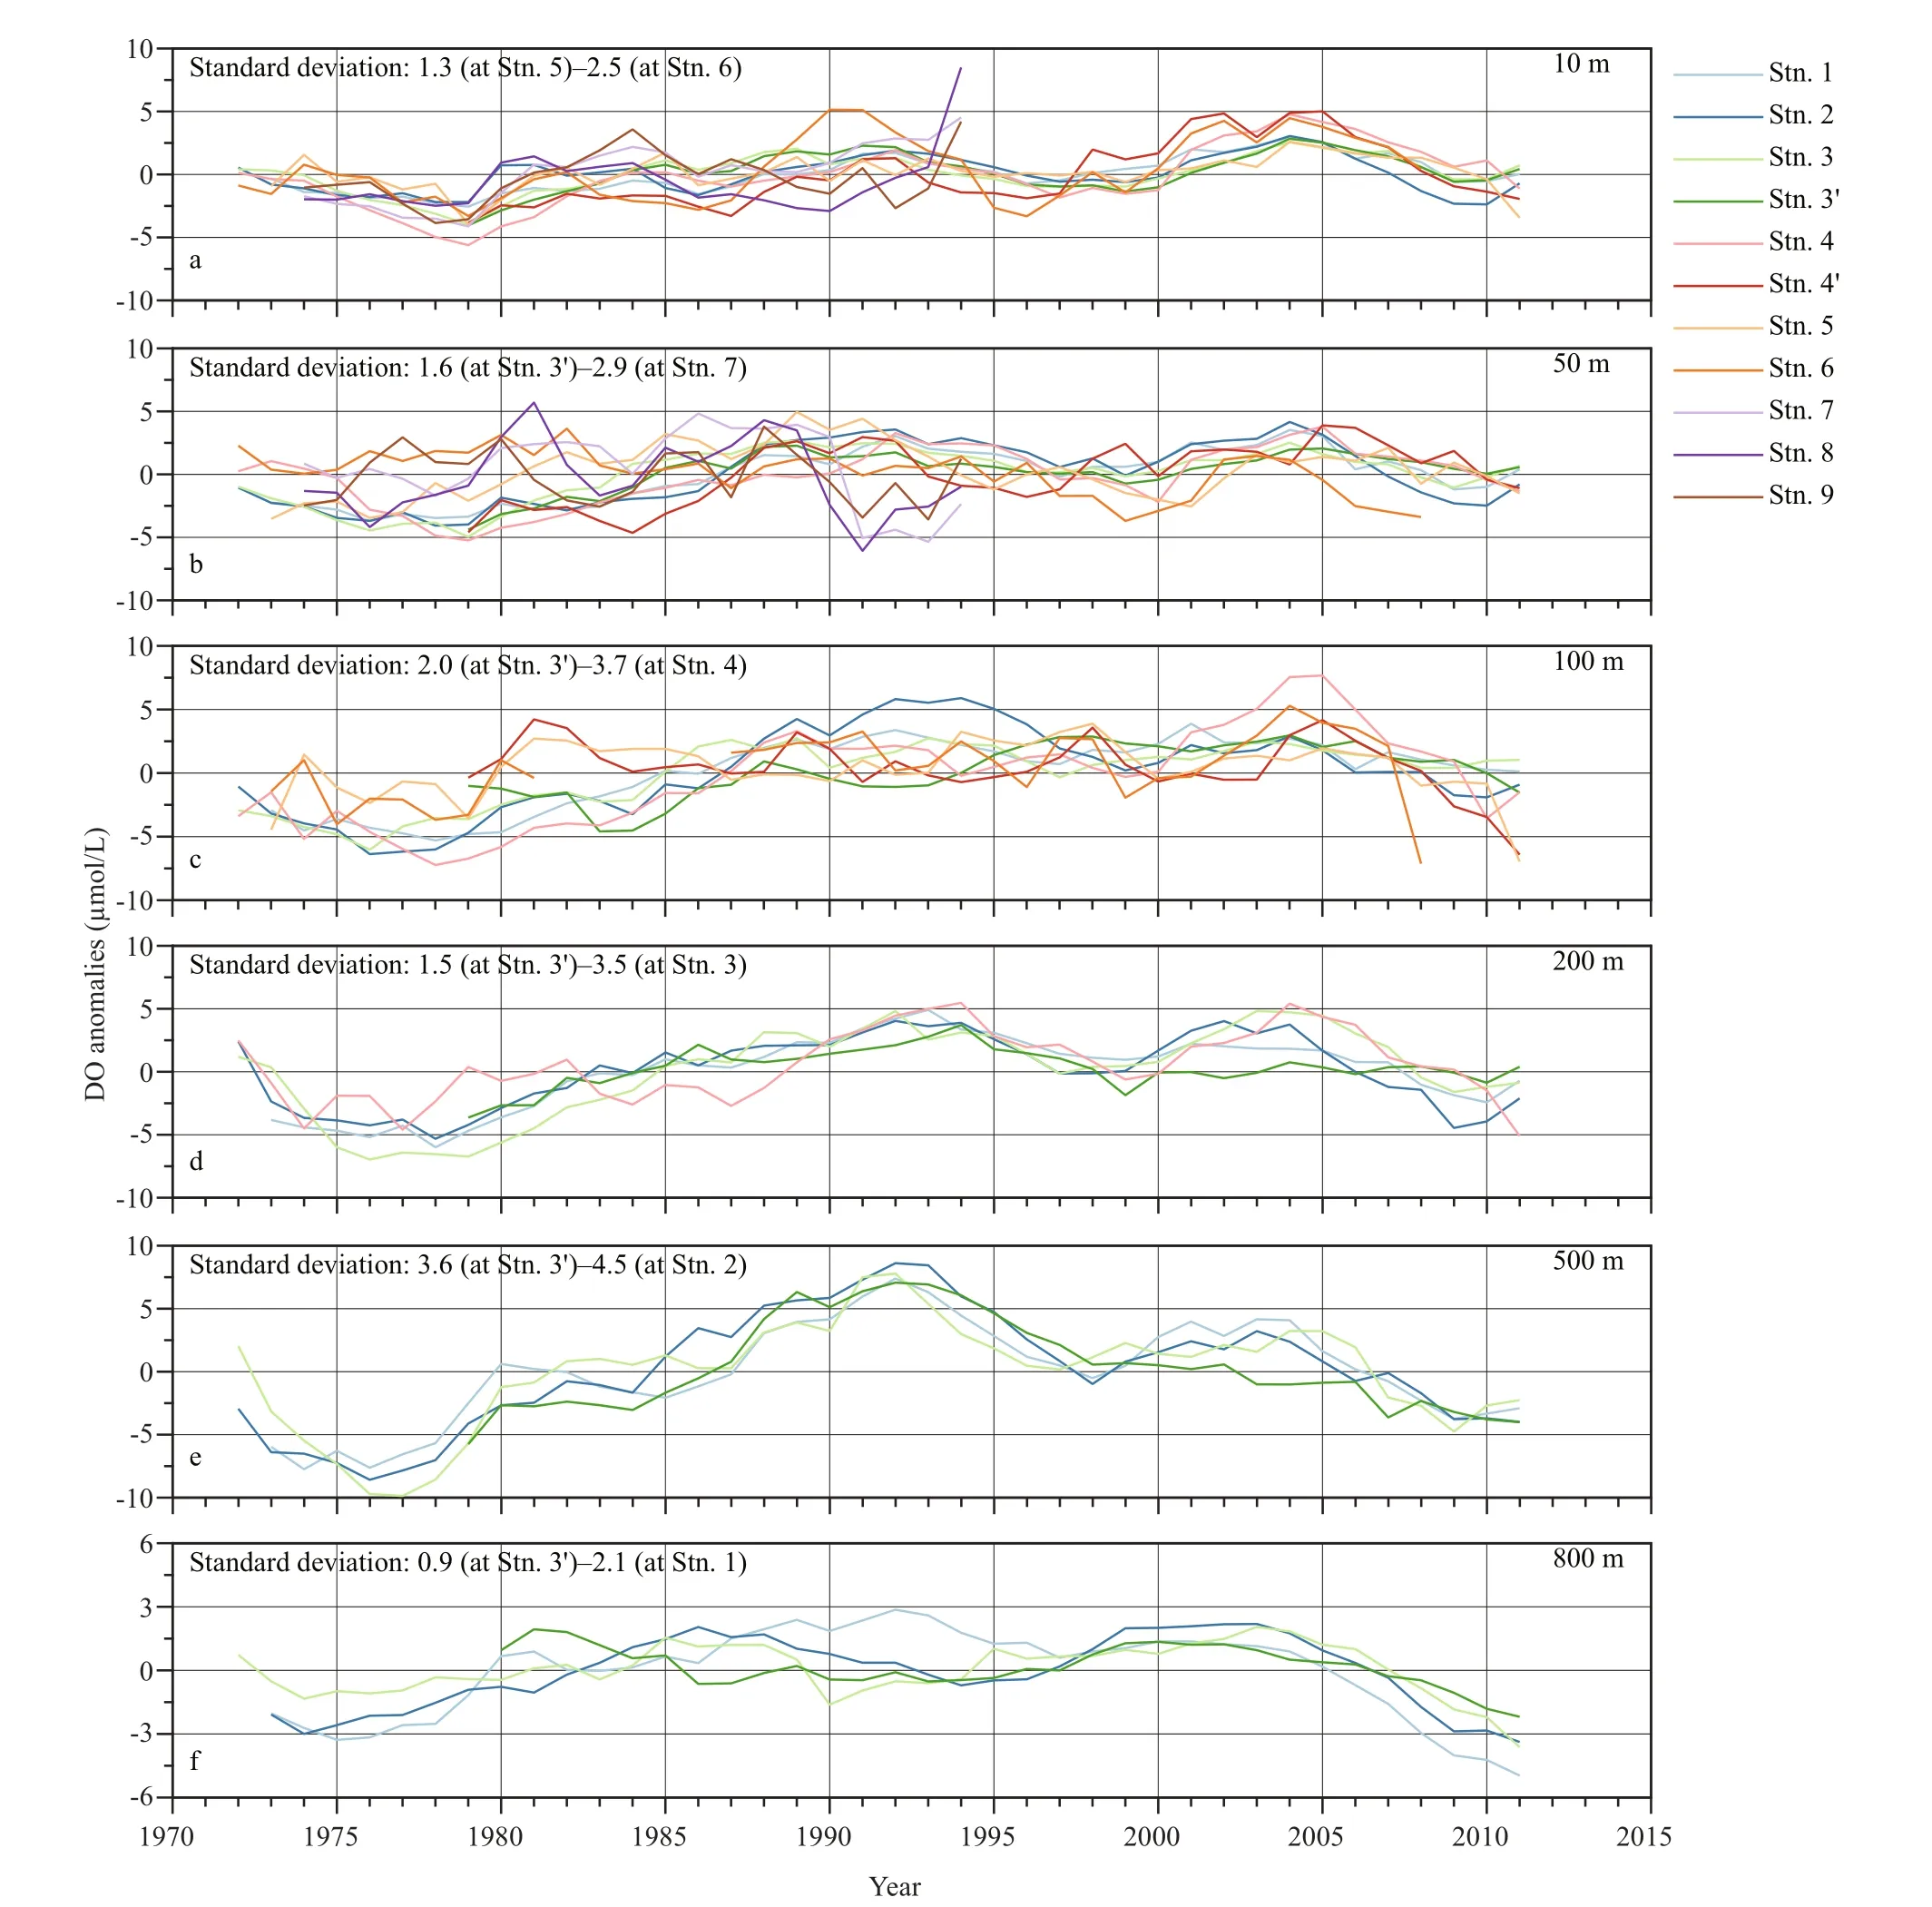
Fig.7 Interannual variations of DO along section PN by depth
The magnitude of interannual variation of DO was greatest at 500 m and smallest at 800 m (Fig.7), even though the spatial distribution of DO showed a lower value in deep layers than in shallow layers (Fig.3i–l).
The nitrate dataset is the shortest available. Before 1985, only Stn. 1, 4 and 9 had nitrate observations and only twice per year. After 1996, no more observations were made at Stn. 7 to 9. From this limited data, we find that the nitrate concentration before 1985 was increasing but decreased from 1985 to 1989. After 1989, nitrate in the surface and subsurface water was not changing much, while nitrate at 500 m showed an increasing trend mean of 0.124 μ mol/(L?yr).
The magnitude of nitrate variation (Fig.8) was much larger before 1989, and the diff erence in magnitude before and after 1989 is larger at shallow depths. At 500 m, the magnitudes before and after 1989 were similar to each other. After 1989, the nitrate concentration was tending to increase at 500 m, and the trend is most pronounced of the five depths.
Phosphate observation was longer and more complete than for nitrate observation (Fig.9). Surface phosphate was high around 1982 and 2003 and low around 1990. After 1989, an interannual variation pattern similar to that of nitrate was observed at 500 m with an increasing trend mean of 0.005 1 μ mol/(L?yr).The magnitude of phosphate variation (Fig.9) was smallest for surface layers (0.01 μ mol/L at Stn. 4’ -0.022 μ mol/L at Stn. 5) and largest at 800 m(0.072 μ mol/L at Stn. 3’ -0.139 μ mol/L at Stn. 1).
AOU at 200 m decreased from 1975 to 2003 and increased after 2004 (Fig.10). At 500 and 800 m,AOU showed a pattern of decreasing and then increasing. The diff erence is that the lowest value at 500 m appeared around 1992, while it appeared around 1988 at 800 m. At 800 m, AOU was even higher after 2010 than it was in 1975.
4 DISCUSSION
The hydrologic character along section PN section is determined by Kuroshio surface water, Kuroshio subsurface water, KIW, deep water, coastal water and mixed water.
Figure 11 shows the correlations between variation at 200 m at Stn. 2 (represents Kuroshio subsurface water) and that at other depths and stations for each parameter. For DO, nitrate, phosphate and AOU, there is a significant positive correlation across almost the entire section. This suggests that DO, nitrate,phosphate and AOU show synchronous interannual variation in the Kuroshio subsurface water. However,water temperature in the surface and Kuroshio subsurface water ( T >14°C) shows an opposite pattern to that in the KIW ( T <14°C). Salinity variation shows an opposite pattern between shallower than 600 m and deeper than 600 m.
From Fig.12 we can see that interannual variation of water temperature and salinity shows a positive relationship in the KIW and a negative relationship in Kuroshio surface and subsurface water. This means that when water temperature is high, salinity at the surface is low and salinity in the KIW is high, which leads to lighter water on the surface. The correlation between water temperature and the concentrations of nitrate, phosphate and DO matches well in Kuroshio intrusion water on the shelf slope. This is because when the intrusion is strong, intrusion water carries cold water with high nutrient and low DO to the shelf region.
Trends in the long-term data sets show that nutrients in the KIW increased and DO decreased since as early as 1982 (Lui et al., 2014). As for interannual variation,we see results similar to those of Lui et al., (2014) if we set the study period from 1988 to 2010. For results prior to 1988, DO was increasing from 1973 to 1988 and phosphate was increasing before 1983 then decreasing from 1983 to 1988. This suggests that long-term trends might diff er, depending on the selected study period and that interannual variations of nitrate, phosphate and DO might be correlated to long-period variations.
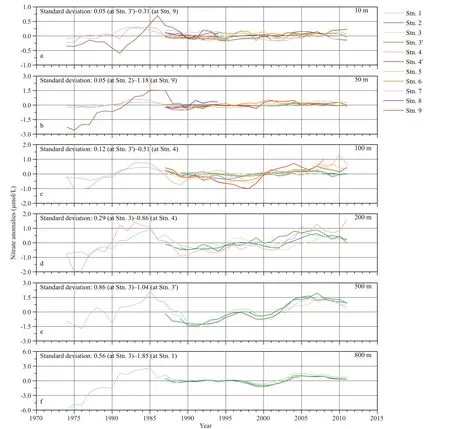
Fig.8 Interannual variations of nitrate along section PN by depth
Most interannual variation can be explained by PDO(Fig.13). Water temperature is negatively correlated with PDO (R>-0.2 with a significant level ofP<0.1) at depths shallower than 300 m and a positively correlated(R>0.6 with a significant level ofP<0.1) at deeper depths. As for salinity, a positive correlation (R>0.8 with a significant level ofP<0.1) was found at depths shallower than 700 m and negative correlation was found at depths deeper than 700 m. We can find a significant positive correlation between PDO and phosphate as well as DO, a significant negative correlation between PDO and nitrate as well as AOU in the KIW and a portion of the bottom water of the shelf region.
However, discharge of the Changjiang River cannot explain interannual variations along section PN very well (Fig.14). The first possible reason is that Changjiang diluted water is light and mainly flows in the shallow layers. The second reason is that the movement of Changjiang diluted water is mainly controlled by wind. Bai et al. (2014) studied summertime Changjiang River plume variation during 1998 to 2010 and found that the plume extension was more influenced by the southwesterly wind during periods of smaller discharge. The in fluence of Changjiang River to the area around the PN section should be considered to be a combination of nitrate concentration in water carried by Changjiang River, discharge from the Changjiang River and wind.
From these results, we identi fied an interesting phenomenon. From the late 1980s and thereafter,water characteristics at 500 m all showed a trend diff erent than that at shallow depths. Temperature,salinity and DO decreased while phosphate, nitrate and AOU increased. At 500 m to 800 m, the KIW (Lui et al., 2014) has lower temperature, salinity, DO and higher phosphate, nitrate and AOU compared to at shallow depths. Lui et al. (2015) suggested that enhanced vertical movement of the seawater may be a cause of the increased AOU concentration but decreased DO concentration and θ in the KIW. Timedepth distribution of salinity at Stn. 3 (Fig.15) shows that the depth of upper boundary of KIW (S≤34.35) is becoming shallower after the late 1980s. A possible reason for this upward trend is the lower density of the NPIW (Kouketsu et al., 2009).

Fig.9 Interannual variations of phosphate along section PN by depth

Fig.10 Interannual variations of AOU along section PN by depth
5 CONCLUSION
This study describes the vertical patterns in temperature, salinity, DO, nitrate, phosphate and AOU along a transect (section PN) that crosses the Kuroshio in East China Sea. The characteristics of seasonal variation in temperature and salinity are almost consistent with the previous studies (Hinata,1996). DO in shallow layers shows seasonal variation with the highest value in spring and lowest value in autumn. Both nitrate and phosphate have a highest value in winter on the continental shelf region.Interannual variation of water temperatures and salinity changed diff erently between the Kuroshio surface water and KIW. In shallow layers, water temperature showed two relatively warm periods around 1975 to 1980 and 1990 to 2005 while other three periods are relatively cold. For depths shallower than 500 m, salinity increased to the highest value around 1993 and decreased thereafter. At 800 m, the lowest salinity was observed around 1993 and shows changes that are opposite to those at depths shallower than 500 m. For nutrients and DO from 200 to 800 m,all have a pattern of high (1972) to low (1977) to high (1992/1993) to low (1998/1999) to high (2004)to low (2009). For the long-term pattern of DO, an increasing trend was observed before 1992/1993 and decreasing one after that. Nitrate and phosphate were increasing up to 1985 and decreasing from 1985 to 1989. After 1992, DO at 500 m shows a significant decreasing trend because of the shallower upper boundary of KIW and is possibly related to a similar change of DO in NPIW. Conditions at the PN section are mainly controlled by the open ocean, and a good relationship is shown with the PDO index.Importantly, further research on the impact of interannual variation to ecosystem of East China Sea is necessary.
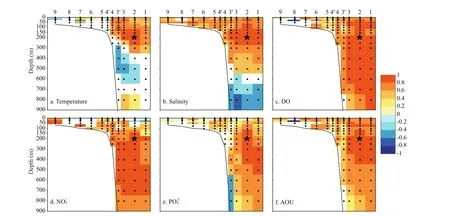
Fig.11 Correlations coeffi cient with a significance level of P <0.1 (color) between a. temperature, b. salinity, c. DO, d. nitrate,e. phosphate, f. AOU at all observation points with the same variable at depth of 200 m of Stn. 2 (star)
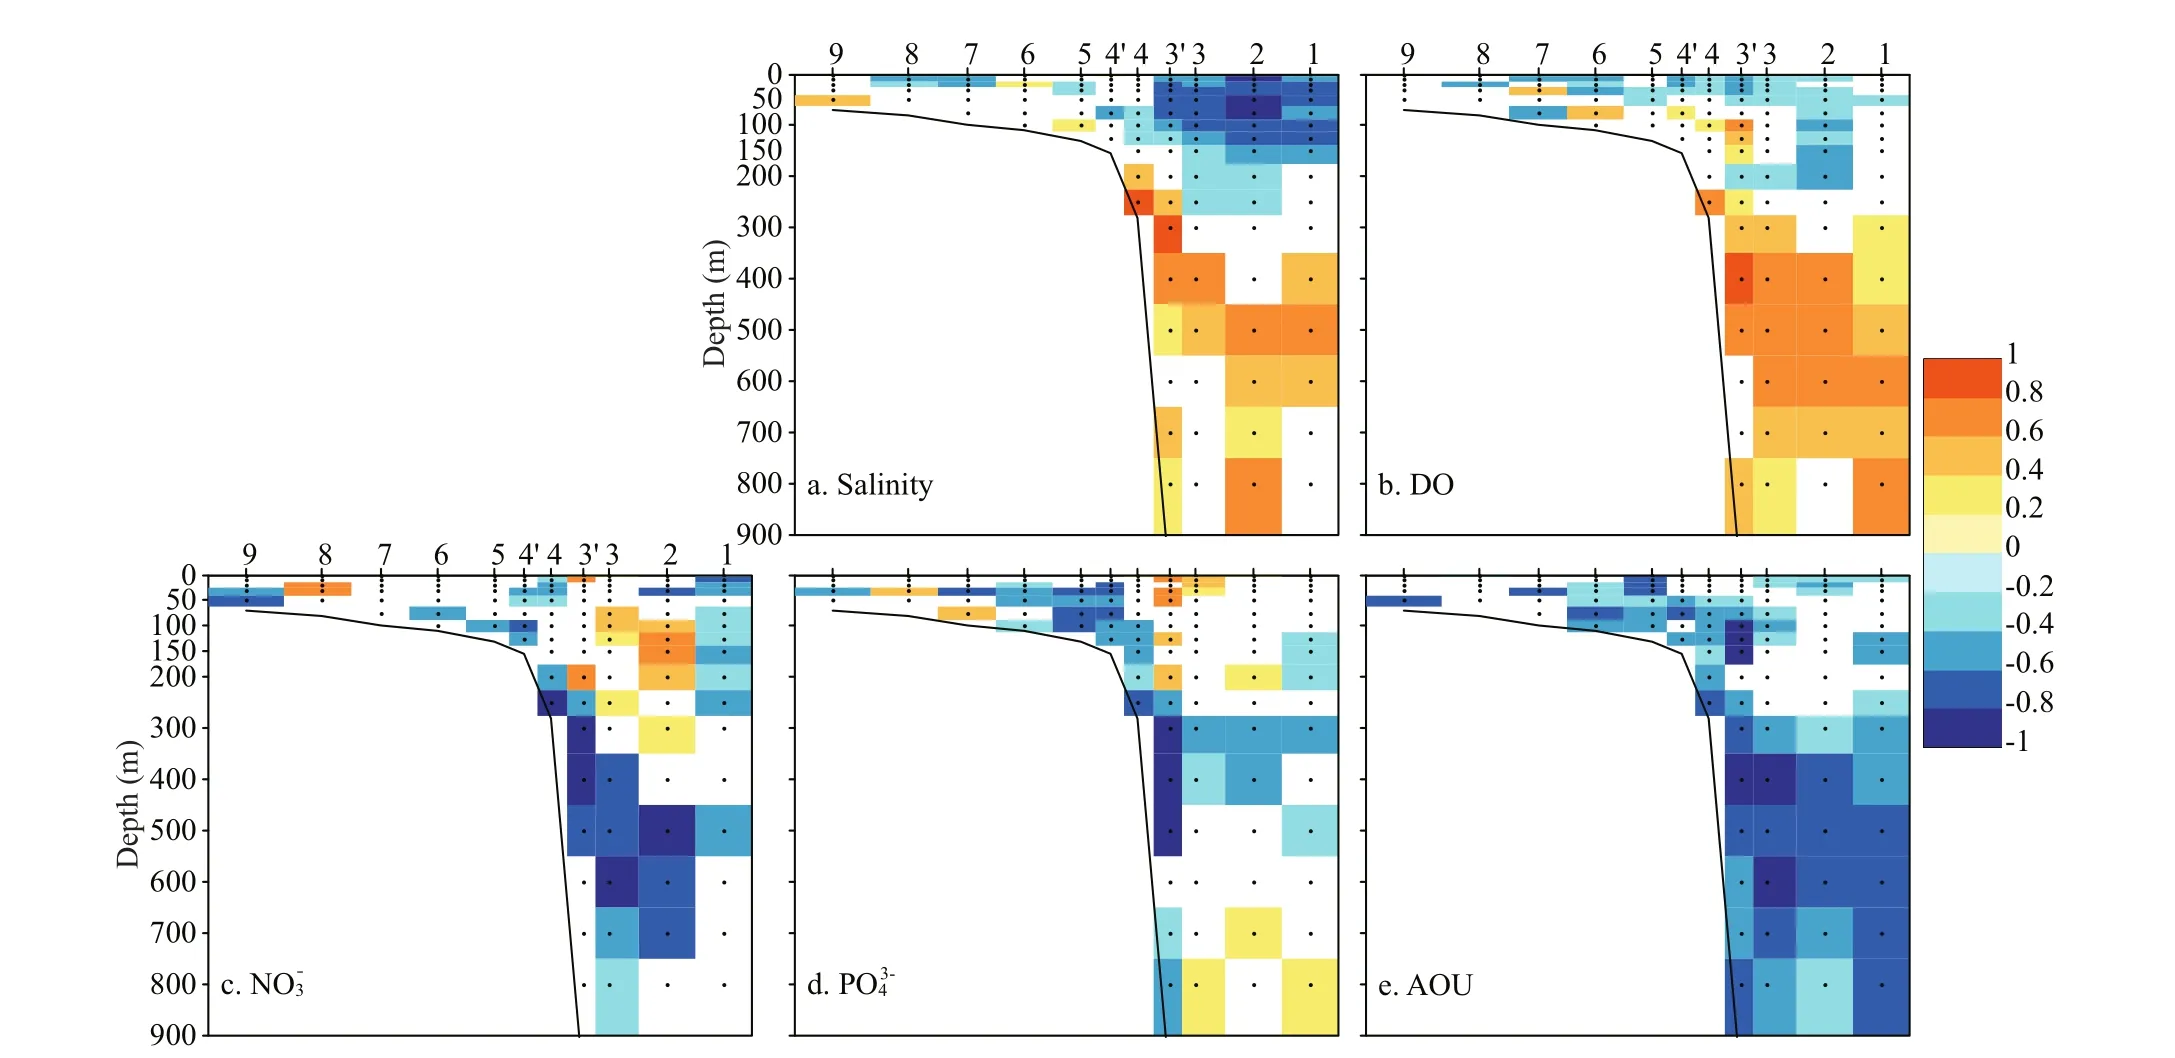
Fig.12 Correlations coeffi cient with a significance level of P <0.1 (color) between water temperature and a. salinity, b. DO, c.nitrate, d. phosphate, e. AOU at the same observation points
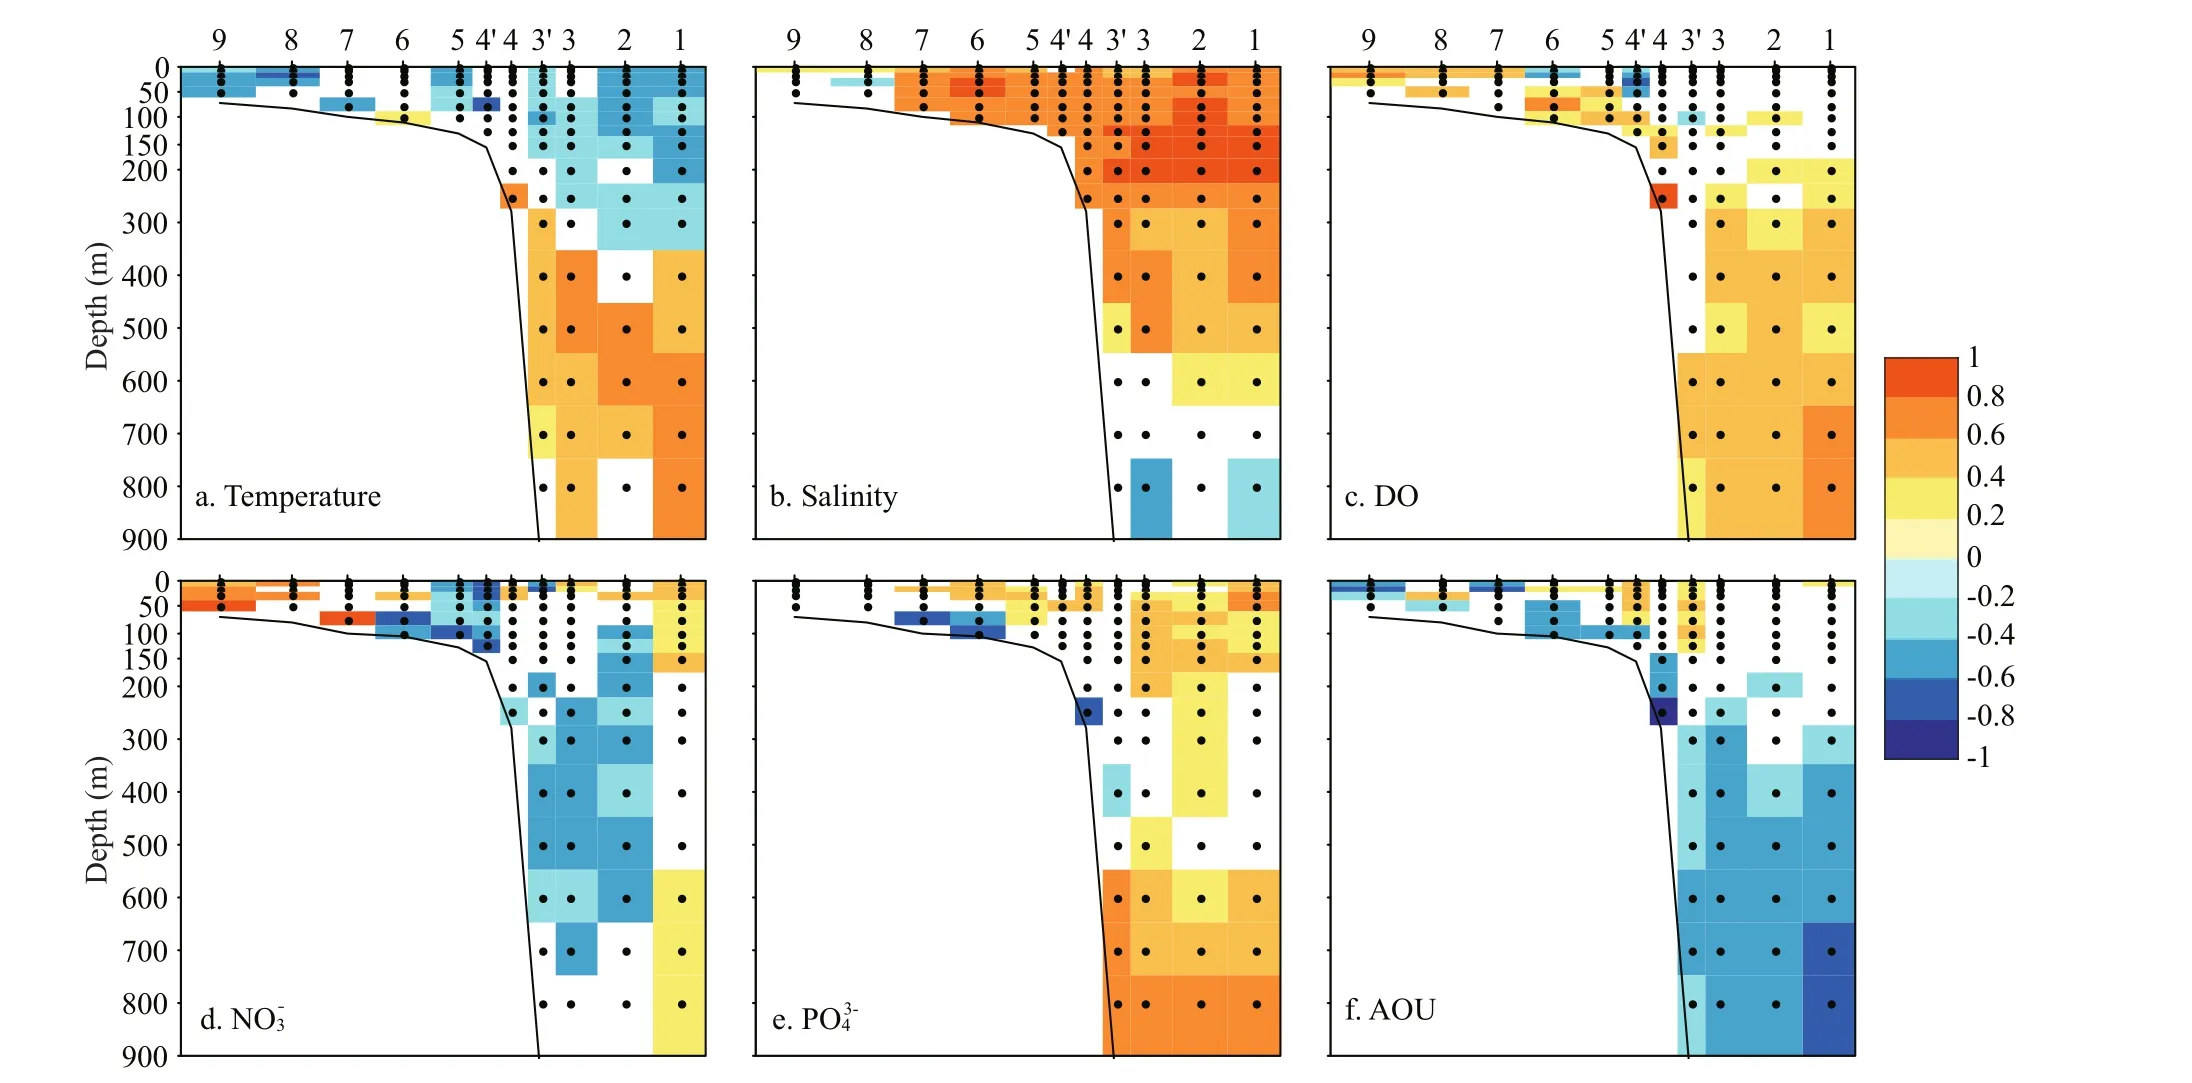
Fig.13 Correlations coeffi cient with a significance level of P <0.1 (color) between PDO index and a. temperature, b. salinity,c. DO, d. nitrate, e. phosphate, f. AOU

Fig.14 Correlations coeffi cient with a significance level of P <0.1 (color) between Changjiang discharge and a. temperature,b. salinity, c. DO, d. nitrate, e. phosphate, f. AOU
6 ACKNOWLEDGEMENT
HU Y. Y. thanks the China Scholarship Council(CSC) for supporting her stay in Japan.
Aoyama M, Goto H, Kamiya H, Kaneko I, Kawae S, Kodama H, Konishi Y, Kusumoto K I, Miura H, Moriyama E,Murakami K, Nakano T, Nozaki F, Sasano D, Shimizu T,Suzuki H, Takatsuki Y, Toriyama A. 2008. Marine biogeochemical response to a rapid warming in the main stream of the Kuroshio in the western North Pacific.Fish.Oceanogr.,17(3): 206-218.
Bai Y, He X Q, Pan D L, Chen C T A, Kang Y, Chen X Y, Cai W J. 2014. Summertime Changjiang River plume variation during 1998-2010.J.Geophys.Res.,119(9):6 238-6 257.
Chen C T A. 2008. Distributions of nutrients in the East China Sea and the South China Sea connection.J.Oceanogr.,64(5): 737-751.
Chen C T A. 2009. Chemical and physical fronts in the Bohai,Yellow and East China seas.J.Mar.Syst.,78(3): 394-410.
Gong G C, Wen Y H, Wang B W, Liu G J. 2003. Seasonal variation of chlorophyllaconcentration, primary production and environmental conditions in the subtropical East China Sea.DeepSeaRes.IITop.Stud.Oceanogr.,50(6-7): 1 219-1 236.
Guo X Y, Zhu X H, Wu Q S, Huang D J. 2012. The Kuroshio nutrient stream and its temporal variation in the East China Sea.J.Geophys.Res.,117(C1): C01026.
Hama T, Shin K H, Handa N. 1997. Spatial variability in the primary productivity in the East China Sea and its adjacent waters.J.Oceanogr.,53(1): 41-51.
Hinata T. 1996. Seasonal variation and long-term trends of the oceanographic conditions along a fixed hydrographic line crossing the Kuroshio in the East China Sea.Oceanogr.Mag.,45: 9-32.
Hu M H, Yang Y P, Xu C L, Harrison P J. 1990. Phosphate limitation of phytoplankton growth in the Changjiang estuary.ActaOceanol.Sinica,9(3): 405-411.
Huang S G, Yang J D, Ji W D, Yang X L, Chen G X. 1986.Spatial and temporal variation of reactive Si, N, P and their relationship in the Chang Jiang estuary water.Taiwan Strait,5(2): 114-123. (in Chinese with English abstract)
Kouketsu S, Fukasawa M, Kaneko I, Kawano T, Uchida H,Doi T, Aoyama M, Murakami K. 2009. Changes in water properties and transports along 24°N in the North Pacific between 1985 and 2005.J.Geophys.Res.,114(C1):C01008.
Lü X Q, Zhu C J, Zhang A B, Shi Z L. 1985. The characteristics of nutrient distribution in the southwest Bohai Sea and Huanghe River Estuary in summer.J.ShandongColl.Oceanol.,15(1): 146-158. (in Chinese with English abstract)
Lui H K, Chen C T A, Lee J, Bai Y, He X Q. 2014. Looming hypoxia on outer shelves caused by reduced ventilation in the open oceans: case study of the East China Sea.Estuar.,Coast.ShelfSci.,151: 355-360.
Lui H K, Chen C T A, Lee J, Wang S L, Gong G C, Bai Y, He X Q. 2015. Acidifying intermediate water accelerates the acidification of seawater on shelves: an example of the East China Sea.Cont.ShelfRes.,111: 223-233.
Takatani Y, Sasano D, Nakano T, Midorikawa T, Ishii M. 2012.Decrease of dissolved oxygen after the mid-1980s in the western North Pacific subtropical gyre along the 137°E repeat section.GlobalBiogeochem.Cycles,26(2):GB2013.
Wang Y H. 1991. Marine Atlas of Bohai Sea, Yellow Sea, East China Sea, Voloum 2: Chemistry. China Ocean Press,Beijing, China. 257p. (in Chinese)

Fig.15 Time-depth distribution of salinity at Stn. 3 (colors represent salinity by 5-year moving average, black lines plot boundaries of KTW ( S ≥34.7) and KIW ( S ≤34.35)
猜你喜歡
十幾歲(2021年5期)2021-11-22 23:37:22
Chinese Physics B(2021年1期)2021-01-21 02:07:10
海燕(2020年9期)2020-11-23 01:54:27
檢察風云(2020年16期)2020-09-26 13:43:12
故事會(2020年2期)2020-02-04 06:38:28
水動力學研究與進展 B輯(2018年4期)2018-09-28 05:34:08
Journal of Oceanology and Limnology(2018年1期)2018-04-02 03:03:52
微型小說選刊(2016年17期)2017-01-19 01:02:48
小小說月刊·下半月(2016年7期)2016-05-14 15:23:24
鴨綠江(2016年5期)2016-04-29 13:06:31
 Journal of Oceanology and Limnology2018年1期
- Journal of Oceanology and Limnology的其它文章
- Editorial Statement
- Sedimentary architecture of the Holocene mud deposit offthe southern Shandong Peninsula in the Yellow Sea*
- Ferroan dolomites in Miocene sediments of the Xisha Islands and their genetic model*
- Synchronous response of sedimentary organic carbon accumulation on the inner shelf of the East China Sea to the water impoundment of Three Gorges and Gezhouba Dams*
- Rates and fluxes of centennial-scale carbon storage in the fine-grained sediments from the central South Yellow Sea and Min-Zhe belt, East China Sea*
- Centennial-scale records of total organic carbon in sediment cores from the South Yellow Sea, China*