
The Slow-paced Development of the Middle Stratum in China:Reason Analysis and Solution
2018-01-26 05:27:52LiQiangGeYanxia
Contemporary Social Sciences 2017年6期
Li Qiang,Ge Yanxia*
1. Research background and analysis logic
There is no essential difference between “middle stratum” and “middle class,”though the former is more acceptable in current China. The middle stratum is that group of people who fall socio-economically between the under-stratum andthe upper-stratum (Mills, 1951). The status of a social stratum, for example, the middle stratum, can be defined from different perspectives and by different measures, such as occupational status, incomes,educational backgrounds and lifestyles (Li, 2010).
The concept of “middle-income group,” however,defines the middle group in a society through their economic income. Despite the different voices in academia about the definition of the middle stratum, there is a clear consensus of opinion about the important role the middle stratum is playing in maintaining social harmony and stable development(Li, 2015). Relevant studies have found that the middle stratum is a major impetus for modern social changes (Lash & Urry, 1987, pp. 297-321) a stable and progressive industrial power (Clark, Harbison,Dunlop, & Myers, 1960), and also a key driver for the modernization and democratization of a country(Hunting & Samuel, 1991, pp. P68-93).
In China, unanimity has been reached among sociologists in the trajectory of the hierarchical evolution of modern societies: It goes like a diamond or an olive. In other words, the drastically growing middle stratum is to dominate. On the contrary,both the under-stratum and upper-stratum bear a relatively low proportion, which somehow explains why “stratum conflicts,” once intense in early industrial society, is ultimately reduced. Most sociologists hold that a growing population of middle stratum will help bridge the income gap between the two opposing stratums, ease their bitterness against each other and complete the social transition in a harmonious and smooth way.
A comparison set in an international context reveals that, so far, only a small number of societies—with most being developed economies from regions like Europe, North America and Australia, and a few being Asian countries and regions—have been dominated by middle stratum.The remaining countries and regions (which are the majority), though never giving up efforts at modernization, have been suffering middlestratum growth bottleneck due to problems like wealth polarization. Recent years have witnessed heated debates over the theme of “middle income trap” (Zheng, 2011), indicating that the evolution of modern social structures is never smooth.
Since the beginning of the 21st century,urbanization, industrialization and higher education in China are thriving and occupational structure is being improved, resulting in a certain growth in the middle stratum. A measurement of China’s middle stratum by the International Socio-Economic Index of Occupational Status (ISEI) reveals that China’s overall social structure is getting better, evolving into a “土” character shape from an inverted“丁”character shape. However, the Chinese middle stratum in the whole social structure still only accounts for a small share, which generally leans towards the under-stratum. Moreover, large cities, or megacities, in China, are home to the majority of the middle stratum, leaving rural areas, small cities and towns little chance (Li, 2016). Therefore, to breed and strengthen the middle stratum is a key to the country’s modernization transition. It is also in full accordance with the central government’s strategy of enlarging the middle-income group.
Such a context gives rise to the following questions.Given China’s current level of socioeconomic development, what is the right proportion for its middle stratum? Compared with others in the international arena, is the existing proportion of Chinese middle stratum appropriate?
The fundamental theory that supports this paper holds that the hierarchical structure of a society is based on its economic development level and structure. What is worth mentioning, though,is that even if a country seems qualified with a required level of modern economic development,industrial structure and occupational structure, it is not necessarily sure to become a middle-stratum society.A relatively fair resource distribution system, especially a fair wealth distribution system, instead, is the very key factor that decides whether a country can become a middlestratum society.
The basic logic of this paper works like this: Place the countries at equivalent stages in terms of economic development; compare the growth of the Chinese middle stratum with that of other middle-stratum-dominated countries; then identify the development level of the Chinese middle stratum, analyze the reason for its slow pace and finally propose a solution. Considering that the USA is an early middle-stratum country with successful experiences concerning middlestratum development, we chose it as the specimen for comparison. However, it is perhaps not sensible to directly compare China with the homochromous USA, for they might have quite different figures concerning socioeconomic development. Considering this, we decided upon a period of time during which China-US comparability proves the best.Based on previous studies, we adopted 2015 USD-denominated GDP per capita as the measure of the middle-stratum growth level. China in 2015 is found to be equivalent to the USA in 1975 in terms of economic development level. A comparison is then made of the middle-stratum growth between the two countries at their equivalent stages, revealing what the share of middle stratum is in the USA, and whether the homochromous Chinese middle stratum is lagging. This is followed by an analysis of the possible reasons, and a proposed solution.
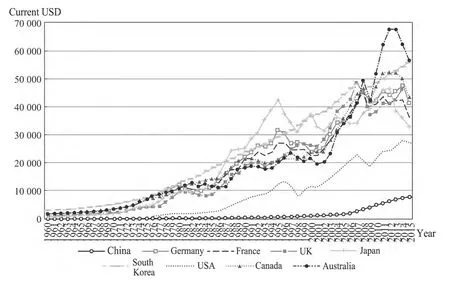
Figure 1 GDP per capita growth of China and the major developed countriesSource: The national economic accounting data of the World Bank and the Organization for Economic Cooperation and Development (OECD).
2. The development level of the Chinese middle stratum
Social structure always varies with economic development. The growth of the middle stratum cannot be separated from a sound industrial structure,a solid economic foundation and dynamic economic development. Some 40 years into the Reform and Opening-up, the scale of the Chinese economy and its per capita development level have seen a huge increase. However, considering China’s economic level, the Chinese middle stratum is lagging.
Figure 1 displays the growth of GDP per capita of China and other major developed countries from the 1960s to the early 21st century. The figures indicate that in 2015, Chinese GDP per capita reached USD 7,925, approximately equivalent to USA in 1975, Canada in 1976, Germany and France in 1977, as well as the UK and Australia in 1978. However, given the same GDP per capita as others, China features a notably low share of middle stratum by population percentage. Take the USA as an example. It had already become a typical middle-stratum country as early as the 1970s.
First, the development of middle stratum in a country can be measured by the most commonly used vocational distribution. According to C. Wright Mills (1951), an American sociologist, middle stratum can be defined by vocations. He named farmers, small businessmen and freelancers the“old middle stratum,” and managers, employed professionals, salesmen and office clerks born in the 20th century corporate boom the “new middle stratum”. Today, in the USA middle stratum mainly consists of professional and technical personnel, farm owners, farm managers, managers& administrators, clerks, salesmen and craftsmen.If the counting only considered the vocation of the household head, then American middle-stratum families would have accounted for 70% of all in 1975,①From the investigation report of the US Bureau of Labor Statistics: “Current Population Reports: Household Money Income in 1975 and Selected Social and Economic Characteristics of Households,” issued on March 1977.while in China, the middle stratum only accounted for 20% of all working people in 2013.②From the database of China National Bureau of Statistics; data prior to 2012 is from the urban household survey of China National Bureau of Statistics.
Second, middle stratum can be defined by income standards. Though rousing widespread doubt, income still serves as a very important tool to define middle stratum. There are two kinds of income standards: Relative and absolute. A popular form of the former is to remove the richest 5% and 25% of the lowest income earners before counting.Likewise, the US Bureau of Labor Statistics used to set 75% of the median household income per capita as the floor limit and 125% as the upper limit when trying to define the “middle-income group”(Kacapyr, Elia, Francese, Crispell, 1996).However, due to the wide space between the two limits, this relative measurement of middle stratum is largely susceptible to the income distribution,which reduces the comparability between different groups and thus affects its referential value. As for the absolute income standards that are used to define the middle stratum, there are three, all documentbacked: (1) The standard proposed in 1983 by Rose:the annual household income for American middlestratum families should fall between USD 15,000 and USD 100,000(Rose, 1983). Suppose a typical family consists of three people, then the household per capita annual income should be between approximately USD 5,000 to USD 33,000. (2) A survey launched by the US Research and Consulting Corporation in 2001 pertaining to middle stratum living expenditures proposed that, for a 3-person US family, the annual household income should reach at least USD 100,000—that is USD 33,000 per capita,if it was to be listed on the middle stratum family roster. This standard was adopted in 2005 by the research group working on the “Strategic Research into Expanding the Middle-income Proportion,”with the China National Development and Reform Commission Macroeconomic Research Institute.(3) There is another standard for middle stratum definition, proposed in 2005 by US sociologists William Thompson and Joseph Hickey: People with an annual income between USD 35,000 and USD 100,000 (about RMB 232,000 to RMB 663,000) fall into the lower middle stratum, while an annual income between USD 100,000 and USD 500,000 (about RMB 663,000 to RMB 3,319,000)defines a member of the upper middle stratum. As the US standards to define middle stratum clearly vary we needed a better comparability standard between China and US. To this end, we used the standard proposed in 2005 by the Macroeconomic Research Institute of China National Development and Reform Commission to define the Chinese middle stratum, which requires the per capita annual income to fall between RMB 34,000 and RMB 100,000. Converted according to the PPP index, that would be equivalent to USD 7,000 to USD 36,000 in 1975. Measured by this standard, according to the 1975 US income data from the US Bureau of Labor Statistics, in 1975, the US middle stratum accounted for 70% of its population. The 2005 standard, once being converted according to the consumer price index, turns into a year 2015 version standard of about RMB 45,000 to RMB 133,000. According to this standard, combined with the investigation data from the CGSS in 2015, the Chinese middle stratum only occupied about 22% in 2015. Despite slight differences due to different standards and approaches, it is an undeniable fact that the share of the middle stratum in China is indeed low.
Moreover, in terms of the middle stratum’s sense of identity, the US is ahead of China. Many US citizens above the middle stratum income standards or vocational standards thought they were also middle stratum, and in 1975, 80% of US wage earners thought they were middle stratum (Sun,2015). In China, reliable data is scarce in the study of the middle stratum’s sense of identity. However,according to the investigations in Guangzhou,Nanjing and Wuhan launched by Prof. Zhou Xiaohong in 2004, the proportion of people in the three cities who thought they were middle stratum only accounted for 38.7%, 40.5% and 41.3%,indicating a much lower share of middle stratum in Chinese urban areas than in an equivalent USA,let alone the rural areas (Zhou, 2005, pp. 29-61).Whatever methods are used in counting, there is the indisputable fact that the development of the Chinese middle stratum is far behind the Chinese economy.
3. Chinese and US middle stratum Comparison between and relevant reasons
Since developed economies generally trace the same trajectory when they enter into a middlestratum society, only the US is selected here as the most typical object for the comparison and reason analysis. The middle stratum in the USA, whose interests have been harmed in recent years, has been dwindling, causing accumulating resentment against society, for which the result of the 2016 presidential election would be solid evidence. This is very helpful as a reference for China.
3.1 Chinese household income being obviously lower
Household income is a major indicator that decides whether a family could be listed in the middle stratum. Figure 2 compares the household incomes of China and the USA in equivalent stages of economic development (China in 2015 is approximately tantamount to the USA in 1975 in terms of economic development). The figures indicate that in 2015, the annual Chinese household income was RMB 85,000, equal to a mere USD 22,000 (according to the PPP conversion factor of US dollar and RMB in 2015). However, its American equivalent in 1975 had already achieved USD 14,000, which would mean USD 63,000 for the year 2015 (and the chart is 2015 USD-denominated).That brings annual Chinese household income down to about one third of its US counterpart. The lower household income results in a smaller middle stratum, a stagnant domestic consumption capacity and a shortage of economic dynamics.
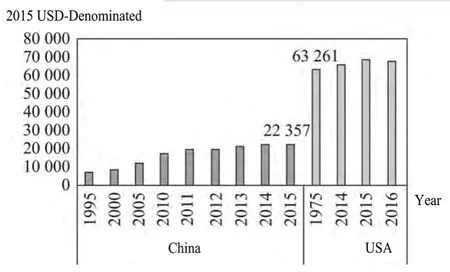
Figure 2 Chinese and US household income comparison in equivalent stages of economic developmentNotes: For better comparability between the incomes of the two countries from different years, all the figures concerning household income in Chart 2 are denominated in 2015 USD.Source: The 1975-1978 US figures concerning American household income are from Current Population Reports: Household Money Income and Selected Social and Economic Characteristics of Households, a report on household income and major social and economic indicators released by the US Bureau of Labor Statistics; the figures concerning Chinese household income are from the database of the China National Bureau of Statistics.
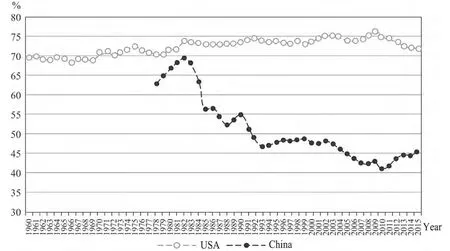
Figure 3 Share of residents’ disposable income in GDP in China and the USASource: Figures of the share of US residents’ disposable income in GDP are from the database of the USBureau of Labor Statistics; figures of the share of Chinese residents’ disposable income in GDP are from the database of the China National Bureau of Statistics; the two countries’GDP figures are from the database of the World Bank.
3.2 Chinese residents’ disposable income bearing a much lower share of GDP
The share of residents’ disposable income in GDP is one of the main indicators that measure residents’ share of dividend during economic development. It is also a major factor that influences the middle stratum growth.
Figure 3 displays the share of residents’ disposable income in GDP in China and the USA over the past decades.
An analysis of the figure variation indicates that the share of residents’ disposable income in GDP in China hit the peak (about 68%) at the beginning of the Reform and Opening-up before continually dwindling afterwards. As of 2010, the figure dropped to 41%. Despite the recent-fiveyear rebounding, it remained no more than 45%through 2015—a very low share indeed. In contrast, the share of residents’ disposable income in GDP in the US between 1960 and 1975 rose to 72% from 69% and stayed relatively high.China’s much lower figure signifies that residents have reaped much less from the economic development, and that to some extent has hindered the increase of household incomes.
3.3 The initial distribution of wealth featuring relatively less residents’ income and more enterprises’ income
Wealth distribution is an institutional factor concerning the growth of the middle stratum.
Figure 4 compares the initial distribution of wealth in China and the USA over the past decades.
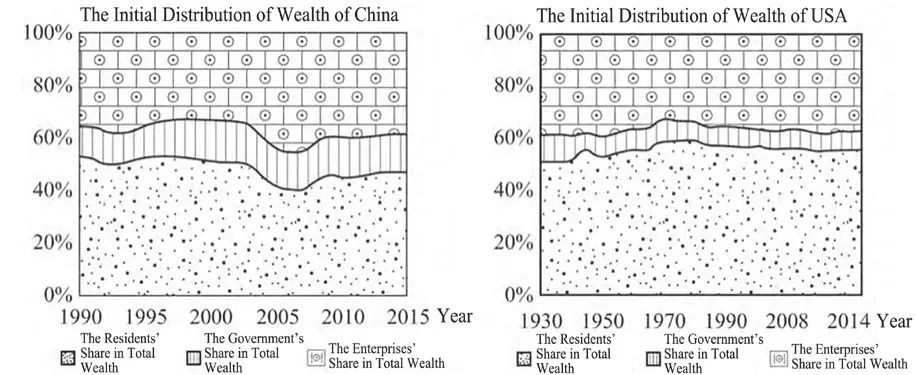
Figure 4 The shares of residents, government and enterprises in the initial distribution of wealth of China and the USANotes: Residents’ share in the initial distribution means the proportion of labor remuneration in GDP; enterprises’ share means the proportion of enterprises’fixed assets depreciation and operating surplus in GDP; the government’s share refers to the proportion of tax revenue in GDP.Source: The China-related figures from 1990 to 2015 concerning GDP, labor remuneration, enterprises’ fixed assets depreciation and operating surplus are from the database of the China National Bureau of Statistics, while those of the USA from 1930 to 2014 are from the database of the US Bureau of Labor Statistics.
The figures indicate that in 2015 initial distribution of wealth, residents accounted for 46%, government 15% and enterprises 39%. Generally, the shares of the government and enterprises had been on the rise,while the residents’ share had been trending down.In the early 1990s, the residents’ share was about 53%, which, however, decreased by 7% to 46% in 2015. The lost 7% of residents’ wealth branched out in two directions—4% to the enterprises and 3%to the government. In fact, if more wealth could go to the middle-and-low-income groups instead, the middle stratum would be enlarged and a stronger residential consumption capacity would be available to boost continuous economic development.
The initial distribution of wealth of the US is more people-oriented by “l(fā)eaving wealth with the residents.”During the growth period of the middle stratum (1930-1975), the residents’ share in GDP kept increasing,roughly up to 60% from 50%, while the shares of the enterprises and the government respectively dropped 6% and 4%. By contrast, at the equivalent stage, the residents’ share in China was about 12% lower than in the US, while the shares of the enterprises and the government were respectively 5% and 7% higher. A higher enterprise proportion indicated that a minority of capital-owners had taken wealth away from the ordinary working people, hindering the growth of the middle stratum. In a government-guided society,sparing more wealth from GDP for infrastructure construction is well justified, yet it cannot be denied that the growth of the middle stratum is thus restricted.The Chinese government has long been adhering to the approach of “concentrating all possible resources for a grand undertaking.” In consequence of the economic growth, it has reaped huge profits, which were then invested in infrastructures like highway and railway as well as attempts to guarantee people’s livelihoods. Though they did benefit from that, the residents could not directly have their disposable incomes increased. What’s worse, the projects like hospitals, schools and industrial parks that were heavily invested by the government were mostly concentrated in the developed areas like Beijing,Shanghai, Guangzhou and Shenzhen, aggregating the gap already existing between the high-income groups and low-income groups. Therefore, the fiscal strategy,when it is centralized, will restrict the growth of the middle stratum.
3.4 Sharp polarization of wealth impeding the growth of the middle stratum
A lot of problems, especially the sharp polarization of wealth, keep arising in the distribution of incomes,impeding the growth of the middle stratum. Figure 5 exhibits the variation of the Gini coefficients of China and the US. When its middle stratum was rapidly rising, the USA for a long time kept its Gini coefficient at 0.33, a relatively low level that indicated a somewhat fair income distribution. China at the beginning of its Reform and Opening-up also made its Gini coefficient as low as 0.22, which was closely linked with the egalitarianism its income distribution had featured before the Reform and Opening-up. In the 1990s, as reforms were launched breaking the egalitarianism and a series of new mechanisms were introduced to redeploy the resources, China’s Gini coefficient began to rocket, surpassing 0.4 after 2000 and for several times even approaching 0.5, which indicated a huge income gap and a sharp polarization of wealth.
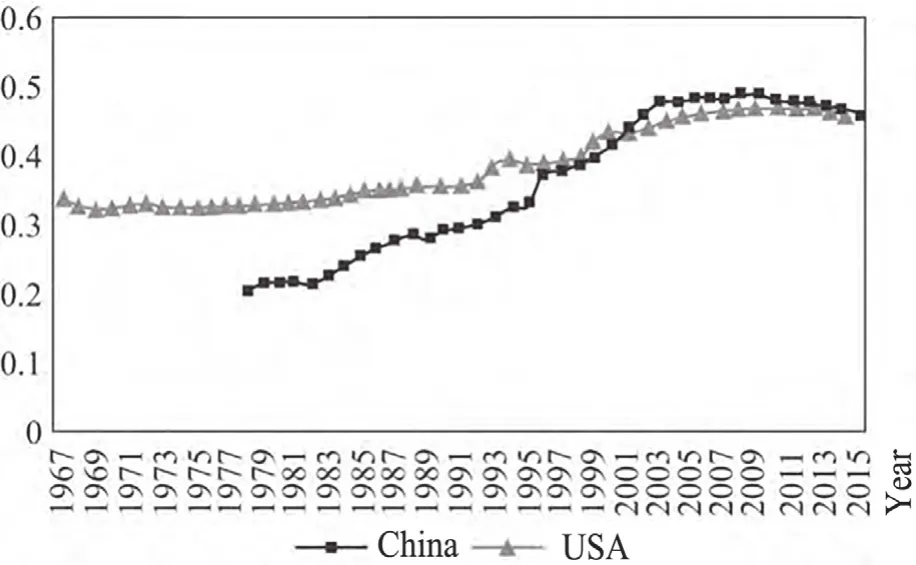
Figure 5 The variation of the Gini coefficients of China and the USSource: Chinese Gini coefficients between 1978 and 2015 are from the database of the China National Bureau of Statistics; US Gini coefficients between 1967 and 2014 are from the database of the US Bureau of Labor Statistics.
Moreover, in terms of the speed of household income growth, China was far in front of its US counterpart. However, when the Quinquepartite Method is used on the household income, it becomes clear that there was a sharp polarization of income growth rate between rich families and poor families(according to Figure 6).
In brief, over the past decade in China, the richer the family, the quicker its income would increase at a late stage, while the poorer the family, the slower their income growth would be. The Matthew Effect works well here in household income growth: The rich just got even richer and the poor, unfortunately,sank deeper into poverty. By contrast, the equivalent growth trend of household income of the US showed much less disparity, which left little chance for the worsening of wealth polarization and the shrinkage of the middle stratum, while in China, due to the Matthew Effect in household income growth,the gap between the rich and poor was widening,curbing the growth of the middle stratum.
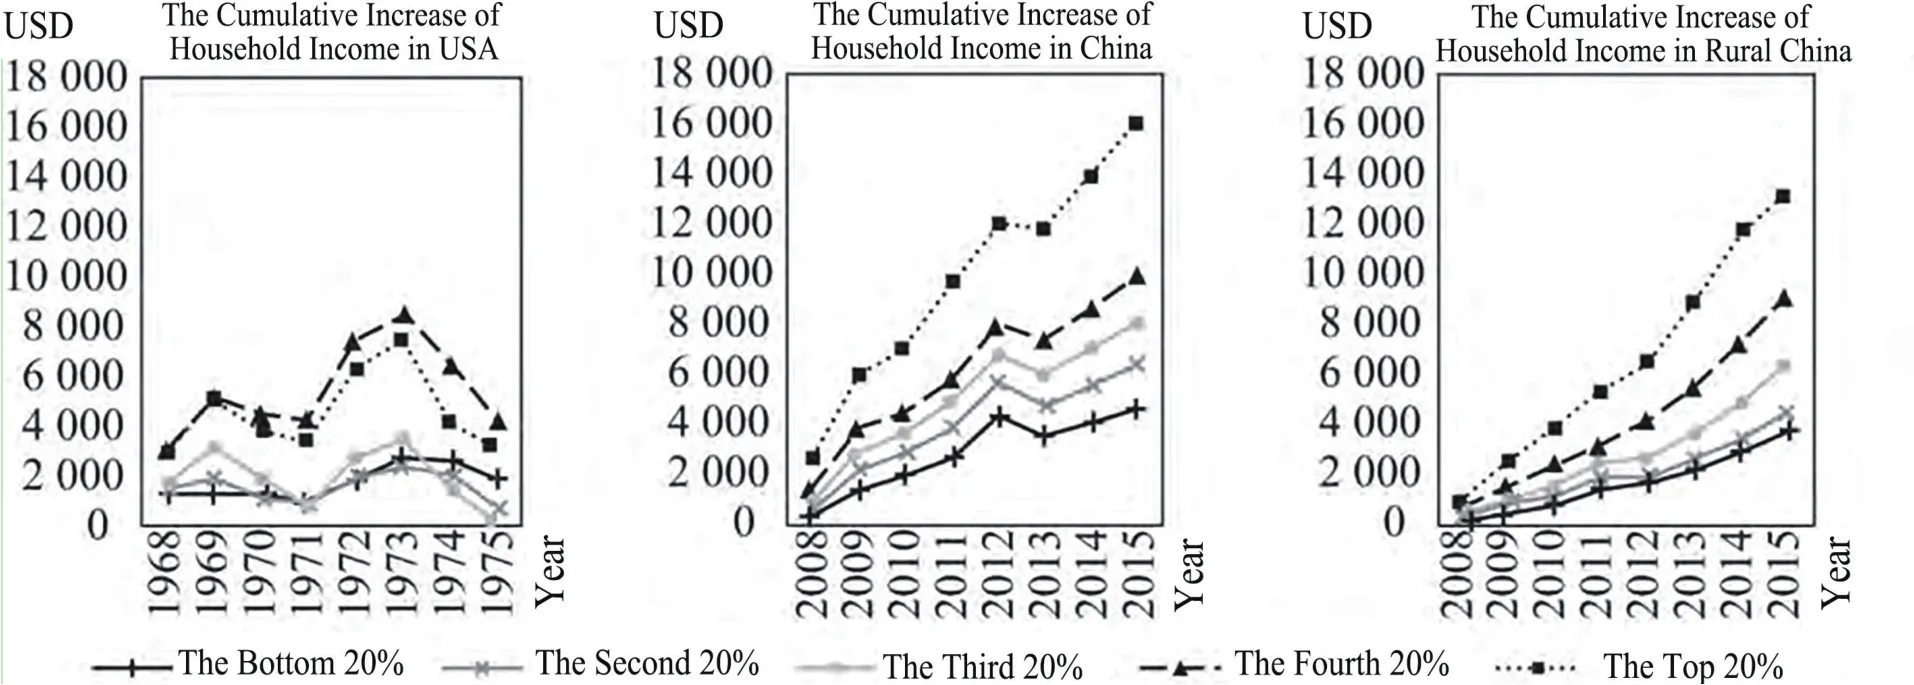
Figure 6 The growth trend of the quinquepartite household income of China and the USNotes: For better comparability between the household incomes, all the figures concerning the cumulative increase of household income in China and the US are denominated in 2015 USD.Source: The figures concerning the quinquepartite household income of China between 2007 and 2015 are from the database of the China National Bureau of Statistics;the figures concerning the quinquepartite household income of the US between 1967 and 1975 are from the database of the US Bureau of Labor Statistics; the PPP conversion factor is based on the International Comparison Project Database of the World Bank; the consumer price index is based on International Financial Statistics and the data files of the International Monetary Fund (IMF).
3.5 Opportunities unequal in property income and “winner-take-all” harming social fairness
Unequal opportunities in property incomes result in “winner-take-all” (Ma & Chen, 2011). China,since 2000, with an ever-growing capital market, has increasingly counted on its capital market to allocate the fruits of economic growth and property income has become a most important source of residential income. However, the problem of inequality arises.Opportunities and rights in property incomes are not equally shared among the residents. For example,urban residents with a house can enter the real estate market with their “Real Estate Certificate” and make money with that. However, most farmers, even though they have a rural house, cannot follow suit, for they do not have a “Real Estate Certificate.” This has also been verified by investigation in recent years. In a survey “Who can get the most benefits from ‘property incomes?’” co-released by the People’s Tribune and people.cn, at the top of the list are monopoly executives, private entrepreneurs and leading officials,while farmers, ordinary workers and migrant workers are ranked at the very bottom (“One-thousand-person Questionnaire” Research Team of People’s Tribune,2007). For a long time, due to the uneven development of China’s urban and rural capital market, there has been a wide gap between urban household incomes and rural household incomes, for the large number of middle-and-low-income rural people in fact have little access to property incomes. Under the dual influence of unequal access to investment and uneven allocation of wealth, the wealth of the society is flowing towards a few high-income people at an increasing rate,causing an even sharper wealth polarization and largely harming the principle of “fair competition” in society.
4. Policies proposed to strengthen the middle stratum
From the perspective of historical comparison,China, with its GDP per capita being close to USD 8,000, in terms of its economic development level,is well qualified to build a middle-stratum society.It is not wise to attribute the small scale of the Chinese middle stratum to the state of the country’s economy. The truth is that even the USD 8,000 is an astronomical figure for many people in China. The core problem lies in wealth distribution, in which residents do not get the portion they should have, and the wealth polarization is worsening. To counter the problem, we propose the following policies:
First, build a fair environment for wealth growth and prioritize the improvement of the rural capital markets.
Recent years has seen a rapid rise of urban capital markets and an ensuing surge of real estate property income and capital income. However, the rural capital markets have lagged far behind. Rural real estate property and land cannot bring income equivalent to their market value, resulting in a wider and wider gap between urban and rural residential incomes. To bridge the gap, a fair environment for wealth growth must be built, and above all, the rural capital markets must be improved. Land, in any country, is the most important element of capital.The rural capital markets must be activated so that the farmers can be rewarded with incomes that are equivalent to their property. It will not only directly increase the rural residents’ property income, but also will more efficiently deploy the rural resources like land and housing, thereby enhancing rural labor production and raising the farmers’ overall income.
Second, the enterprises and government should give away a certain portion of wealth to help raise the overall level of residential income.
The growth of the middle stratum is sure to inspire more consumption, thereby bringing more profits to enterprises and more tax revenue to the government(Li, 2011). In other words, enterprises and the government stand to get benefits from the growth of the middle stratum. Therefore, they are advised to give away part of their income to help expand the middle stratum and thus boost consumption. Set the GDP and population of 2015 as the background, if enterprises give away 4% of their profits, each employed adult will reap RMB 3,000 more for their annual income before tax; if the government relinquishes 3% of its income,RMB 2,250 will be added to the annual income before tax of each employed adult—that would amount to RMB 5,250 in total, which would give 25 million people possible access to the middle stratum and raise the share of middle stratum members by 2%. This is only an abstract statistical analysis to display the link between the wealth relinquishment of enterprises and the government and the growth of the middle stratum.It requires more feasible and targeted policies to clearly stipulate how to transfer the wealth to residents.
Third, income incentive plans should be introduced to key groups like skilled workers and new professional farmers.
The rising of the middle stratum in scale and proportion in a short time requires targeted measures to increase the incomes of the key groups. Skilled workers and new professional farmers, from the perspective of career prospect and income level,rank as the most important potential middle-stratum candidate for their large potential of income growth and important role in inspiring others.①As shown in Document No. 56 Implementation Opinions of the State Council on Stimulating the Vitality of Key Groups and Increasing the Income of Urban and Rural Residents issued by General Office of the State Council of China on Oct 21, 2016.They are definitely the major target group for the distribution system reform and income incentive plans. For those skilled workers, salary incentive mechanisms must be improved to link payment with workload and level of skills. For new professional farmers, more agricultural technical training and support must be provided and large industrial operations in agriculture need to be duly developed by breeding new types of agricultural business entities and agricultural socialized-service entities like family farms, major farmers, farmer cooperatives and agricultural enterprises.
Fourth, middle stratum career plans should be set up for key groups like college graduates and migrant workers.
College graduates and migrant workers are the backup of the middle stratum (Li, 2015). In 2015, the population in China with and above a university degree reached 170 million. There were 270 million migrant workers, the total number adding to 440 million. If all those people become middle stratum, the growth of the Chinese middle-income group in size and proportion will be obvious. However, the reality is that the very two groups are facing challenges when seeking a middle-stratum career. According to the sixth national census, the average unemployment rate of people aged between 15 and 29 was 9%, notably higher than that of other groups. Among the unemployed portion, 44% were college graduates, masters and doctors, 50% were young migrant workers and the last 6% were young people in towns with low academic qualifications. It is strange that, college graduates and migrant workers, as distinctively different as they are,should suffer from the same fate of unemployment in their career. Here is the reason: On the one hand,medium and low-end industries have long dominated China, preventing the well-educated talents from using what they have learned to increase their incomes; on the other hand, the cultivation of professional skilled personnel and the market demand for them is largely mismatched, creating employment problems for young migrant workers. Therefore middle stratum career plans are suggested here to help the college graduates and migrant workers out of their difficulty: First, promote industrial transformation and upgrading, increase the supply of high-skill jobs, and better balance the cultivation of talents and market demand, and make market-oriented adjustments to the discipline setting and talent cultivation; next, empower the migrant workers to enjoy technical training in their working area and make the training as practical as possible (Li,2011). Clearing the way for their entry into the middle stratum for these two groups is the ultimate goal.
Fifth, make education resources more equally shared and help the under-stratum move up the social ladder.
To adjust the income distribution alone cannot uproot the wealth polarization, which looks like an outcome of unequal incomes but in fact comes from uneven resource deployment, especially the unequal education resources (Li, 2010 & Li, 2012). Education decides one’s career and income. If education cannot be equally shared, the wealth polarization is sure to be intensified. Apart from these policies to adjust income distribution, there is another focus: To make education resources more equally shared and help the under-stratum move up the social ladder. Currently there are two underlying problems in the deployment of education resources: First, superior education resources are excessively concentrated in urban areas, especially in urban rich agglomerations, while they are scarce in suburbs and rural areas; second,the school enrollment is only open to students whose registered living place is nearby, hugely forcing up the housing prices in the superior school districts,making it harder for low-income families to approach high-quality education. In response, two steps must be taken: First, move more education resources to the suburbs and rural areas, and balance the allocation of education resources; second, remove restrictive policies on school enrollment, open education resources to all and realize equal access to education. What’s more, as the Internet provides more approaches and opportunities for equalizing education, it is suggested that high-quality education resources be combined with the Internet to make the education resources more equally shared, to provide the best possible education for everyone and finally to eradicate the wealth polarization.
In conclusion, a middle-stratum society requires not merely high levels of economic development, but more importantly, it must be preceded by a series of relatively fair and reasonable resource distribution systems, with balanced access to resources as well as balanced distribution of resources like income,education and employment. Only when everything is going fairly can the middle stratum in China come to grow and a middle-stratum society finally takes shape.
(Translator: Wu Lingwei; Editor: Yan Yuting)
This paper has been translated and reprinted with the permission of Journal Of Renmin University of China, No.3, 2017.
C. Wright Mills. (1951).White collar: The American middle stratum. New York: Oxford University Press.
Clark Kerr, F. H. Harbison, J. T. Dunlop, and C. A. Myers. (1960). Industrialism and industrial man.International Labour Review,82 (1).
Huntington & Samuel P. (1991).The third wave: Democratization in late twentieth. Norman: University of Oklahoma Press.
Kacapyr, Elia, Peter Francese & Diane Crispell. (1996). Are you middle stratum? Definitions and trends of US middle-stratum households.American Demographics, (10).
Lash S. & J. Urry. (1987).The end of organized capitalism. Cambridge: Polity Press.
Li Chunling. (2011). Middle stratum consumption level and consumption pattern.Guangdong Social Sciences, (4).
Li Peilin & Tian Feng. (2010). The inぼuence of human capital on social and economic status in Chinese labor market.Society, (1).
Li Peilin. (2015). The growth of the middle stratum and the olive-shaped society.International Economic Review, (1).
Li Qiang. (2010).Social stratification in contemporary China: Measurement and analysis. Beijing: Beijing Normal University Press.
Li Qiang. (2011). Semi-integration and non-integration in the process of Chinese urbanization.Hebei Academic Journal,(5).
Li Qiang. (2012). Social stratification and equity and justice in the social space field.Journal of Renmin University of China, (1).
Li Qiang. (2015). Three important channels for the formation of middle stratum society in China.Study & Exploration, (2).
Li Qiang. (2016). How far is China away from an Olive-shaped country: Sociological analysis of the development of the middle stratum.Exploration and Argument, (8).
Ma Mingde & Chen Guanghan. (2011). Income inequality of Chinese residents: An analysis based on property income.Journal of Yunnan University of Finance and Economics, (6).
“One-thousand-person Questionnaire” Research Team of People’s Tribune. (2007). Survey and analysis of people’s views on property income.People’s Tribune, (23).
Rose, S. (1983).Social stratification in the United States. Baltimore: Social Graphic Co.
Sun Yang. (2015). Ups and downs of the middle stratum of the Chinese Mainland.Hong Kong Phoenix Weekly, (32).
William Thompson & Joseph Hickey. (2005).An introduction to sociology. New York: Harper Collins College Publishers.
Zheng Bingwen. (2011). Middle income trap and China’s development path— From the perspective of International experience.Journal of Chinese Population Science, (1).
Zhou Xiaohong. (2005).A survey of middle stratum in China. Beijing: Social Sciences Literature Press.
 Contemporary Social Sciences2017年6期
- Contemporary Social Sciences的其它文章
- The Status Quo, Opportunity and Approach—the Development of Ethnic Minorities in the Context of the Belt and Road Initiative
- Ontological Foundation of Chinese Philosophy on the Implicit Beauty of Images
- Beyond Individualism Perspective of Trauma: Evidence for Adopting Collective Narratives for Empowering Long-Term Rehabilitation for Children of the Ethnic Qiang People Who Have Been Affected by Disaster
- Unpredictable Sharing Economy:Barbaric Growth, Deceptive Representation and Divergent Regulation
- Change in Public Administration from the Perspective of Risk Society
- A Spatial Turn of Folklore in the Context of Urbanization: From Folk Culture to Mass Culture