
Performance of a data-driven technique applied to changes in wave height and its effect on beach response
2016-09-07 07:31:36JosHorrilloCrlloHrshinieKrunrthnShunqiPnDominicReeve
Water Science and Engineering 2016年1期
Jos′e M.Horrillo-Crllo*,Hrshinie KrunrthnShun-qi Pn,Dominic Reeve
aEnergy&Environment Research Group,Zienkiewicz Centre for Computational Engineering,Swansea University,Bay Campus,Swansea SA1 8EN,UKbHydro-environmental Research Centre,School of Engineering,Cardiff University,Cardiff CF24 3AA,UK
?
Performance of a data-driven technique applied to changes in wave height and its effect on beach response
Jos′e M.Horrillo-Caraballoa,*,Harshinie Karunarathnaa,Shun-qi Panb,Dominic Reevea
aEnergy&Environment Research Group,Zienkiewicz Centre for Computational Engineering,Swansea University,Bay Campus,Swansea SA1 8EN,UK
bHydro-environmental Research Centre,School of Engineering,Cardiff University,Cardiff CF24 3AA,UK
Available online 2 March 2016
Abstract
In this study the medium-term response of beach profiles was investigated at two sites:a gently sloping sandy beach and a steeper mixed sand and gravel beach.The former is the Duck site in North Carolina,on the east coast of the USA,which is exposed to Atlantic Ocean swells and storm waves,and the latter is the Milford-on-Sea site at Christchurch Bay,on the south coast of England,which is partially sheltered from Atlantic swells but has a directionally bimodal wave exposure.The data sets comprise detailed bathymetric surveys of beach profiles covering a period of more than 25 years for the Duck site and over 18 years for the Milford-on-Sea site.The structure of the data sets and the data-driven methods are described.Canonical correlation analysis(CCA)was used to find linkages between the wave characteristics and beach profiles.The sensitivity of the linkages was investigated by deploying a wave height threshold to filter out the smaller waves incrementally.The results of the analysis indicate that,for the gently sloping sandy beach,waves of all heights are important to the morphological response.For the mixed sand and gravel beach,filtering the smaller waves improves the statistical fit and it suggests that low-height waves do not play a primary role in the medium-term morphological response,which is primarily driven by the intermittent larger storm waves.
?2016 Hohai University.Production and hosting by Elsevier B.V.This is an open access article under the CC BY-NC-ND license(http:// creativecommons.org/licenses/by-nc-nd/4.0/).
Beach profile;Canonical correlation analysis;Data-driven technique;Empirical orthogonal function;Forecast;Statistical model;Wave height threshold
1.Introduction
Shorelines are changing due to construction and development,as part of strategic approaches to flood and coastal management and shoreline management plans.As a result,in recent years there has been a greater need for more robust methodologies for incorporating risk assessments within coastal engineering design.The anticipated changes in climate arising from a rise in global temperatures will change wave and water level conditions,affecting the susceptibility of coastlines and beaches(Sutherland and Gouldby,2003).The stability of many coastlines and beaches depends on the characteristics of the area in which they are located.Taking this into account,there is a need to understand how coastlines, and,in particular,beaches,react during storms,and how beach profiles respond to sequences of waves and storms.Without this knowledge,it is extremely difficult to provide accurate assessments of how coastlines and beach profiles interact and how these interactions are likely to change over time. Furthermore,it is important that shoreline management plans include this information so that coastal managers are able to have confidence in predictions of beach behaviour.Such plans typically require possible morphological changes to be assessed over a period of up to 100 years into the future.This requirement is difficult to meet with current forecastingmethods,and estimates are often determined in an ad hoc manner on a case by case basis.Process-based morphological models have been developed to estimate meso-scale coastal morphological changes,but are yet to be used as a routine part of coastal management.The process-based models have performed well for short-term predictions,but they encounter difficulties when applied to meso-scale cases.Not only are these models difficult to operate,they can also suffer from instability and require significant computing and data resources for medium-to long-term prediction.As a result,some of the broad morphological tendencies observed in practice are difficult to reproduce reliably(de Vriend et al.,1993;Pan et al.,2010).
This has encouraged the development of data-driven techniques that are based entirely on analysis and extrapolation of observations(R′o.zy′nski,2003;Haxel and Holman, 2004;Reeve et al.,2016).With the growing amount of observations available from coastal monitoring programs in the UK and elsewhere and with the development of more sophisticated statistical analysis techniques,data-driven methods offer an additional alternative to the traditional methods available for meso-scale prediction.The underlying argument for employing data-driven methods is as follows: Predicting beach morphology is difficult.Predicting the wave characteristics is also difficult but is being done on an almost routine basis for navigation,logistics,and coastal management applications.If we can establish a strong relationship between the wave characteristics and beach response from historical records,then we can use this relationship,together with forecasts of the wave characteristics,to create forecasts of beach morphology.The method should work if(a)a strong relationship can be established between some measurements of wave activity and beach response,and(b)the conditions experienced in the forecast period are statistically similar to those upon which the relationship has been determined. This leaves open the question of which measurements of wave activity and beach morphology will provide the best linkage.
One method that has proven to be very useful in this context is canonical correlation analysis(CCA).CCA belongs to the family of methods based on correlation techniques and measures the relationship between the observed values of two sets of variables.It has been used with measurements from the Field Research Facility(FRF)at the Duck site in North Carolina,USA,by Larson et al.(2000)to detect coherent patterns in the wave and beach profile data and then to use these to predict the beach profiles on the basis of the waves alone.The researchers used a parametric description of waves based on the wave height and wave energy,and found the best results with wave height.Horrillo-Caraballo and Reeve(2008) extended this study to investigate how the choice of distribution function used to describe the wave height can influence the quality of predictions.R′o.zy′nski(2003)used CCA to evaluate the evolution patterns of multiple longshore bars and the interactions between them in Lubiatowo,Poland.The sensitivity of the method to the data sampling rate and the duration of the records were investigated by Horrillo-Caraballo and Reeve(2010).They analysed the quality of forecasts made using CCA for beaches at Duck,USA and Milford-on-Sea,UK.They concluded that there is no strong reduction in prediction accuracy over the forecast period and that there is an increase in the forecast error when the duration and density of the records used to determine the regression matrix are degraded.Reeve and Horrillo-Caraballo(2014) used data-driven methods to forecast the behaviour of beaches with different exposures caused by nearby structures.They found that CCA could obtain strong correlation between the local beach behaviour and the offshore wave conditions, thereby encapsulating the effects of diffraction on beach evolution.This study extended that investigation to examine the sensitivity of the relationship between the wave height and beach response by invoking a graduated threshold for the wave height.
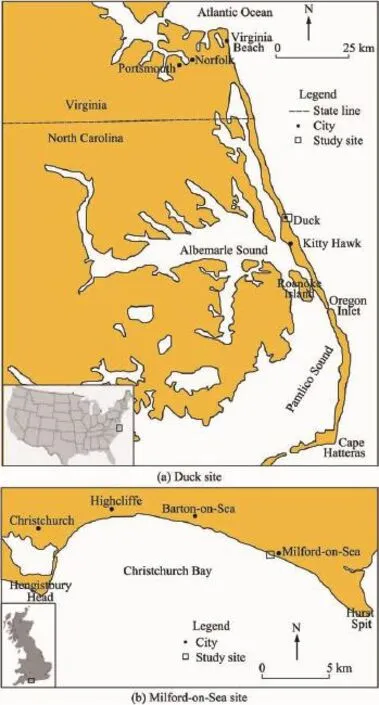
Fig.1.Location of study sites.
We studied two different sites:the Duck site,located in North Carolina,on the east coast of the USA,which has sandy beaches,and the Milford-on-Sea site,located at Christchurch Bay,on the south coast of England,where beaches are classified as mixed sand and gravel beaches(Fig.1).
At the Duck site,the US Army Corps of Engineers has maintained a long-term campaign of measurement of waves, tides,currents,local meteorology,and beach response since its creation(FRF,2007).For this study we used historical wave records and monthly beach profiles covering a period of 25 years.For the Milford-on-Sea site,the approximately biannual beach profile surveys and continuous wave recordings cover a period of over 18 years.This measurement program is part of the local shoreline management plan and the response of the mixed sand and gravel beaches in this area have been monitored since 1987(Bradbury et al.,2003).
The two data sets have been described in detail by Horrillo-Caraballo and Reeve(2010)and the interested reader may find more information in that paper.Just as different sediment transport equations are required to describe the movement of sand and gravel in process-based models,so it might be thought that different statistical methods might be required to describe the two different beach types.Horrillo-Caraballo and Reeve(2010)demonstrated that this was not the case and that CCA could perform well with both beach types.Furthermore, degrading the sampling rate of the Duck data to make it similar to the Milford-on-Sea measurements resulted in only a small increase in forecast errors.Earlier studies have focused on establishing the relationship between the wave height or wave energy and beach response,on the basis that the active beach profile is shaped predominantly by wave action.Here, we extended this concept based on the hypothesis that the significant changes in beach morphology are caused by the events that cause the greatest sediment transport,that is,larger waves.We revisited two sites that were the subject of earlier studies to investigate whether imposing a threshold on the wave height can improve the correlation between waves and beach response,thereby leading to an improvement in forecasting ability.
This paper is structured as follows:In section 2 a brief outline of CCA is provided.The measurements at the two study sites are described in section 3.The analysis methodology is given in section 4,followed by a presentation of the main results in section 5.The paper closes in section 6 with conclusions.
2.Canonical correlation analysis
CCA is one of a family of correlation techniques but is distinct from factor/principal component analysis despite certain conceptual and terminological similarities.CCA is used to investigate the intercorrelation between two sets of variables,whereas factor/principal component analysis or the empirical orthogonal functions(EOFs)method identifies the pattern of relationships within one data set(Clark,1975). Before CCA is performed,it is customary to smooth the observations to reduce noise.Here,we expanded each data set into EOFs,truncated the EOF expansion,and then recombined the EOFs to create filtered data sets.If the two original data sets are denoted as Y(for example,if the wave height probability density distributions constitute a data matrix with size nt×ny),and Z(for example,if the time sequence of beach profiles constitute a data matrix with size nt×nz),a regression matrix can be derived between the two matrices,representing the established correlation between the dominant patterns in the two variables.This means that if the variable Y is known for some future time,the other variable Z can be predicted using the regression matrix(Larson et al.,2000).The predictions Zp,based on a predicted wave matrix Yp,are given by the following: where A is a regression matrix that defines the relationship between the two variables based on historical measurements. A detailed explanation of CCA and the solutions of Eq.(1)can be found in R′o.zy′nski(2003).The variable Zpcontains the beach profile measurements and the variable Ypcontains the corresponding values of wave conditions represented as a probability density function(pdf).As wave measurements are generally easier to obtain than beach profile measurements, Eq.(1)can be used to forecast beach profiles from wave conditions(Larson et al.,2000).The quality of the data used to define the regression matrix will of course constrain the quality of the prediction obtained.

3.Field data
3.1.Duck site
3.1.1.Beach profiles
The US Army Corps of Engineers coastal monitoring facility,i.e.,FRF,at Duck,North Carolina,USA,has been monitoring the nearshore area for more than 33 years, surveying some of the area at least twice a month,resulting in hundreds of surveys.
The area is characterized by regular shore-parallel contours, a moderate slope,and bars in the surf zone.An outer storm bar is present at about 4.5 m of depth,relative to the mean water level,and an inner bar is present between 1.0 and 2.0 m of depth relative to the mean water level.The sediment includes a medium-to-fine sand mixture with a grain size decreasing from 1 mm on the foreshore to 0.1-0.2 mm offshore.According to Birkemeier et al.(1981),the tide in the area is considered micro-tidal,with a tidal range between 0.7 m for neap tides and 1.5 m for spring tides.
The beach profile data used for this study were obtained from the FRF webpage labelled as Profile 62(FRF,2007), covering the period from July 1981 to January 2006(226 profiles).The elevations of the profile data were measured relative to the US 1929 National Geodetic Vertical Datum (NGVD29).Profiles were interpolated to regular spacing at a 2-m resolution using the spline method described in Li et al. (2005).The interpolation was carried out over a domaindefined as 70 m from the main baseline(dune level position), up to 910 m offshore(around 8 m of water depth),in order to maximize the number of usable profiles and to extend the profiles out to the depth of closure.The depth of closure at this site has been estimated to be in water depths of between 4 and 6 m by Larson and Kraus(1994).The resulting data set is shown in Fig.2 as a colour-coded plot of elevations.
3.1.2.Wave data
Wave measurements may also be accessed from the FRF webpage.Significant wave height(Hs),and peak spectral wave period(Tp),were obtained from a directional waverider buoy located approximately 3 km offshore at a water depth of 17.4 m(FRF,2007).The wave data obtained from the buoy are regularly recorded every 6 h and,during some particular periods,hourly values have been recorded(Fig.3).
3.2.Milford-on-Sea site
3.2.1.Beach profiles
Christchurch Bay encloses a shallow embayment with an average depth of approximately 7 m relative to the chart datum (CD),demarcated by Hengistbury Head to the west and Hurst Spit to the east(Fig.1(b)).Waves undergo shoaling and refraction in this area due to the shallow and wide shoreface of Christchurch Bay.The bay is characterized by dominant waves from the southwest(http://www.scopac.org.uk/scopac_ sedimentdb/chrst/chrstmap.pdf),and Hengistbury Head has played a mooring role for Christchurch Bay,resulting in a classical spiral beach planform(Halcrow Group,1999). Christchurch Bay is more exposed to swell waves originating in the Atlantic Ocean than the wind waves coming from the east and southeast;this,combined with the shallow bathymetry,means that storm waves are more depth-limited in this area(http://www.scopac.org.uk/scopac_sedimentdb/chrst/ chrstmap.pdf).
The beach profile data used for this study were accessed from the Channel Coastal Observatory(CCO)webpage(CCO, 2006)and are labelled as Profile 5f00107.Surveys for the period from November 1988 to January 2006(50 profiles) were obtained.All profile elevation data are referenced to the Ordnance Survey Datum Newlyn(ODN).Only surveys extending from the dune region out to a water depth of the mean low water level(MLWL)were incorporated into the analysis.Each profile was interpolated to regular spacing with a 0.5 m resolution according to the method of Li et al.(2005). Fig.4 displays the subset of measured profiles along Profile 5f00107 that were used in CCA.
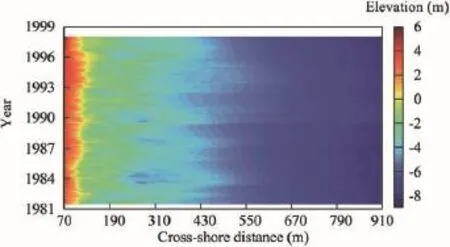
Fig.2.Historic bathymetric surveys of Duck profile from July 2,1981 to January 13,1998.
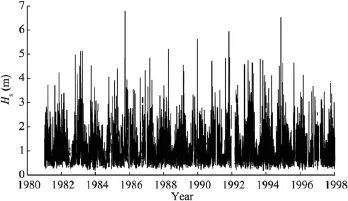
Fig.3.Hsmeasurements at Duck site from July 2,1981 to January 13, 1998.
3.2.2.Wave data
Measurements from a waverider buoy deployed at approximately 10-12 m of water depth are available.Hsand Tphave been obtained from this buoy.The predominant wave direction in this area is from the southwest.Data from the wave buoy site have been compared with the synthetic offshore wave data from the UK Met Office that have subsequently been transformed to the wave buoy site,through numerical modelling.Bradbury et al.(2004)compared a one-month sample of measured and synthetic data.They noted that there was a clear relationship between measured and modelled conditions,concluding that their confidence in the offshore synthetic wave data,the numerical wave transformation process,and the wave buoy measurements was high (Fig.5).
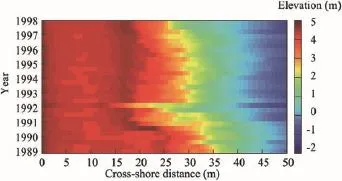
Fig.4.Historic bathymetric surveys of Milford-on-Sea profile from November 1,1988 to January 13,1998.
The beach profiles at the Duck site and the Milford-on-Sea site present some clear differences.The beach material at the Duck site is sand,whereas,at the Milford-on-Sea site,it is a mixture of sand and gravel.Due to these differences,thecharacteristics of the beaches of the two sites also differ (Horrillo-Caraballo and Reeve,2010).The extent of the survey data is one of the significant differences between the sites.The Duck beach profile measurements extend considerably further offshore,to what is considered the depth of closure,while at the Milford-on-Sea site,the beach profile measurements extend to the low water level(LWL).While this makes comparison of beach volumes over time problematic,it is practical to assume that the LWL and the mean high water spring(MHWS)are quite sensitive to nearshore processes on an annual and biannual time scale and can be used as indicators of morphological changes in the beach profile.The active part of the upper beach was the focus of this study.The surveys of both sites covered this section of the beach.
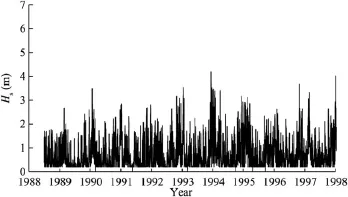
Fig.5.Hsmeasurements at Milford-on-Sea site from November 1, 1988 to January 13,1998.
4.Methodology
The measurements at the two sites have been processed to generate series with the same sampling rate for both profiles and wave conditions,a requirement for the application of CCA.At the Duck site,the first 155 profiles were used in CCA and the remaining 71 profiles were used for comparison against the predictions obtained based on the regression matrix.For the Milford-on-Sea site,the first 29 beach profiles were analysed using CCA and the remaining 21 profiles were used for comparison with the predictions obtained from CCA on the basis of the regression matrix.Table 1 shows a summary of the data used for the analysis.
We followed the procedure detailed in Horrillo-Caraballo and Reeve(2010)and described the waves with a nonparametric empirical distribution function.The wave conditions for each interval were converted into a single function by creating a pdf of significant wave height.CCA was then applied to the sequence of beach profiles and Hspdfs.Figs.6 and 7 show the empirical wave height distributions for the two sites.For the Duck site there is more information,as the FRF was established at the beginning of the 1980s and because of the relatively high frequency of sampling.The data at the Milford-on-Sea site are not as frequent as at the Duck site.It has been monitored from the late-1980s and profiles are measured generally twice a year.The empirical wave height distributions were created by combining the separate distributions calculated from each interval.In order to investigate the importance of large waves to the response of the beach morphology,the empirical wave height distributions were calculated for different wave height thresholds(TH),which were set at intervals of 1 m,yielding six different pdfs for the Duck site and four for the Milford-on-Sea site.The height of individual peaks in the distribution could change as TH varied because TH was applied to the pdfs for each interval before the combining.For the Duck site,TH was increased to a maximum of 5 m,while for the Milford-on-Sea site the maximum TH was 3 m.
5.Results
The first step in CCA was to correlate the profile response to the offshore wave height.The purpose was to investigate whether there was any relationship between the wave statistics and the observed pattern of variation in the profile response. CCA was carried out using three canonical modes,following the procedure of Horrillo-Caraballo and Reeve(2010),who found that this led to the best performance of the prediction analysis.
Comparisons are shown for the Duck and Milford-on-Sea data sets using the data defined in Table 1 and the predictions of eight years into the future(up to 2006),where the prediction for each particular date was made on the basis of the regression matrix and the pdf of significant wave heights in the period between that date and the date of the previous survey.For the Duck site,the CCA regression matrix was based on the data from July 2,1981 to January 13,1998.For the Milford-on-Sea site,the CCA regression matrix was determined using beach profiles and significant wave heights for the period from November 1,1988 to January 13,1998, and the profile predictions for the two sites were calculated using wave data over the period from January 13,1998 to January 30,2006(see Table 1).
Prior to the analyses,the temporal mean was subtracted from all data sets.According to Fig.8(a),the first three spatial EOFs obtained from the profile data sets at the Duck site explained 69%of the variation in the data.The first spatial eigenfunction(E1)explained 35%of the variation around themean,the second(E2)explained 21%,and the third(E3) explained 13%.At the Milford-on-Sea site(Fig.8(b)),79%of the variation is explained by the first three spatial EOFs.E1 explained 43%of the variation,E2 explained 25%,and E3 explained 11%.The difference in percentages between the two sites can be interpreted as follows:The data from the Milfordon-Sea site need fewer modes to describe the entire data set and so contain less complexity than the data from the Duck site.This is partly explained by the length of monitoring at the two sites and the frequency of observations.The Duck site captures shorter-term fluctuations and is also more likely to contain extreme events due to its greater duration.For both sites,the EOFs describing the profile shapes show a rich structure due to the presence of bars,but the shapes of the EOF modes can be used to determine mean properties of the impact of the bar over the profile(Larson et al.,2000).Additionally, the temporal EOFs(not shown in this paper)can be used to determine trends of profile changes,oscillatory cycles,and relate them to coastal processes(Horrillo-Caraballo et al., 2015).

Table 1 Summary of data used in this study.
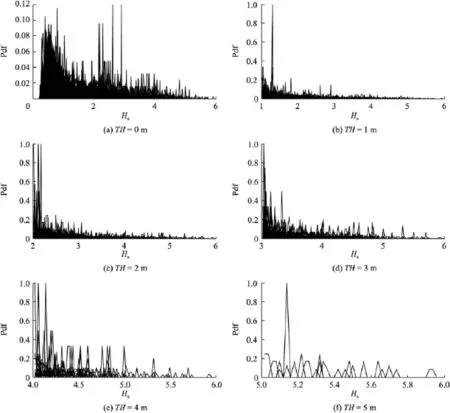
Fig.6.Empirical wave height distribution with different TH values at Duck site.
The root mean square error(RMSE)was used to determine the quality of fit between measured and predicted profiles. Two cases are shown:the RMSE between the prediction and measurement as a time averaged function over the profile,and the RMSE as a spatially averaged function over the forecast period.
Fig.9(a)shows results for the Duck site,for the cases with TH=0 m,TH=1 m,TH=2 m,TH=3 m,TH=4 m,and TH=5 m.The general behaviour of the results from the use of different wave height thresholds is similar:The time-averaged RMSE increases where major changes in the elevations are present.This is due largely to the movement and change of position of the bars in the beach profile.If no wave height threshold is considered(TH=0 m),the time-averaged RMSE decreases between 70 m and 180 m of the cross-shore distance with respect to the other thresholds,but the time-averaged RMSE increases when predicting the first bar and the offshore area(between 470 m and 850 m of the cross-shore distance).The area between 270 m and 420 m is more affected by larger waves and the change of position of the bars.
Fig.10(a)shows the results for the Milford-on-Sea site,for the cases with TH=0 m,TH=1 m,TH=2 m,and TH=3 m.At the upper beach,where there is very little movement,the time-averaged RMSE is,not surprisingly,very small.Further seaward the RMSE rises,with an average valueof about 0.7 m,ranging between 0 and 1.3 m.The time averaged RMSE is largest at the upper beach crest and at around 25-27 m of the cross-shore distance.As at the Duck site,the general trends with use of different wave height thresholds are similar:The time-averaged RMSE increases where major changes in the elevations are present.If CCA is carried out with no threshold,the time-averaged RMSE increases between 17 m and 47 m of the cross-shore distance with respect to the other thresholds.The time-averaged RMSEs at the Duck site are generally smaller across the profile when no threshold is employed.However,at the Milford-on-Sea site,setting a wave height threshold leads to an improvement in forecast error over 20-50 m of the crossshore distance.
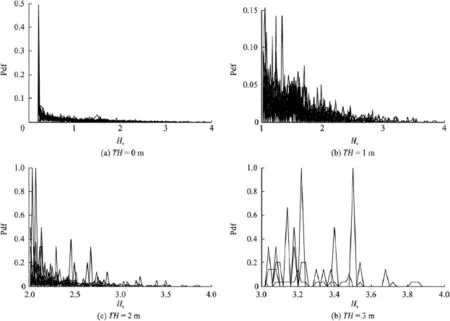
Fig.7.Empirical wave height distribution with different TH values at Milford-on-Sea site.
An investigation of the dependence of forecast error upon the forecast window was also made.Figs.11 and 12 show the spatially averaged RMSE for the Duck and Milford-on-Sea sites over the eight-year forecast period.They demonstrate one of the advantages of data-driven methods over process based methods.As the forecast window lengthens,there is no evidence of a commensurate increase in error,as one often finds with a time-stepping solution of differential equations. Instead,the general trend of errors is remarkably consistent.At the Duck site,there are two periods where there is an increase in the spatially averaged RMSE that can be traced to unusual sequences of storms(Capobianco et al.,1997;FRF,2015). This highlights one of the disadvantages of data-driven methods when an unusual wave event occurs that is notrepresented in the data used to compute the regression matrix: Large discrepancies can be expected between forecasts and actual beach profiles.The spatially averaged RMSE at the Milford-on-Sea site(Fig.12)fluctuates between 0.2 m and 1.0 m,with a peak after the beginning of 2004.The explanation for this peak can be related to a gap in the wave records at the end of 2003.In this case,the calculation of the empirical wave height distribution for this time of the year is uncertain. Fig.12 also clearly shows that the condition of TH=1 m provides consistently better forecast accuracy than the condition of TH=0 m.
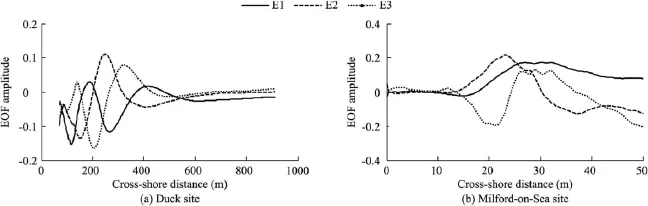
Fig.8.First three spatial EOFs determined from measured beach profiles at two sites.
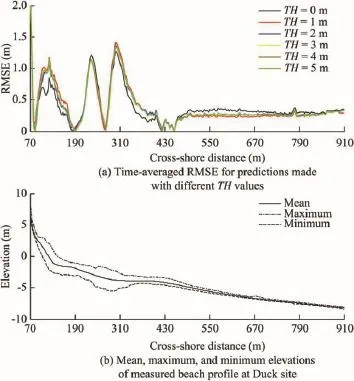
Fig.9.Time-averaged RMSE for predictions made with different TH values and mean,maximum,and minimum elevations of measured beach profile at Duck site.
Almeida et al.(2011)concluded in their study in Praia de Faro,in southern Portugal,that waves higher than 2.3 m were responsible for the main morphological changes in the berm and beach face and waves higher than 3.2 m were responsible for the changes in the sub-tidal area and long-shore bars.We have found a rather more nuanced picture from our analysis.
Based on the wave height threshold analysis,there is a difference in the relationship between waves and morphological response at the two sites.Removing the smaller waves leads to an increase in the forecast error for the upper beach and a decrease in the forecast error for the lower beach at the Duck site,while it leads to a reduction of the forecast error across the whole profile at the Milford-on-Sea site.An initial interpretation of these results is that,for the more gently sloping sandy beach at the Duck site,the contribution of smaller waves to the morphological evolution of the upper beach should not be ignored,whereas for the mixed beaches at the Milford site the contribution of smaller waves is less important.
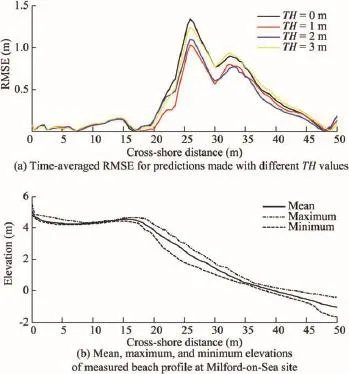
Fig.10.Time-averaged RMSE for predictions made with different TH values and mean,maximum,and minimum elevations of measured beach profile at Milford-on-Sea site.
6.Conclusions
In this study we have investigated the medium-term prediction of beach profiles using a data-driven technique based on CCA.Measurements from two sites have been used:the Duck site,in the USA,and the Milford-on-Sea site,in the UK. The Duck site is dominated by mildly sloping sandy beaches while the Milford-on-Sea site is a mixed sand and gravel beach with a steep gravel upper beach.
Data-driven techniques rely on finding a strong correlation between measurements of the processes causing beach changes and the beach response to these processes.Once such a correlation is established,then it can be used,in conjunction with knowledge of the forcing processes,to formulate predictions of the corresponding beach profile.Here,we have used CCA to establish correlation properties between sequences of wave conditions and corresponding measurements of beach profiles.The correlation was determined from the initial portion of the measurements.Forecasts,or,more accurate,hindcasts of beach profiles were made for the remaining portion of the measurements using the correlation and wave information for the period up to the date at which the beach profile was required.A validation of the forecast was made against the corresponding measured beach profiles. Forecasts were performed for periods of up to eight years in advance.
The choice of metric for processes and beach response has been investigated elsewhere(e.g.,Larson et al.,2000; Horrillo-Caraballo and Reeve,2008),and it has been found that the empirical wave height distribution and beach profile are good metrics.
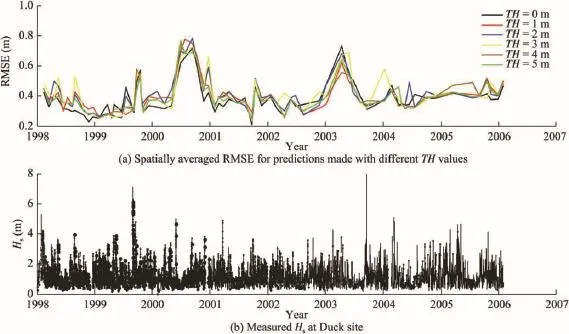
Fig.11.Spatially averaged RMSE for predictions made with different TH values and measured Hsat Duck site.
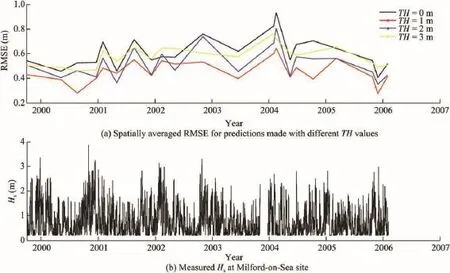
Fig.12.Spatially averaged RMSE for predictions made with different TH values indicated by label key and measured Hsat Milford-on-Sea site.
Here,our primary interest has been in investigating the hypothesis that changes in beach profile morphology are driven primarily by the largest,most energetic waves.To this end we have performed repeated analyses with wave heights exceeding a series of thresholds.A secondary aim has been to test the dependence of forecast error on the length of the forecast window.Our specific question was,is there a degradation in forecast quality within the forecast period?
We have found that the RMSE of the forecasts is dependent on the wave height threshold(TH).At the Milford-on-Sea site the forecasts were improved by setting a TH of 1 m.Further improvement in the error does not occur uniformly with increasing TH,which might be expected if beach response were being driven purely by the largest wind waves.At the Duck site,forecasts for the upper beach are best when no threshold is employed,whereas for the lower beach a small improvement in forecast error is found when a threshold is imposed.It is concluded that small-amplitude waves play an important part in shaping the upper beach profile at the Duck site,and have a rather less significant role in influencing the evolution of the lower beach,suggesting that a small amplitude swell is not a significant driver of the mediumterm evolution of the beach morphology.
The forecast errors at both sites do not exhibit growth with the forecast period,as is often found with time-stepping process-based models due to the accumulation of numericalinaccuracies.However,the forecast error can vary over time, particularly when an unusual wave condition occurs that is not represented in the data used to determine the correlation.
As coastal monitoring programs continue,and new programs begin,more data will become available,and means of extracting information useful for coastal management can be anticipated.Further research is required to determine the best metrics for correlation studies,limitations on forecast periods, the spatial and temporal distribution of forecast errors,and the dependence of forecast errors on beach type and exposure.The data-driven method based on CCA described here is one example of the sophisticated statistical techniques that can be brought to bear on this challenge,and it has been demonstrated how medium-term forecasts can be formulated.
Acknowledgements
The authors would like to thank the staff at the FRF,Field Data Collections and Analysis Branch,of the US Army Corps of Engineers in Duck,North Carolina,USA and at the Channel Coastal Observatory in Southampton,UK for making the field data available for both sites.
References
Almeida,L.P.,Ferreira,O.,Pacheco,A.,2011.Thresholds for morphological changes on an exposed sandy beach as a function of wave height.Earth Surf.Process.Landf.36(4),523-532.http://dx.doi.org/10.1002/esp.2072. Birkemeier,W.A.,DeWall,A.E.,Gorbics,C.S.,Miller,H.C.,1981.A User's Guide to CERC's Field Research Facility.Miscellaneous Report No.81-7. U.S.Army,Corps of Engineers,Coastal Engineering Research Center (U.S.).National Technical Information Service,Springfield.
Bradbury,A.P.,Colenutt,A.J.,Cross,J.,Eastick,C.,Hume,D.,2003.Evaluation of coastal process impacts arising from nearshore aggregate dredging for beach recharge:Shingles Banks,Christchurch Bay.In:The International Conference on Coastal Management.Institution of Civil Engineers,Brighton,pp.98-112.
Bradbury,A.P.,Mason,T.E.,Holt,M.W.,2004.Comparison of the performance of the Met Office UK:Waters wave model with a network of shallow water moored buoy data.In:Proceedings of the 8th International Workshop on Wave Hindcasting and Forecasting.North Shore Oahu,Hawaii.
Capobianco,M.,Larson,M.,Nicholls,R.J.,Kraus,N.C.,1997.Depth of closure:A contribution to the reconciliation of theory,practice,and evidence.In:Proceedings of the 3rd Coastal Dynamics.American Society of Civil Engineers,Reston,pp.506-515.
Channel Coastal Observatory(CCO),2006.Channel Coastal Observatory, England.http://www.channelcoast.org[Retrieved June 18,2006].
Clark,D.,1975.Understanding Canonical Correlation Analysis.Concepts and Techniques in Modern Geography,No.3.Geo Abstracts Ltd.,Norwich.
de Vriend,H.J.,Capobianco,M.,Chesher,T.,de Swart,H.E.,Latteux,B., Stive,M.,1993.Approaches to long-term modelling of coastal morphology:A review.Coast.Eng.21(1-3),225-269.http://dx.doi.org/ 10.1016/0378-3839(93)90051-9.
Field Research Facility(FRF),2007.Field Data Collections and Analysis Branch.US Army Corps of Engineers,Duck.http://www.frf.usace.army. mil/frf_home.shtml[Retrieved Aug.17,2007].
Field Research Facility(FRF),2015.Field Data Collections and Analysis Branch.US Army Corps of Engineers,Duck.http://www.frf.usace.army.mil/AnuRpt/programs/storms/storm_table.txt[Retrieved Jun.23,2015].
Halcrow Group,1999.Poole and Christchurch Bay Shoreline Management Plan.Volume 2:Physical Environment.Poole and Christchurch Bays Coastal Group,Swindon.
Haxel,J.H.,Holman,R.A.,2004.The sediment response of a dissipative beach to variations in wave climate.Mar.Geol.206(1-4),73-99.http://dx.doi. org/10.1016/j.margeo.2004.02.005.
Horrillo-Caraballo,J.M.,Reeve,D.E.,2008.An investigation of the link between beach morphology and wave climate at Duck,NC,USA.J.Flood Risk Manag. 1(2),110-122.http://dx.doi.org/10.1111/j.1753-318X.2008.00013.x.
Horrillo-Caraballo,J.M.,Reeve,D.E.,2010.An investigation of the performance of a data-driven model on sand and shingle beaches.Mar.Geol. 274(1),120-134.http://dx.doi.org/10.1016/j.margeo.2010.03.010.
Horrillo-Caraballo,J.M.,Reeve,D.E.,Karunarathna,H.,Pan,S.,Burningham,H., 2015.Multi-scale statistical analysis of beach profiles on the Suffolk Coast, UK.In:Proceedings of the Coastal Sediments 2015.World Scientific Publishing,Singapore.
Larson,M.,Kraus,N.C.,1994.Temporal and spatial scales of beach profile changes,Duck,North Carolina.Mar.Geol.117(1-4),75-94.http://dx. doi.org/10.1016/0025-3227(94)90007-8.
Larson,M.,Capobianco,M.,Hanson,H.,2000.Relationship between beach profiles and waves at Duck,NC,determined by canonical correlation analysis.Mar.Geol.163(1-4),275-288.http://dx.doi.org/10.1016/ S0025-3227(99)00119-X.
Li,Y.,Lark,M.,Reeve,D.E.,2005.The multi-scale variability of beach profiles at Duck,N.C.,USA,1981-2003.Coast.Eng.52(12),1133-1153. http://dx.doi.org/10.1016/j.coastaleng.2005.07.002.
Pan,S.,Reeve,D.E.,Davidson,M.,O'Connor,B.,Vincent,C.,Dolphin,T., Wolf,J.,Thorne,P.,Bell,P.,Souza,A.,et al.,2010.Larger-scale morphodynamic impacts of segmented shore-parallel breakwaters on coasts and beaches:An overview of the LEACOAST2 project.Shore Beach 78(4),35-43.
Reeve,D.E.,Horrillo-Caraballo,J.M.,2014.Analysis and prediction of the differential beach response within a coastal defence scheme:Herne Bay. UK.Proc.ICE Marit.Eng.167(MA1),29-41.
Reeve,D.E.,Karunarathna,H.,Pan,S.Q.,Horrillo-Caraballo,J.M.,R′o.zy′nski,G., Ranasinghe,R.,2016.Data-driven and hybrid coastal morphological prediction methods for meso-scale forecasting.Geomorphology 256,49-67. http://dx.doi.org/10.1016/j.geomorph.2015.10.016.
R′o.zy′nski,G.,2003.Data-driven modelling of multiple longshore bars and their interaction.Coast.Eng.48(3),151-170.http://dx.doi.org/10.1016/ S0378-3839(03)00024-3.
Sutherland,J.,Gouldby,B.,2003.Vulnerability of coastal defences to climate changes.Proc.Inst Civ.Eng.Water Marit.Eng.156(2),137-145.http:// dx.doi.org/10.1680/wame.2003.156.2.137.
29 June 2015;accepted 6 January 2016
This work was supported by the UK Natural Environment Research Council(Grant No.NE/J005606/1),the UK Engineering and Physical Sciences Research Council(Grant No.EP/C005392/1),and the Ensemble Estimation of Flood Risk in a Changing Climate(EFRaCC)project funded by the British Council under its Global Innovation Initiative.
*Corresponding author.
E-mail address:j.m.horrillo-caraballo@swansea.ac.uk(Jos′e M.Horrillo-Caraballo).
Peer review under responsibility of Hohai University.
http://dx.doi.org/10.1016/j.wse.2016.02.006
1674-2370/?2016 Hohai University.Production and hosting by Elsevier B.V.This is an open access article under the CC BY-NC-ND license(http://creativecommons.org/licenses/by-nc-nd/4.0/).
 Water Science and Engineering2016年1期
- Water Science and Engineering的其它文章
- Information for Authors
- An experimental study on embankment failure induced by prolonged immersion in floodwater
- Modal parameter identification for a roof overflow powerhouse under ambient excitation
- Improvement of wind field hindcasts for tropical cyclones
- Optimization of multi-model ensemble forecasting of typhoon waves
- Application of SWAN+ADCIRC to tide-surge and wave simulation inGulf of Maine during Patriot's Day storm