
Regional Warming by Black Carbon and Tropospheric Ozone: A Review of Progresses and Research Challenges in China
2015-01-05 02:01:48LIAOHong廖宏andSHANGJingjing尚晶晶
關(guān)鍵詞:晶晶
LIAO Hong(廖宏)and SHANG Jingjing(尚晶晶)
1 State Key Laboratory of Atmospheric Boundary Layer Physics and Atmospheric Chemistry, Institute of Atmospheric Physics,Chinese Academy of Sciences,Beijing 100029
2 Climate Change Research Center,Chinese Academy of Sciences,Beijing 100029
3 Graduate University of Chinese Academy of Sciences,Beijing 100049
Regional Warming by Black Carbon and Tropospheric Ozone: A Review of Progresses and Research Challenges in China
LIAO Hong1,2?(廖宏)and SHANG Jingjing1,3(尚晶晶)
1 State Key Laboratory of Atmospheric Boundary Layer Physics and Atmospheric Chemistry, Institute of Atmospheric Physics,Chinese Academy of Sciences,Beijing 100029
2 Climate Change Research Center,Chinese Academy of Sciences,Beijing 100029
3 Graduate University of Chinese Academy of Sciences,Beijing 100049
Black carbon(BC)aerosol and tropospheric ozone(O3)are major air pollutants with short lifetimes of days to weeks in the atmosphere.These short-lived species have also made significant contributions to global warming since the preindustrial times(IPCC,2013).Reductions in short-lived BC and tropospheric O3have been proposed as a complementary strategy to reductions in greenhouse gases.With the rapid economic development,concentrations of BC and tropospheric O3are relatively high in China,and therefore quantifying their roles in regionalclimate change is especially important.This review summarizes the existing knowledge with regard to impacts of BC and tropospheric O3on climate change in China and defines critical gaps needed to assess the climate benefits of emission control measures.Measured concentrations of BC and tropospheric O3,optical properties of BC,as well as the model estimates of radiative forcing by BC and tropospheric O3are summarized.We also review regionaland globalmodeling studies that have investigated climate change driven by BC and tropospheric O3in China;predicted sign and magnitude of the responses in temperature and precipitation to BC/O3forcing are presented.Based on the review of previous studies, research challenges pertaining to reductions in short-lived species to mitigate globalwarming are highlighted.
black carbon,tropospheric ozone,radiative forcing,regional warming
1.Introduction
The globally averaged combined land and ocean surface temperature exhibited a warming of0.85[0.65-1.06]℃over 1880-2012,as reported by the Intergovernmental Panel on Climate Change(IPCC)Working Group I Fifth Assessment Report(AR5)(IPCC, 2013).Human activities contributed to changes in temperature through changing concentrations of both well-mixed greenhouse gases(WMGHGs,including carbon dioxide(CO2),methane(CH4),nitrous oxide(N2O),and halocarbons)and short-lived species (nitrogen oxides(NOx),carbon monoxide(CO),nonmethane volatile organic compounds(NMVOCs),tropospheric O3,aerosols,and aerosol precursors).The radiative forcing(RF)values over 1750-2011 estimated by the IPCC AR5 are 3.00 W m?2by emissions of WMGHGs and-0.64 W m?2by emissions of short-lived species(Fig.1),indicating that short-lived species also play important roles in climate change. Among the short-lived species,tropospheric O3is estimated to have a global mean RF of 0.40 W m?2(Table 8.6 in IPCC(2013)).
Short-lived species influence climate change in several ways depending on their chemical and physical properties.Firstly,the short-lived gases can influence concentrations of WMGHGs and aerosols by chemical reactions.For example,CO,NMVOCs,and NOxare precursors of tropospheric O3.Emissions of CO and NMVOCs lead to CO2formation in the atmosphere.Emissions of NOxin the atmosphere influence concentrations of CH4by altering OH concentrations,and also contribute to nitrate aerosol formation.Secondly,some of the short-lived species,such as tropospheric O3and aerosols,exert radiative forcing to the energy balance of the earth’s climate system. Tropopspheric O3is a greenhouse gas that leads to global warming(Fig.1).Aerosols influence climate by interactions with radiation through scattering or absorbing of solar or longwave radiation,and by interactions with clouds through altering cloud properties.Major anthropogenic aerosol species in the atmosphere include sulfate,nitrate,ammonium,organic carbon(OC),and black carbon(BC),allofwhich have a cooling effect on climate except that BC has a warming effect.Thirdly,short-lived species participate in complex biogeochemical processes that can influence concentrations of WMGHGs.For example,the deposition ofnitrogen and O3can influence carbon cycle by changing land cover(Lamarque et al.,2005;Janssens et al.,2010).
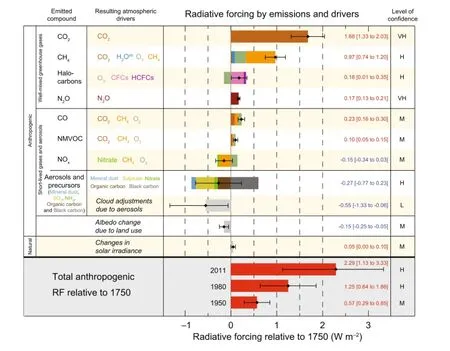
Fig.1.Radiative forcing estimates in 2011 relative to 1750 and aggregated uncertainties for the main drivers of climate change.Positive(negative)radiative forcing indicates a warming(cooling)effect on climate.(Source:Figure SPM.5 of IPCC WGI AR5 Summary for Policymakers(IPCC,2013))
Due to the unidentified sinks for atmospheric CO2,Jacobson(2005)assumed that CO2has a lifetime of 30-95 yr.Prather et al.(2012)derived that the present-day atmospheric lifetime is 9.1±0.9 yr for CH4 and 131±10 yr for N2O.Tropospheric O3was reported to have a lifetime of about 3 weeks based on modeling studies(Liao and Seinfeld,2005;Stevenson et al., 2006).Aerosols have even shorter lifetimes of several days(Kaufman et al.,2000).Jacobson(2004)compared the time-dependent changes in globally averaged near-surface temperature due to eliminating anthro-pogenic emissions of each of CO2,CH4,as well as BC and OC from fossil fuel and biofuel sources.Considering that BC and OC were co-emitted species from anthropogenic and biomass burning sources,Jacobson (2004)suggested that the control of BC+OC may be the most effective method of slowing global warming for a specific period(about 10 yr),although OC itself has a cooling effect.The assessment report of United Nations Environment Programme(UNEP,2011)proposed two approaches to mitigate global warming: one is to control the peak temperature by reducing the concentrations of short-lived species,such as BC, CH4,and tropospheric O3;the other is to control the long-term climate warming by reducing CO2concentrations.UNEP(2011)demonstrated by simulations of climate models that reductions in BC and tropospheric O3can be an effective method to slow the rate of climate change within the first half of this century. Climate benefits from reduced O3are achieved by reducing emissions of some of its precursors,especially methane that is also a powerful greenhouse gas.
With the rapid economic development,concentrations of short-lived species are relatively high in China;hence quantifying the role ofshort-lived species in regional and global climate change is especially important.Despite the complex interactions among WMGHGs and short-lived gases,this review is focused on BC and tropospheric O3due to their warming effects(Fig.1).Ground and satellite measurements of concentrations or optical properties of BC and tropospheric O3over China,as well as the model estimates of radiative forcing by these two species are summarized.We also review regional and global modeling studies which have investigated climate change driven by BC and tropospheric O3in China.Based on the review of previous studies,the key priorities for future research on climatic effects of BC and tropospheric O3are highlighted.This review is mainly focused on the studies of BC and tropospheric O3by Chinese scientists over the past several years,and the climatic impacts are confined to the impacts of BC and O3in the atmosphere within the Chinese territory.Note that China’s climate may be affected by BC and O3outside China due to complex feedbacks in the climate system.
2.Black carbon and its climatic effects
2.1 Emissions
BC(alternatively referred to as elementary carbon and soot)is released into the atmosphere during the incomplete combustion of fossil fuel,biofuel,and biomass.Emissions of BC in China are large due to its large population,substantialfuelconsumption,and often-inefficient combustion conditions,which were reported to be responsible for about 19%of the global BC emission(Qin and Xie,2012).
Figure 2 shows the spatial distributions of BC emissions.BC emissions were much higher in eastern China than in western China.Western China is typically low in emissions,due to the relatively underdeveloped economy and the small consumption of fossil fuels.Western regions,including Tibet,Xinjiang, Qinghai,Gansu,and Ningxia,cover 42.4%of territory,made up only 3.8%,4.0%,4.7%and 5.7%of national BC emissions in 1985,1995,2005,and 2009(Qin and Xie,2012),respectively.Table 1 summarizes BC emissions in China from different studies.The annual totalemission of BC in China after 2006 exceeded 1.79 Tg yr?1(Zhang Q.et al.,2009;Qin and Xie,2012; Wang et al.,2012).According to Lu et al.(2011),thepercentage contributions from sectors of power,industry,residential,transport,and biomass burning to the total BC emission in China were 1.1%,27.1%,50.6%, 15.3%,and 5.9%,respectively,in 2010(Table 1).
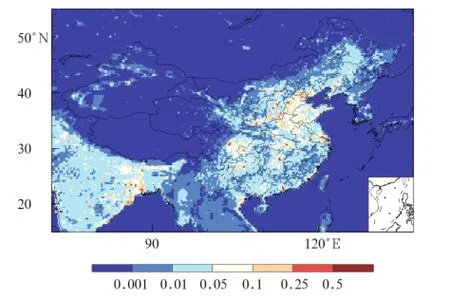
Fig.2.Spatial distributions of BC emissions(Gg C grid?1)at a resolution of 0.1°×0.1°in 2010.The emissions were compiled by the Emissions Database for Global Atmospheric Research(EDGAR)team and are downloaded from http://edgar.jrc.ec.europa. eu/htap?v2/index.php?SECURE=123.
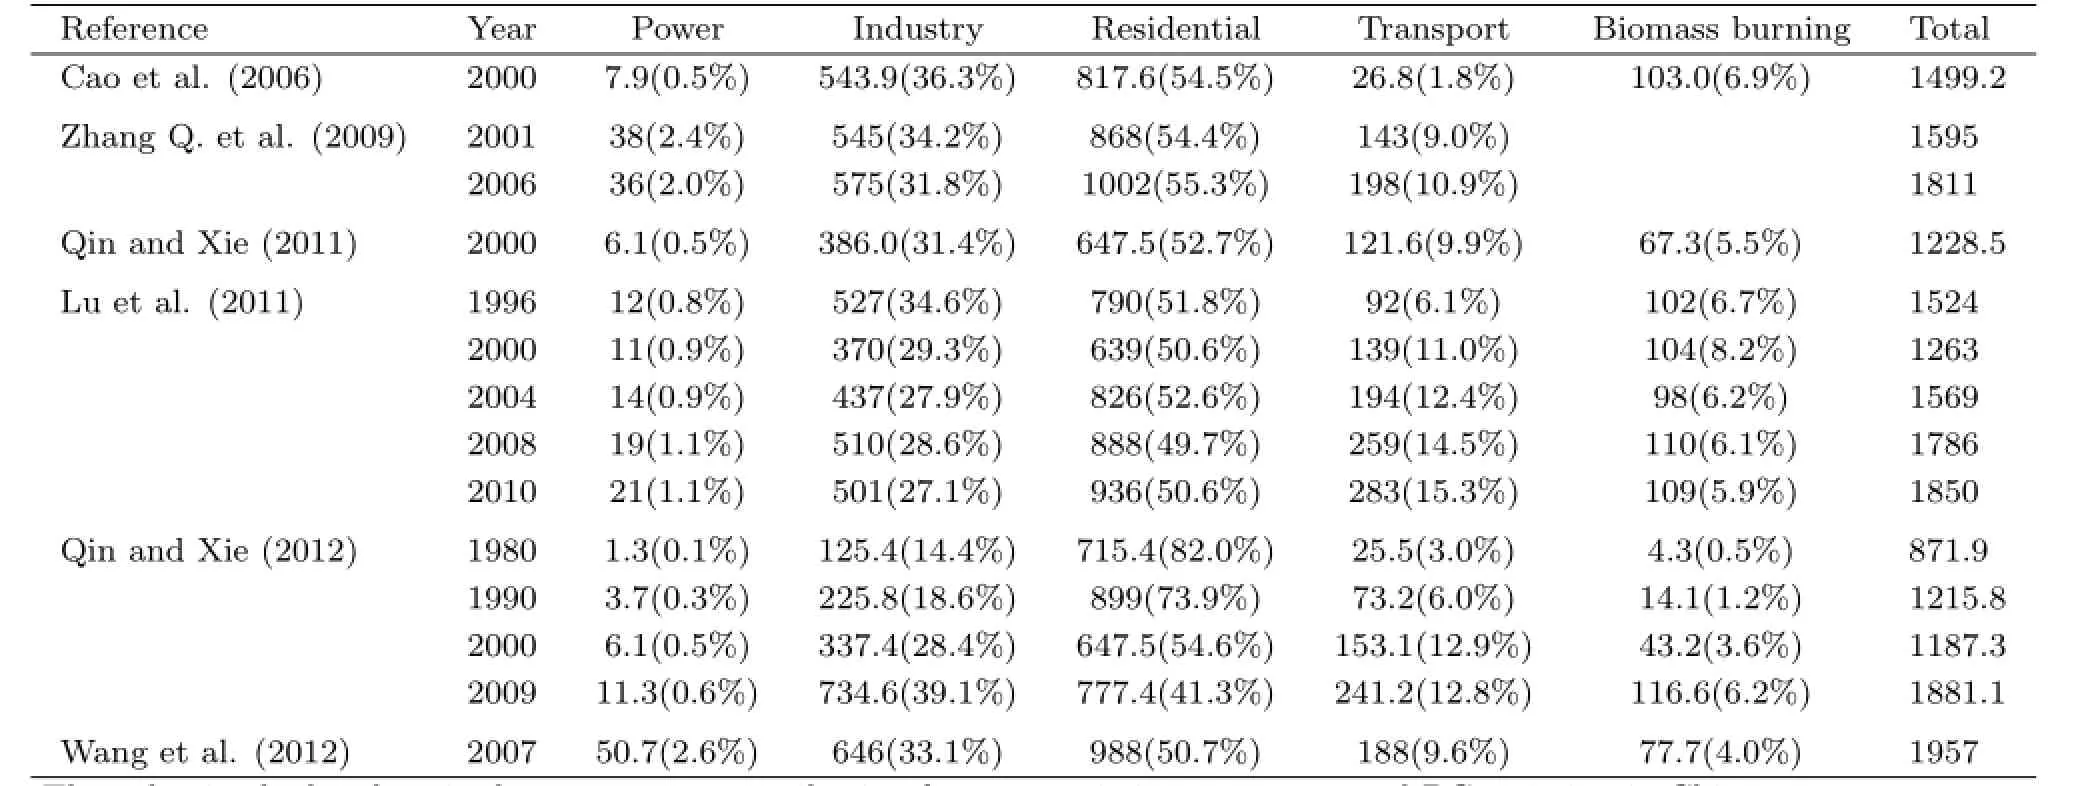
Table 1.Summary of BC emissions from different emission sectors in China(units:Gg yr?1)
2.2 Ground-based measurements of BC concentrations in China
Due to the different instruments used to measure concentrations,BC was also reported as elementary carbon or soot in previous studies.From a measurement stand point,BC mostly refers to aerosol measured with photo-absorption techniques,whereas elementary carbon mostly refers to aerosolmeasured with thermal/optical techniques.The mass concentrations determined with these two techniques can sometimes be significantly different.For the purpose of this review,we consider BC and elementary carbon to be equivalent in our review and refer the readers to Table 2 for the BC measurement methods used in the studies reviewed below.
Since 1999,carbonaceous aerosols have been measured at numerous locations in China at remote sites (Qu et al.,2006),regionally representative rural sites (Zhang et al.,2005;Gao et al.,2008),and urban sitesin large and mega cities(Xu et al.,2002;Cao et al., 2007;Zhang X.et al.,2008;Cao et al.,2009).Figure 3 presents the measured BC concentrations in 2006 at 18 stations in China(Zhang X.et al.,2008).The average annualmean concentration of BC was 0.35±0.01 μg m?3at the remote background sites of Shangri-la, Zhuzhang,and Akdala,3.6±0.93μg m?3at the regionalsites of Taiyangshan,Longfengshan,Dunhuang, Lin’an,Jinsha,Lhasa,Nanning,Dalian,Gaolanshan, Shangdianzi,and Zhenbeitai,and 11.2±2.0μg m?3at the urban sites of Panyu,Zhengzhou,Chengdu, Gucheng,and Xi’an.The highest annual mean BC concentration of 14.2μg m?3was found at Xi’an in 2006(Zhang X.et al.,2008).Similar magnitudes of measured BC concentrations were also reported in the study of Cao et al.(2007).
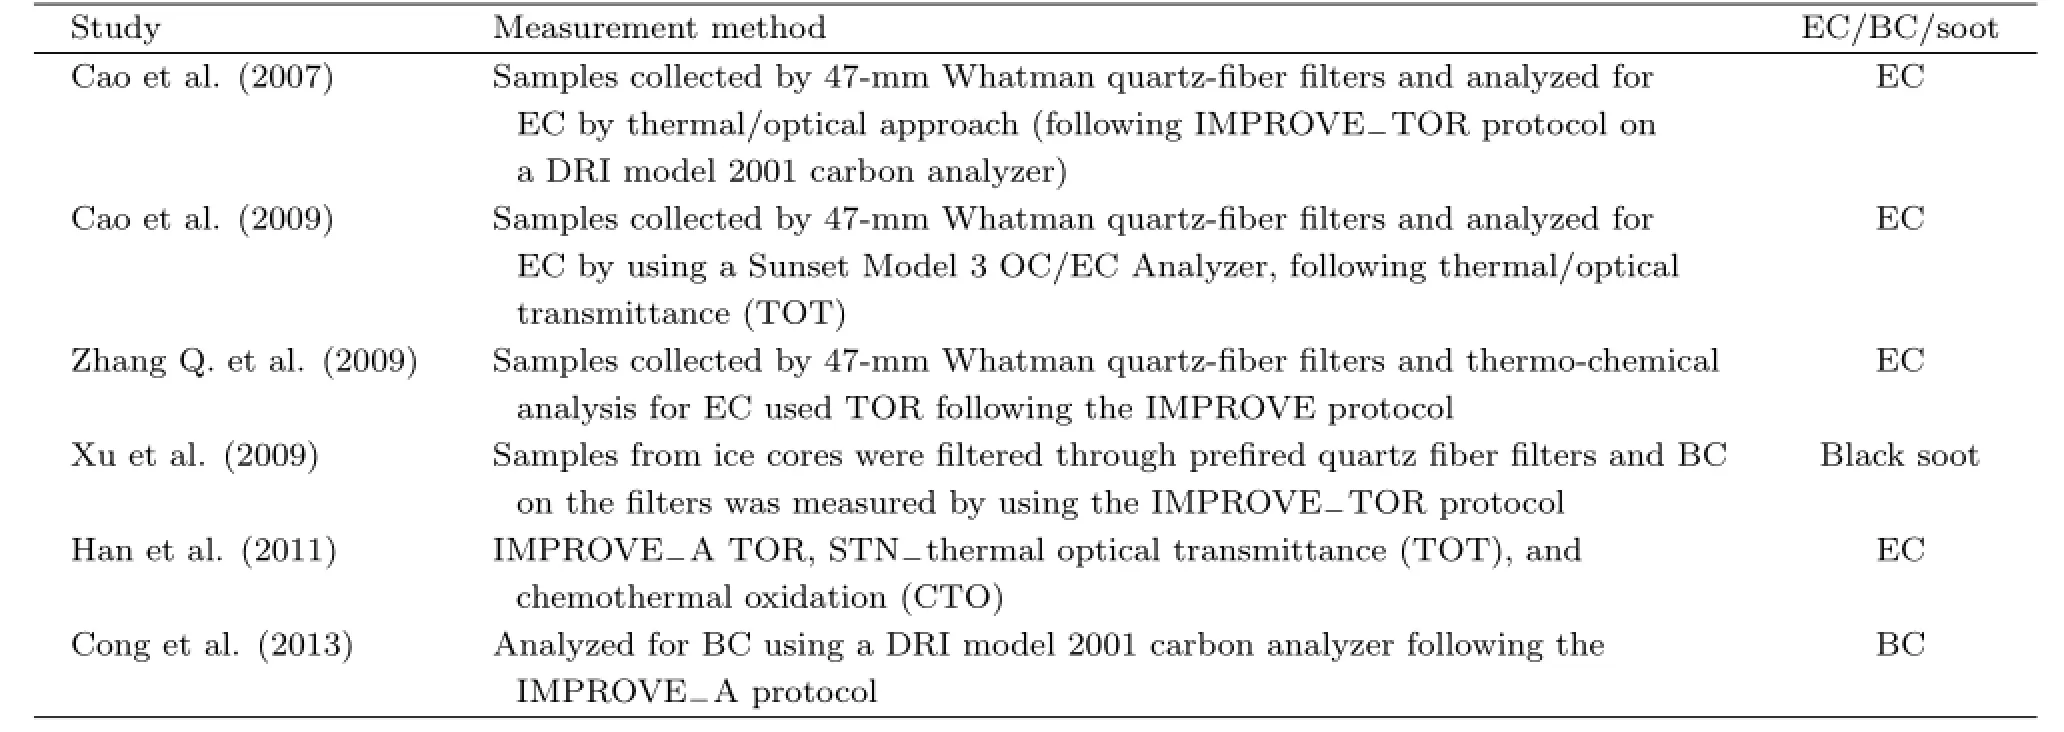
Table 2.Summary of BC measurement methods used in the referred studies
Measured concentrations of BC in China showed strong seasonal variations,with maximum concentrations in winter and minimum values in summer(Cao et al.,2007,2009;Zhang X.et al.,2008).Cao et al. (2007)showed that the observed BC concentrations averaged over the 14 cities in China were 9.9μg m?3in winter(6-20 January)and 3.6μg m?3in summer (3 June-30 July)of 2003.Such seasonal variations can be explained by the largest coal combustion in winter and the largest precipitation associated with the East Asian summer monsoon that washes out BC in summer.
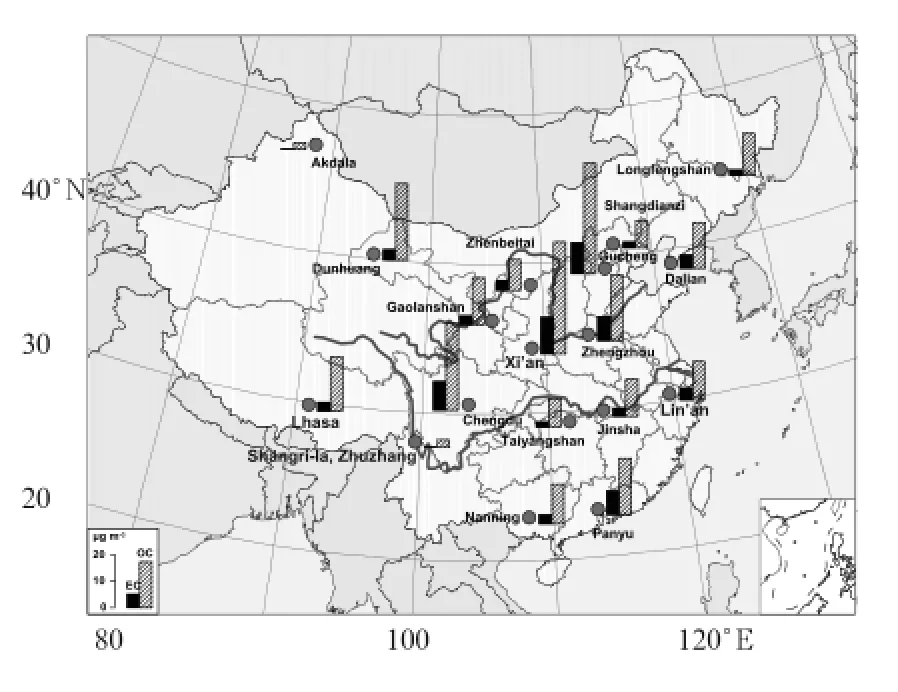
Fig.3.Locations and annual averaged concentrations of observed BC in 2006.The concentrations at Shangdianzi, Zhenbeitai,Akdala,Shangri-la,and Zhuzhang were from 2004 to 2005.(Source:Fig.1 of Zhang X.et al.(2008))
Historical changes in BC are important for understanding the historical changes in climate.Changes in deposition of BC in China were reconstructed by using ice core records(Xu et al.,2009;Cong et al., 2013)or lake sediments(Han et al.,2011).Xu et al.(2009)extracted ice cores from five sites in the Tibetan Plateau and found that the average BC concentrations in ice cores increased from 4.57 ng g?1in 1956 to 12.5 ng g?1in 2006.Han et al.(2011)used a 150-yr(1850-2000)sediment record of Lake Chaohu in Anhui Province and showed that BC concentrations in the sediment exhibited stable low values(below 150000 ng g?1)prior to the late 1970s,and a sharp increase to 450000 ng g?1in the last three decades,corresponding well with the rapid industrialization of China.Cong et al.(2013)reported the variation of BC in sediment of Nam Co Lake in the Tibetan Plateau.From the 1850s to the early 1900s,deposition fluxes of BC to Nam Co Lake were generally constant,which can be considered as background levelwithout significant disturbance from human activities.After the 1900s,BC fluxes showed a gradual and continuous increase,indicating that the influence from anthropogenic sources began in the interior of the Tibetan Plateau.From the 1960s to the early 2000s,the increasing trend of BC deposition flux accelerated significantly.Note that BC in ice core or lake sediment is dependent on BC concentrations in the atmosphere as well as wet and dry deposition of atmospheric BC.
As reviewed above,previous measurements of BC were quite limited to BC at the surface.The observations of vertical distribution of BC are needed for the studies of climatic effect of BC,considering that a large fraction of BC particles from biomass burning in South Asia can be transported to the middle troposphere over China in spring of every year(Zhang et al.,2010b).The measurements of size distribution are also essential,because recent observational study indicated that quite a large fraction of BC in China can stay in coarse mode(Wang et al.,2014).Note that the studies of climatic effect of aerosols require long-term measurements,since climate represents multi-year averages of meteorological parameters.
2.3 Optical properties of BC
Aerosol optical depth(AOD)represents light at-tenuation by aerosols,which is an important parameter that determines the climatic effect ofaerosols.Figure 4 shows the annual mean AOD retrieved by Moderate Resolution Imaging Spectrometer(MODIS)that is averaged over 2001-2010.The high AOD values of 0.5-0.9 occurred over a large fraction ofeastern China. The AOD values exceeded 0.5 over the heavily polluted northern China,the Sichuan basin,the Yangtze River Delta,and the Pearl River Delta.Such features of AOD were captured by many modeling studies(e.g., Ma et al.,2007;Cui et al.,2009;Zhang et al.,2010a; Lou et al.,2014).
For BC,its unique strong absorption of solar radiation is represented by aerosol absorption optical depth(AAOD),or the non-scattering fraction of AOD.Figure 5 shows the AErosol RObotic NET-work(AERONET)sunphotometer and Ozone Monitoring Instrument(OMI)satellite retrievals of clearsky AAOD.Measurements from AERONET showed that the AAOD values were in the range of 0.015-0.07, with high values over northern China where concentrations of both BC and mineral dust aerosols were high.On an annual mean basis,AERONET AAOD over Asia(30°-70°N,100°-160°E)was 0.036,which was much higher than the AAOD of 0.007 over North America(20°-55°N,130°-70°W)and of 0.015 over Europe(30°-70°N,15°W-45°E)(Koch et al.,2009). The AAOD values from OMI exhibited high values of exceeding 0.05 over northern China,the Sichuan basin, and the south border of China.Note that both BC and mineral dust aerosols absorb radiation,so AAOD is a useful measure of BC in regions where mineral dust is not a dominant species.
The single scattering albedo(SSA)represents the ratio of aerosol scattering coefficient to extinction coefficient.It is an important opticalparameter that determines whether aerosols have a cooling or a warming effect.Over a specific location,SSA is dependent on the mixing of scattering and absorbing aerosolspecies. Ramanathan et al.(2001)showed that SSA exceeding 0.95 led to a negative aerosol forcing at the top of atmosphere(TOA)and SSA less than 0.85 led to a positive forcing.Bergin et al.(2001)reported that the values of SSA were about 0.81 in polluted northern China.Lee et al.(2007)found that the average of SSA values over China was 0.89±0.04 at 500 nm for 2005.Table 3 summarizes ground-based measurements of SSA in China from the literature.The large differences in SSA can be explained by the differences in shape,size,chemical composition,and hydroscopic growth of aerosol particles.
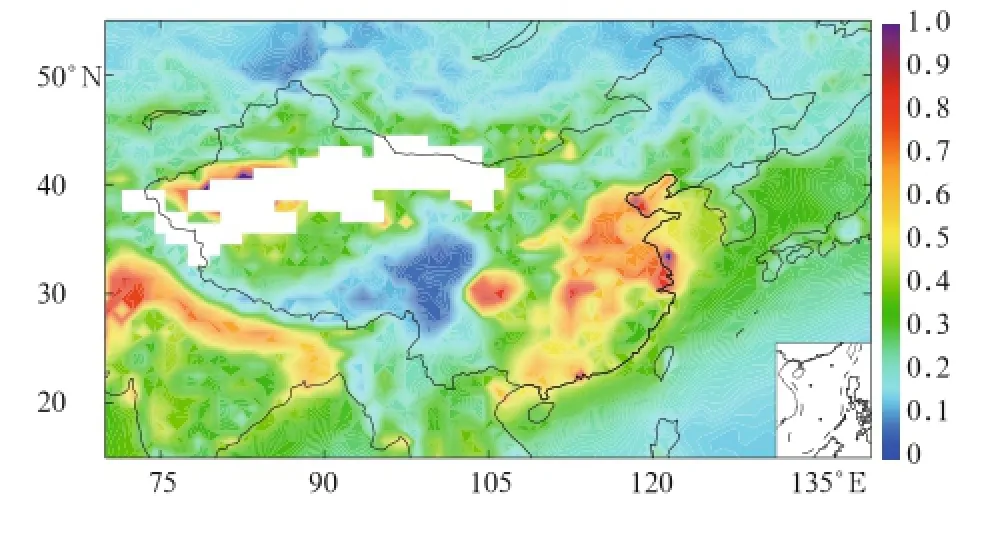
Fig.4.Annualmean AODretrieved by Moderate Resolution Imaging Spectrometer(MODIS)that is averaged over 2001-2010.MODIS datasets are level 3 products downloaded from http://ladsweb.nascom.nasa.gov.
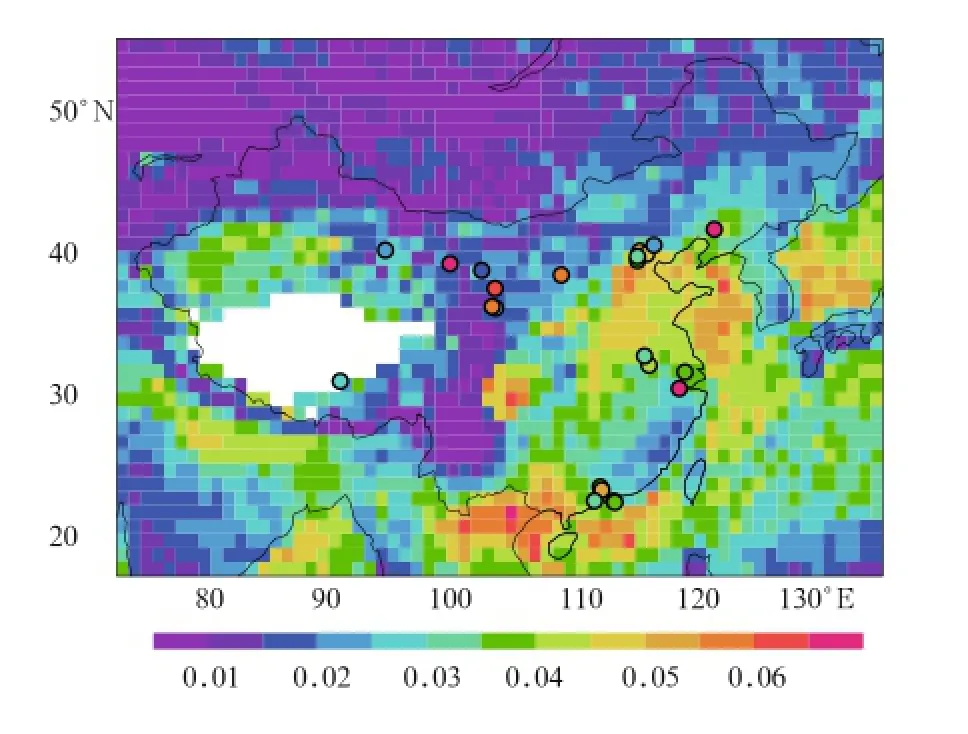
Fig.5.Aerosol absorption optical depth(AAOD, ×100)from AERONET(at 676 nm,color circles)and OMI(at 500 nm,color shades).AERONET measurements were carried out in different years;the AAOD for a specific site is the average over years with measurements available.The OMI datasets downloaded from http://disc.sci.gsfc.nasa.gov/giovanni are averaged over 2005-2007.The AERONET datasets are downloaded from http://aeronet.gsfc.nasa.gov/cgi-bin/climo?menu?v2?new.
Qiu and Yang(2008)showed that measured SSA values were the smallest in winter among all seasons.The increase in BC emission might have led to the decrease in SSA in Beijing during 1993-2001(Qiu et al., 2004).Lyapustin et al.(2011)examined AOD values in Beijing from both the AERONET measurements and the MODIS retrievals,and reported an increasing trend in SSA in Beijing during 2007-2010 relativeto the previous 5 years.Particularly,as dust particles were mixed with anthropogenic aerosols during the transport,SSA values generally showed increases, because the retrieved SSA of dust ranged from 0.92 (at 0.44μm)to 0.97(at 1.02μm)and the SSA of anthropogenic aerosols ranged from 0.89±0.04(at 0.44 μm)to 0.83±0.05(at 1.02μm)(Xia et al.,2005).Cao et al.(2014)also reported that SSA increased during dust events in Beijing in 2005.
Table 3.Summary of ground-based measurements of aerosol single scattering albedo in China.The measurements are taken from Liao and Chang(2014)
2.4 Radiative forcing of BC in China
Table 4 summarizes the estimated radiative forcing(RF)of BC over China,including direct radiative forcing(DRF),first indirect radiative forcing(FIRF), and semi-direct radiative forcing.The DRF reviewed in this work refers to an instantaneous change in net (downward minus upward)radiative flux(shortwave plus longwave,in W m?2)due to an imposed change in concentration of a chemical species(i.e.,BC in this section and O3in Section 3.3).The semi-direct effect of BC is the difference in cloud forcing with and without the impact of BC on SSA of cloud droplet(Zhuang et al.,2010a),and the FIRF of BC is the change in cloud forcing with and without the impacts of BC on effective radius of cloud droplets(Zhuang et al.,2013). The RF of BC is usually defined in terms of change in net radiative flux at the TOA or at the surface.
The DRF of BC is always positive at the TOA and negative at the surface,with the spatial distribution of DRF at the TOA similar to that of DRF at the surface.Chung and Seinfeld(2005),by using a global climate model with online simulation of BC,reported that the present-day maximum TOA all-sky BC DRF over eastern China was about 5-6 W m?2on an annual mean basis.Zhang H.et al.(2008),by using the global aerosol dataset in a radiative transfer model, showed that the TOA clear-sky BC DRF over eastern China reached 3.2 and 4.0 Wm?2in winter and summer,respectively.Wu et al.(2008)simulated by using the Regional Climate Chemistry Modeling System (RegCCMs)found that BC DRF values were stronger in southern China than in northern China during this period;the all-sky BC DRF was 0.64 W m?2at the TOA and-1.69 W m?2at the surface over northern China(32°-50°N,105°-120°E),while it was 1.55 W m?2at the TOA and-3.10 Wm?2at the surface over southern China(22°-30°N,100°-120°E).Zhang H.et al.(2009)and Wang et al.(2009)estimated the DRF of BC by using the global Community Atmosphere Model Version 3(CAM3).Under all-sky conditions, the present-day annual mean BC DRF over eastern China was simulated to be 2.5 Wm?2at the TOA and -3.2 Wm?2at the surface.Zhuang et al.(2010b)estimated that the annual mean BC DRF values at TOA were 1.02 W m?2for clear skies and 0.75 W m?2for all skies over China(25°-45°N,100°-130°E)in 2006. Zhuang et al.(2013)showed that the annualmean BC DRF over China(20°-50°N,100°-130°E)was 0.81 W m?2at the TOA in 2006,and the strongest TOA BC DRF was 6.0 W m?2over the Sichuan basin.Among the BC DRF estimates for China,the values obtained by Zhang et al.(2012)were relatively small;the simulated annualmean TOA BC DRF exhibited maximum value of 1.0 W m?2under all-sky and of 0.8 W m?2under clear-sky conditions.The low bias in simulated BC column burden might have led to the small BC forcing in Zhang et al.(2012).
BC can act as cloud condensation nuclei(CCN) and influence cloud albedo,exerting a negative FIRF at the TOA.Zhuang et al.(2009)reported that the regional average(20°-50°N,90°-120°E)of TOA BC FIRF was-0.39 Wm?2in January and-1.18 Wm?2in July 2003.Zhuang et al.(2013)estimated that the TOA FIRF of BC was-0.95 Wm?2over China(20°-50°N,100°-130°E),which was larger than its DRF, leading to a net RF of BC of-0.15 W m?2at the TOA for 2006.
BC can burn clouds through heating the ambient air around and clouds(semi-direct effect of BC), which reduces cloud cover and allows more shortwave radiative fluxes to reach the surface.Zhuang et al. (2010a)showed that the average semi-direct RF values over eastern China(20°-50°N,100°-130°E)were 0.04,0.10,0.09,and 0.06 W m?2at the TOA in January,April,July,and October 2003,respectively.
As shown in Table 4,the simulated regionalmean DRF values are in the range of0.75-2.5 Wm?2,which are significant as compared to the global mean radia-tive forcing values of BC,tropospheric O3,and CO2. IPCC(2013)reported that between 1750 and 2011, the global and annual mean RF values of BC,tropospheric O3,and CO2were 0.40(0.05-0.80)W m?2, 0.40(0.20-0.60)Wm?2,and 1.82(1.63-2.01)Wm?2, respectively.Recently,Bond et al.(2013)reported the annual mean BC DRF exceeded 5 Wm?2over a large fraction of eastern China,which further underscores the importance of BC in regional warming of climate. However,few studies have examined semi-direct and indirect effect RF of BC;the RF values of semi-direct and indirect effect of BC have large uncertainties andare subject to further studies.
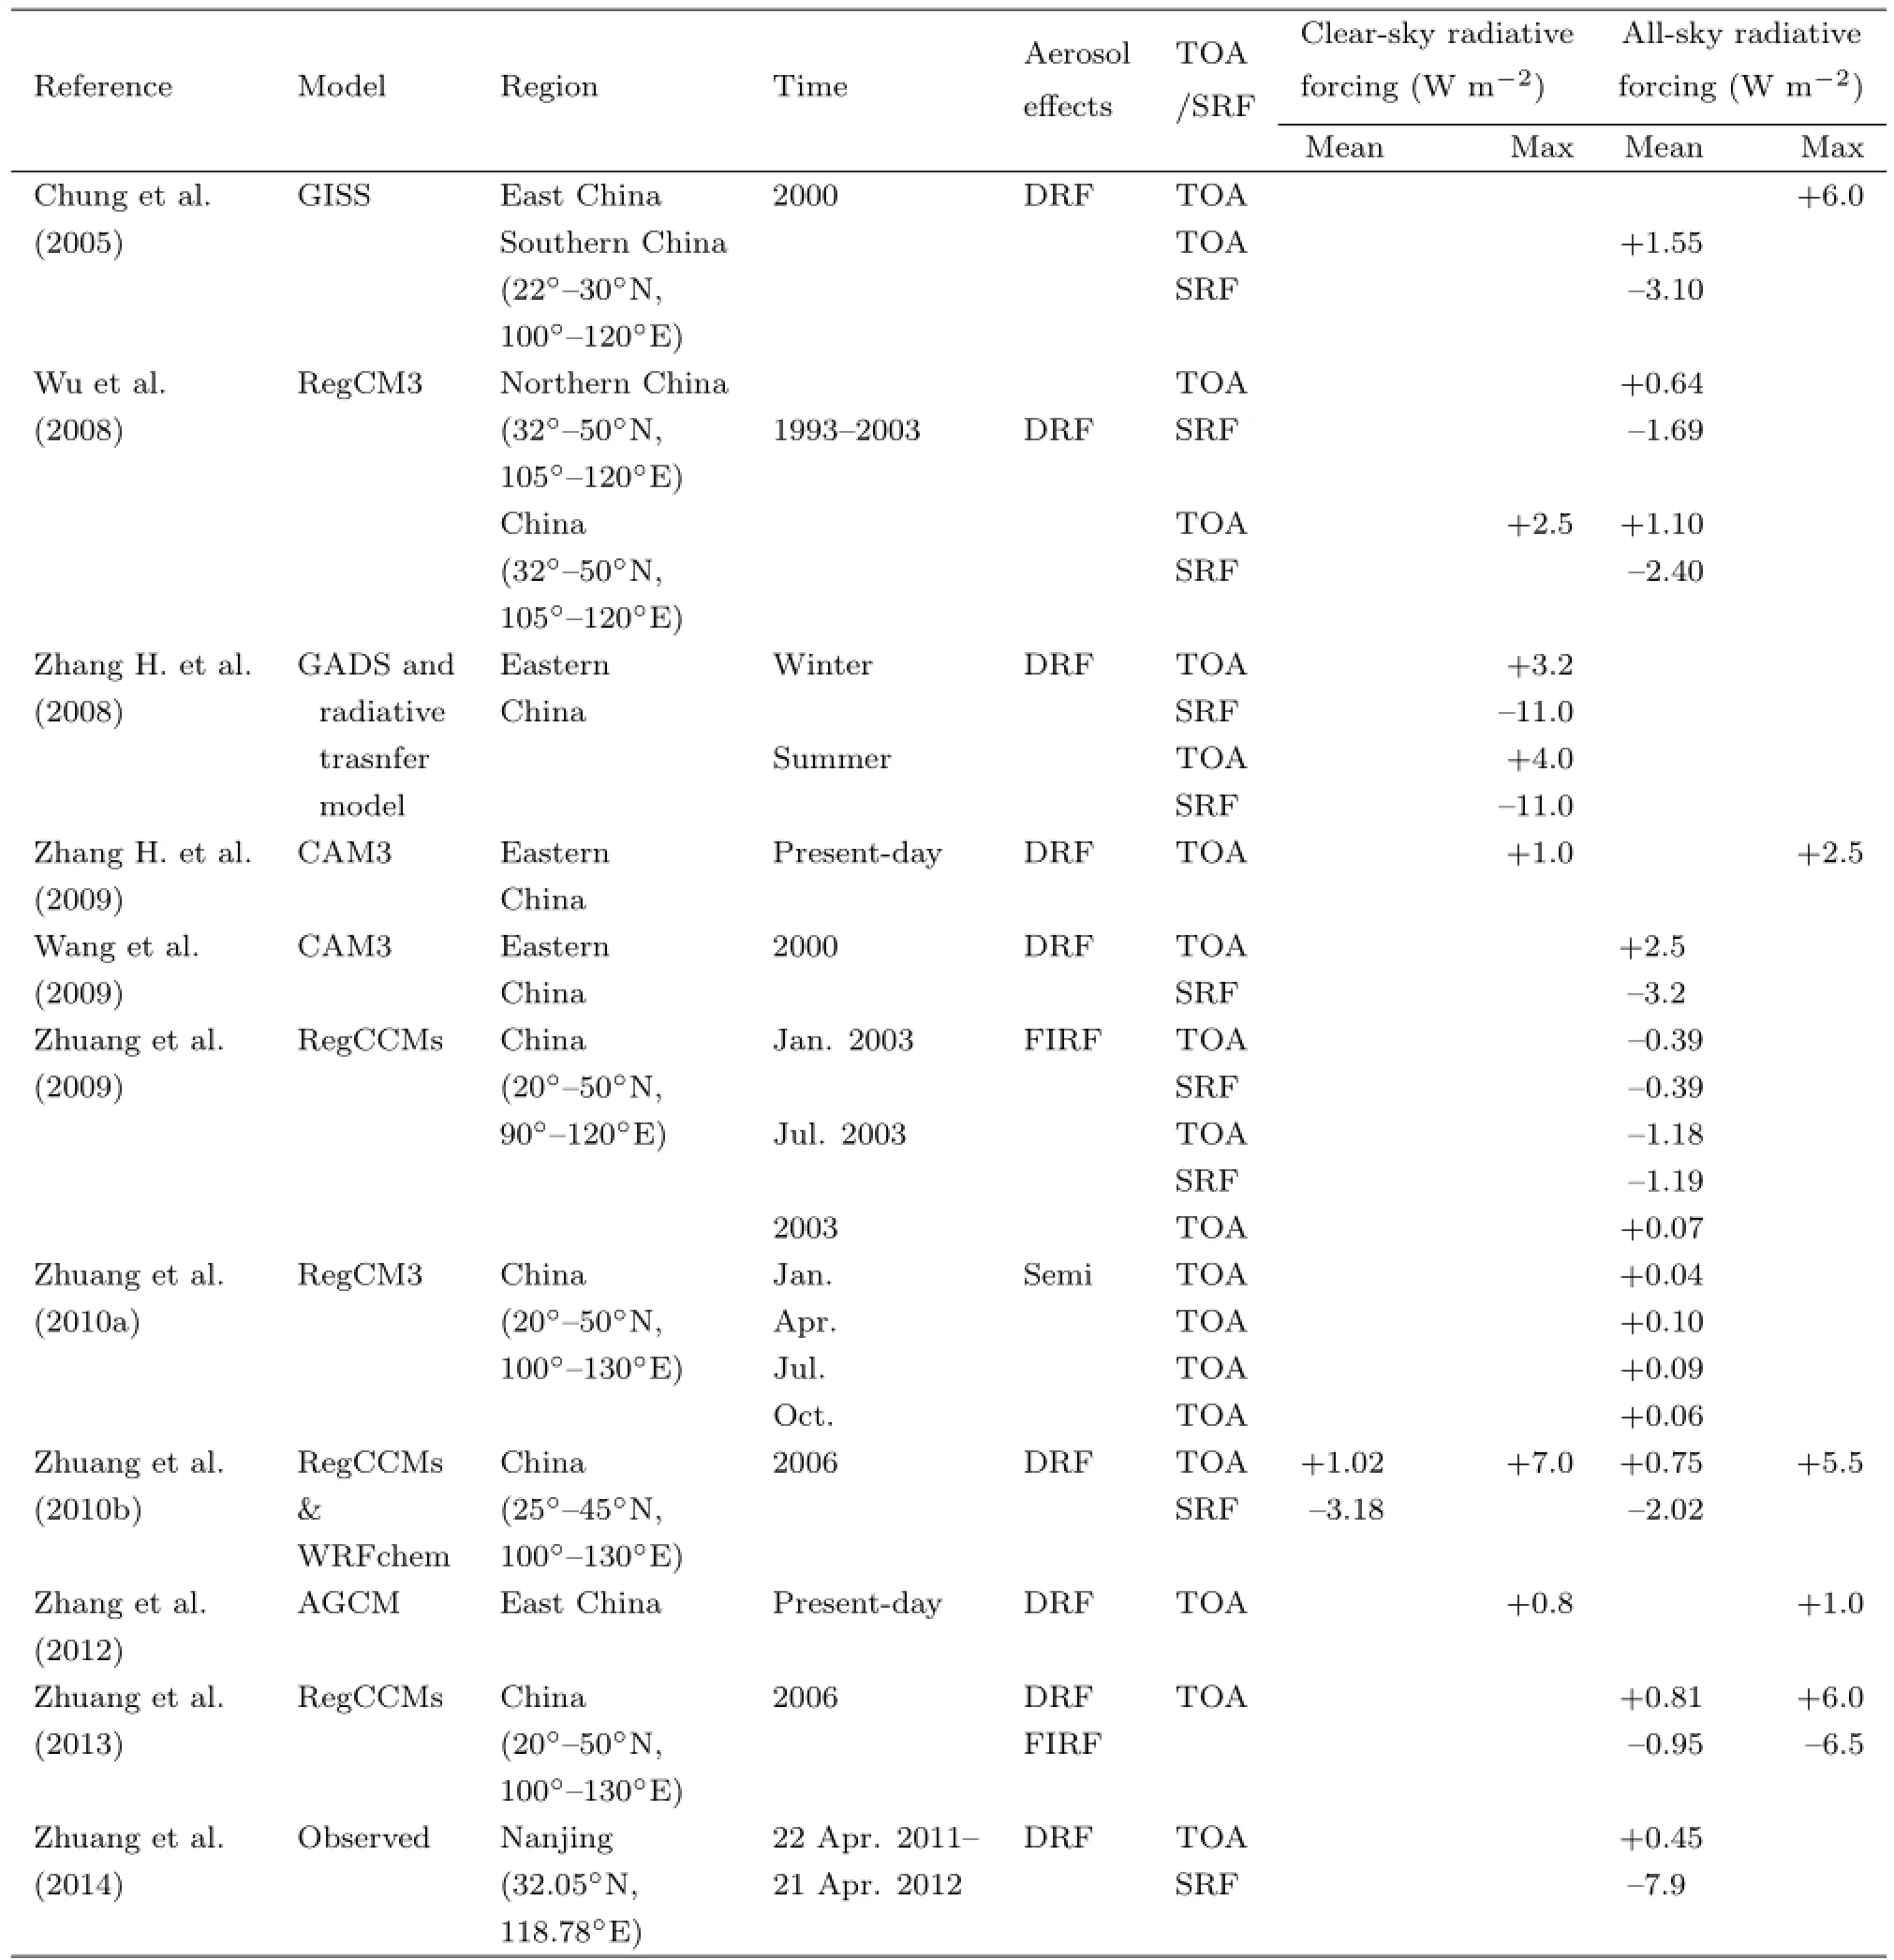
Table 4.Summary of estimates of radiative forcing of BC in China
2.5 Climatic effect of BC
Increases in BC concentrations in the atmosphere were simulated to lead to a warming over China. Chang et al.(2009)found by using a coupled global aerosol-climate model that the direct effect of BC increased the surface air temperature averaged over eastern China(20°-50°N,100°-130°E)by 0.62℃over 1950-2000.Jiang Y.et al.(2013)used the NCAR Community Atmospheric Modelversion5(CAM5)and found that during 1850-2000,the direct and indirect effects of BC led to changes in surface air temperature by-0.6 to 0.3 K over East China(20°-45°N, 105°-122.5°E).Guo et al.(2013)reported by using the United Kingdom High-Resolution Global Environment Model(HiGAm)that BC direct effect changed the monthly and regional mean surface air temperature over East Asia(20°-45°N,100°-122°E)by -0.4 to 0.1 K during April-September.The simulated negative changes in temperature by BC indicated the complex BC-cloud feedbacks.
BC affects the large-scale circulation and hydrological cycle by heating the air and hence altering the regional atmospheric stability.Menon et al.(2002) considered the direct effect of BC in the Goddard Institute for Space Studies(GISS)global climate model and reported that the radiative effect of BC in China and India led to the observed“northern droughts and southern floods”in China over the past several decades.Chang et al.(2009)used a coupled global aerosol-climate model and found that the direct effect of BC increased precipitation over 1950-2000 by 0.07 mm day?1as precipitation was averaged over eastern China(20°-50°N,100°-130°E).Zhuang et al. (2013)showed by using the RegCCMs that the combined effect of BC(semi-direct plus indirect effect) led to regional mean change in precipitation by-0.09 mm day?1(or-7.4%)over eastern China(20°-50°N, 100°-130°E)for 2006.Jiang Y.et al.(2013)considered both direct and indirect effects of BC in the NCAR CAM 5 and reported that BC led to summertime change in precipitation by-0.08 mm day?1from 1850 to 2000 as precipitation was averaged over East China(20°-45°N,105°-122.5°E).
BC also contributes to the retreat of the glaciers over the Himalayas(Ming et al.,2008;Xu et al.,2009; Menon et al.,2010;Kopacz et al.,2011;Wang Z.et al.,2011;Wang X.et al.,2014).As BC is deposited over snow and sea ice,it significantly enhances solar absorption by snow and ice.Ming et al.(2008)estimated radiative forcing by using BC retrieved from a 40-m shallow ice core from the East Rongbuk Glacier in the high Himalayas.They reported a localradiative forcing of as large as 5.0 W m?2by BC deposited in the glacier,suggesting that BC in the atmosphere over the Himalayas and consequently in the glaciers cannot be neglected when assessing the dual warming effects on glacier melting.Menon et al.(2010)simulated by using the NASA GISS climate model(ModelE)with on-line aerosol chemistry that about 0.9%of snow/ice cover decreases over the Himalayas during 1990-2000 was caused by direct effect,indirect effect,and deposition of BC aerosol.Wang Z.et al.(2011)simulated by using the BCC?AGCM that the regional mean radiative forcing due to BC deposited on snow/ice reached 2.8 W m?2over the Tibetan Plateau and led to increases in annual mean temperature by 1.6 K in that region.
Modeling studies reviewed above show large uncertainties,either in simulated radiative forcing or in simulated climate responses,although the regionaland global climate models start to have the capabilities to simulate BC-radiation and BC-cloud interactions. The uncertainties arise in part from emissions inventories,representation of concentrations,verticalprofiles, mixing states,and optical properties of BC.The representation of the aging of BC and the role of BC as cloud condensation nuclei remains to be the most difficult challenges in simulation of climatic effect of BC (IPCC,2013).Nationwide long-term measurements of aerosol concentrations,aerosol optical properties,and cloud properties in China are called for to constrain model simulations.
3.Ozone and its climatic effects
3.1 Emission of O3precursors
The most important O3precursors in the atmosphere include NOx,CO,and volatile organic compounds(VOCs).Motor vehicle exhaust,industrialemissions,and chemical solvents are the major anthropogenic sources of these chemicals.As an example,Table 5 summarizes the annual emissions of NOx, CO,and NMVOCs in eastern China(20°-50°N,110°-126°E),which are based on David Streets’2006 emission inventory(http://mic.greenresource.cn/intex-b 2006)(Zhang Q.et al.,2009).Note that tropospheric O3has a lifetime of about 3 weeks(Liao and Seinfeld, 2005;Stevenson et al.,2006)and therefore a large fraction of O3in China can be attributed to background O3and anthropogenic emissions from foreign countries (Wang Y.et al.,2011).
3.2 Simulated and observed concentrations of tropospheric O3
Figure 6 shows the distributions of seasonal mean surface-layer concentrations of O3simulated for 2006 in the study of Lou et al.(2014)by using a global chemical transport model.Simulated concentrations of O3in eastern China are the lowest in DJF becauseof the weak photochemistry as a result of weak solar radiation in this season.Concentrations of O3in eastern China in MAM and SON are in the ranges of 40-55 and 35-50 ppbv,respectively.The maximum O3concentrations over eastern China are simulated to be 60-75 ppbv in JJA.Note that the high O3concentrations of exceeding 70 ppbv over the Tibetan Plateau in MAM result from the transport of O3from the stratosphere to troposphere(Wild and Akimoto,2001).
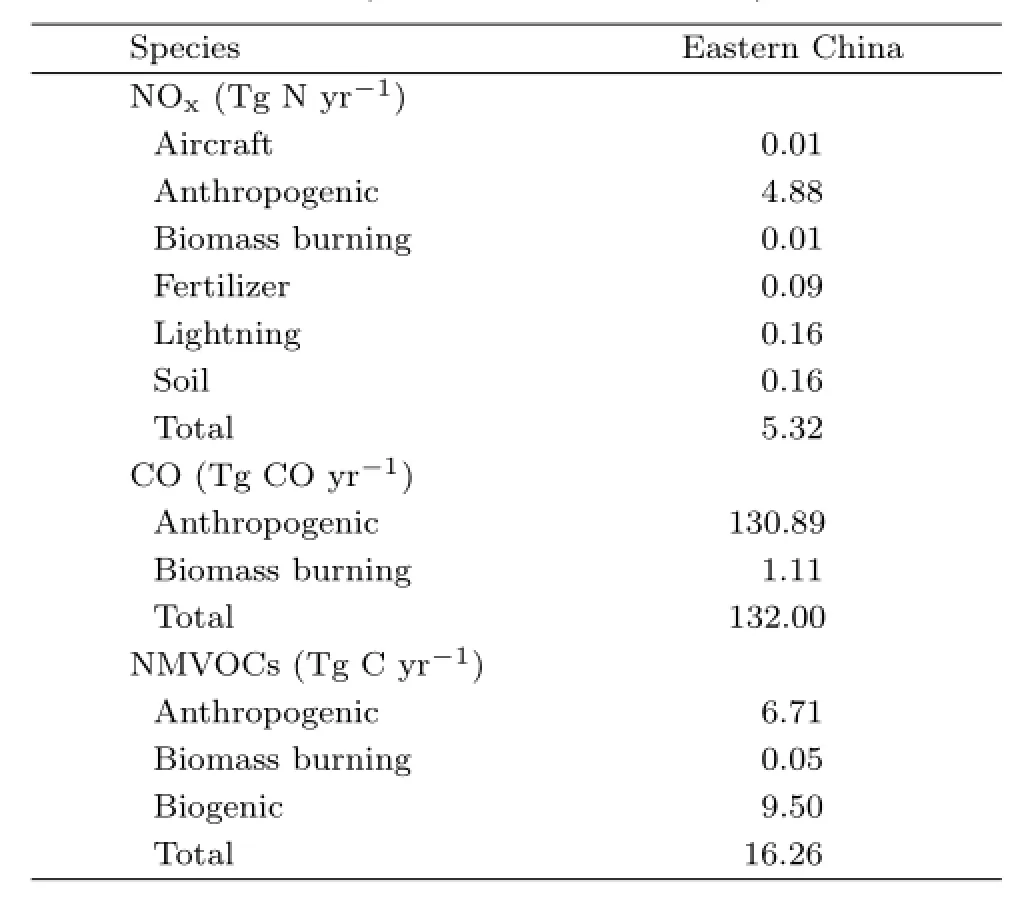
Table 5.Annual emissions of ozone precursors in eastern China(20°-50°N,110°-126°E)
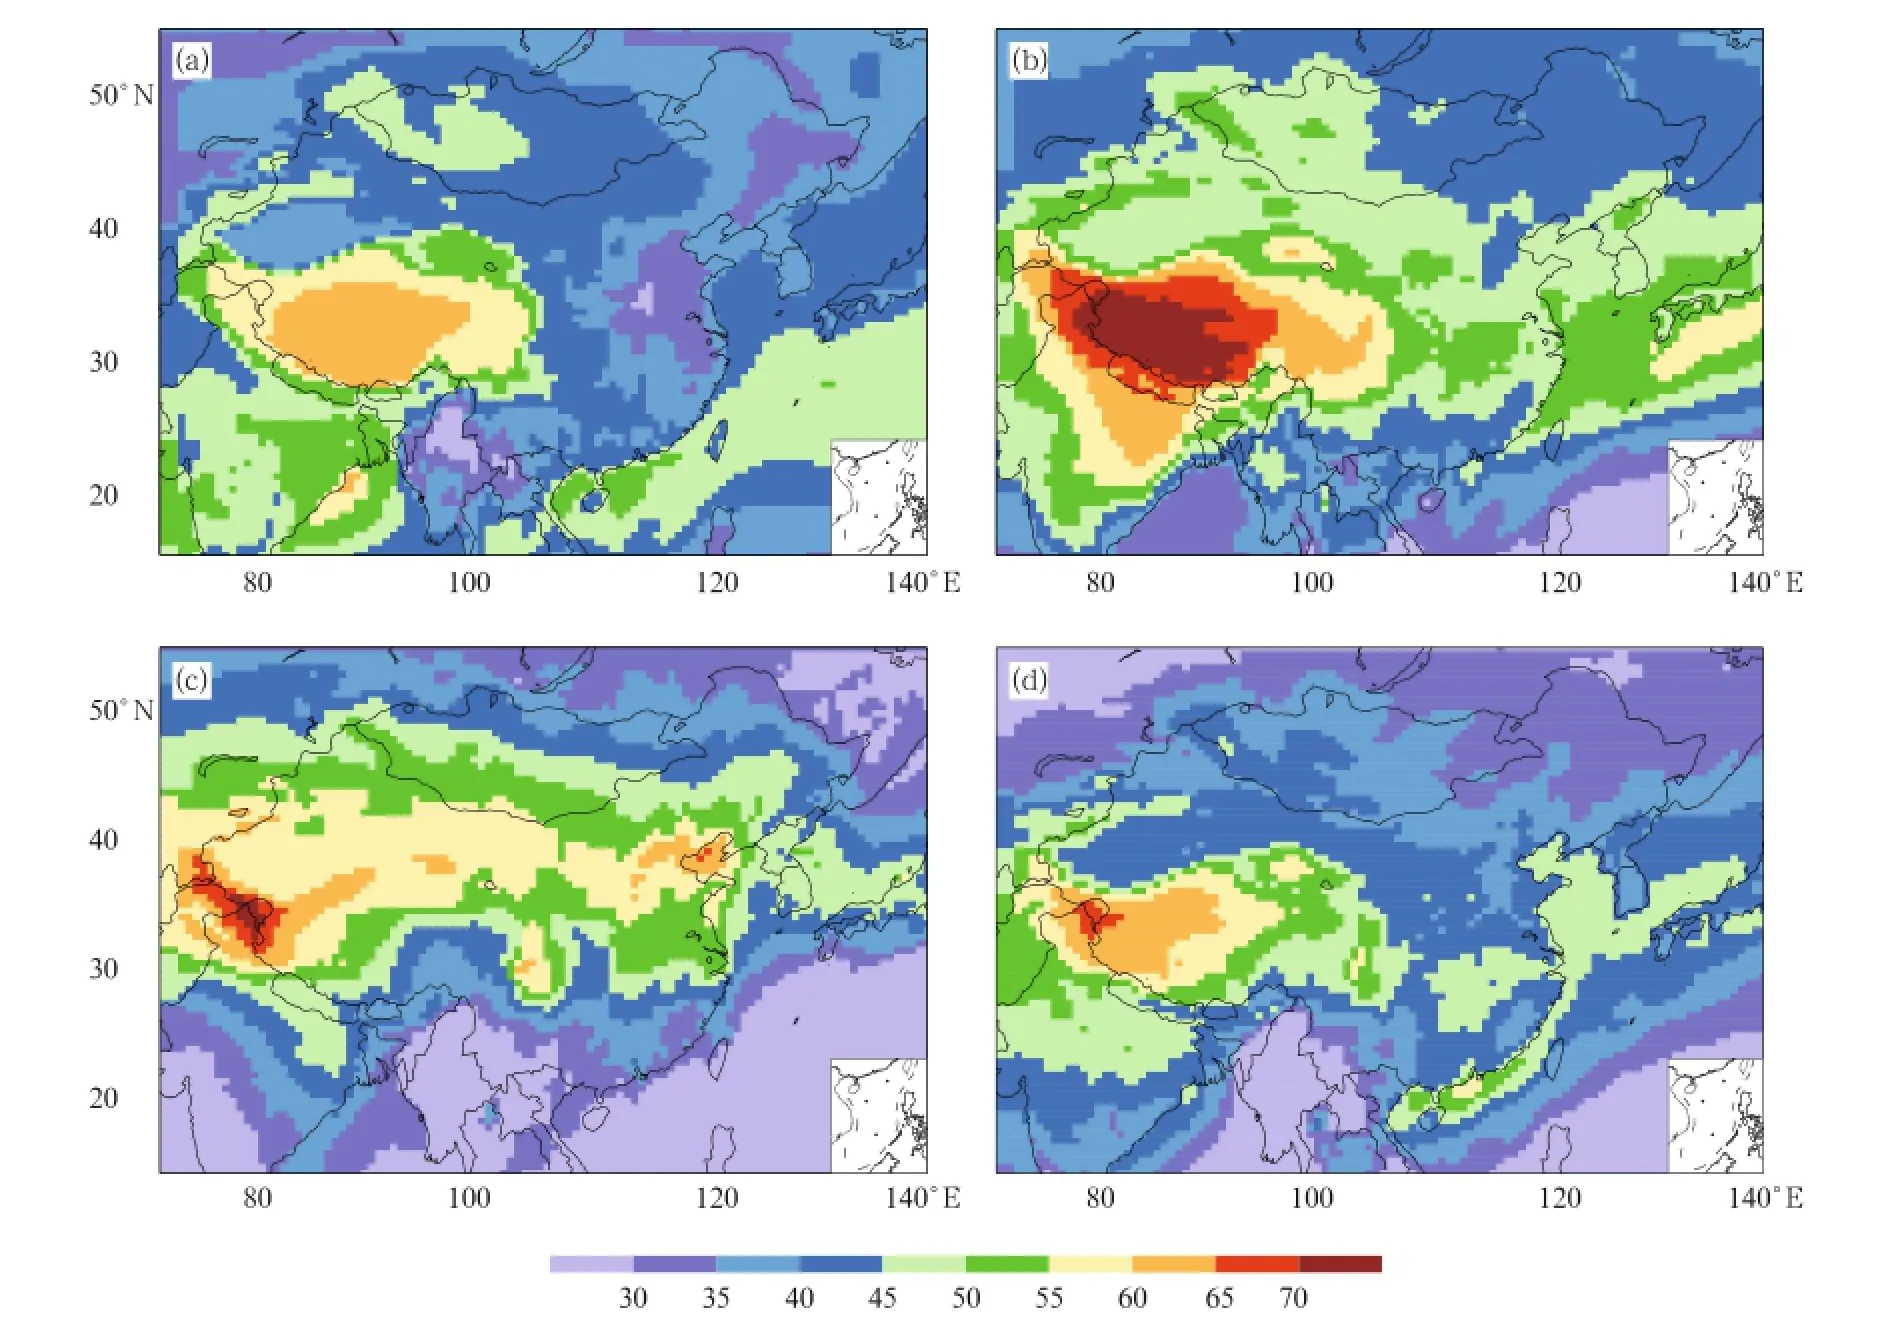
Fig.6.Simulated seasonal mean surface-layer concentrations(ppbv)of O3for 2006.(a)DJF(December-January-February),(b)MAM(March-April-May),(c)JJA(June-July-August),and(d)SON(September-October-November), respectively.(Remade from Fig.2 of Lou et al.(2014))
Table 6 compiles the ground-based measurements of O3in China from the literature.During July-September of 2001-2006,the average measured O3concentrations at 6 urban sites in Beijing was 26.6±2.8 ppbv(Tang et al.,2009).At remote sites(Fenghuanshan(40.5°N,124°E),Waliguan in the Qinghai-Tibetan Plateau(36.3°N,100.9°E), Lin’an(31.3°N,120.4°E),and Longfengshan Mountain(44.7°N,127.6°E)),O3concentrations were generally in the range of 20-60 ppbv(Yan et al.,1997, 2003;Wang et al.,2004;Takami et al.,2006;Wang et al.,2006).The background O3concentrations are relatively higher in western China as a result of the transport of O3from the stratosphere.For example, concentrations at Waliguan(36.3°N,100.9°E)were in the range of 40-60 ppbv,which were higher than the measured values at other background stations.With respect to the long-term trend of O3,surface concentrations measured in Lin’an,a background station in eastern China,showed that the monthly highest 5% O3concentrations increased over 1991-2006(Xu et al., 2008).
Estimating of the climatic effect of tropospheric O3requires knowledge of not only surface concentrations but also vertical distributions and column burdens.Ozonesonde datasets were available at only a number of sites in China.Based on 810 vertical profiles of O3measured by aircraft in different seasons of 1995-2005,Ding et al.(2008)showed that the average mixing ratio of O3in Beijing increased from about 40 ppbv at the ground to about 50 ppbv at 2-km altitude.Satellite measurements are useful for analyses of the distributions and seasonal variations of tropospheric column O3concentration over China because of the excellent spatial and temporal coverage.Liu et al.(2006)presented the first directly retrieved global distribution of tropospheric column O3from Global Ozone Monitoring Experiment(GOME)ultraviolet measurements from December 1996 to November 1997. The retrieved columns clearly showed changes owing to convection,biomass burning,stratospheric influence,pollution,and transport.By using measurements from the Infrared Atmospheric Sounding Interferometer(IASI)instrument aboard the European Metop-A satellite(launched in October 2006),Dufour et al.(2010)showed that the maximum O3occurs in late spring and early summer(May-June)in Beijing.Wang Y.et al.(2011)examined the month to month variation ofmean tropospheric O3column from Tropospheric Emission Spectrometer(TES)for eastern(east of 110°E)and western(west of110°E)China. TES retrievals suggest that column burden of tropospheric ozone over both eastern and western China has a maximum in late spring/early summer and minimum in winter.Although biogenic emissions,temperature,and radiation are the highest in southeastern and southwestern China in July,O3concentrations in those regions are generally low in summer because of the summer monsoon circulation that brings clean air from the oceans.Zhang et al.(2014)reported that the retrieved tropospheric O3column concentration from OMI averaged over China and from 2010-2013 was 34.0 DU.
3.3 Radiative forcing of tropospheric O3
Tropospheric O3exerts radiative forcing at both longwave and shortwave spectral bands.Few studies have examined the RF by tropospheric O3over China. By using a coupled regional chemistry-climate model (RegCM2),Wang et al.(2005)showed that tropospheric O3had a shortwave forcing of 0.19 Wm?2and a longwave forcing of 0.46 W m?2at the tropopause. They reported that the normalized net radiative forcing over China was 0.02 W m?2DU?1,lower than the global mean values of 0.03-0.05 W m?2DU?1reported in the literature.By using the IPCC AR5 emissions inventories,Chang et al.(2009)reported that the anthropogenic radiative forcing by tropospheric O3averaged over eastern China(18°-45°N,95°-125°E)was 0.53 W m?2at the tropopause.
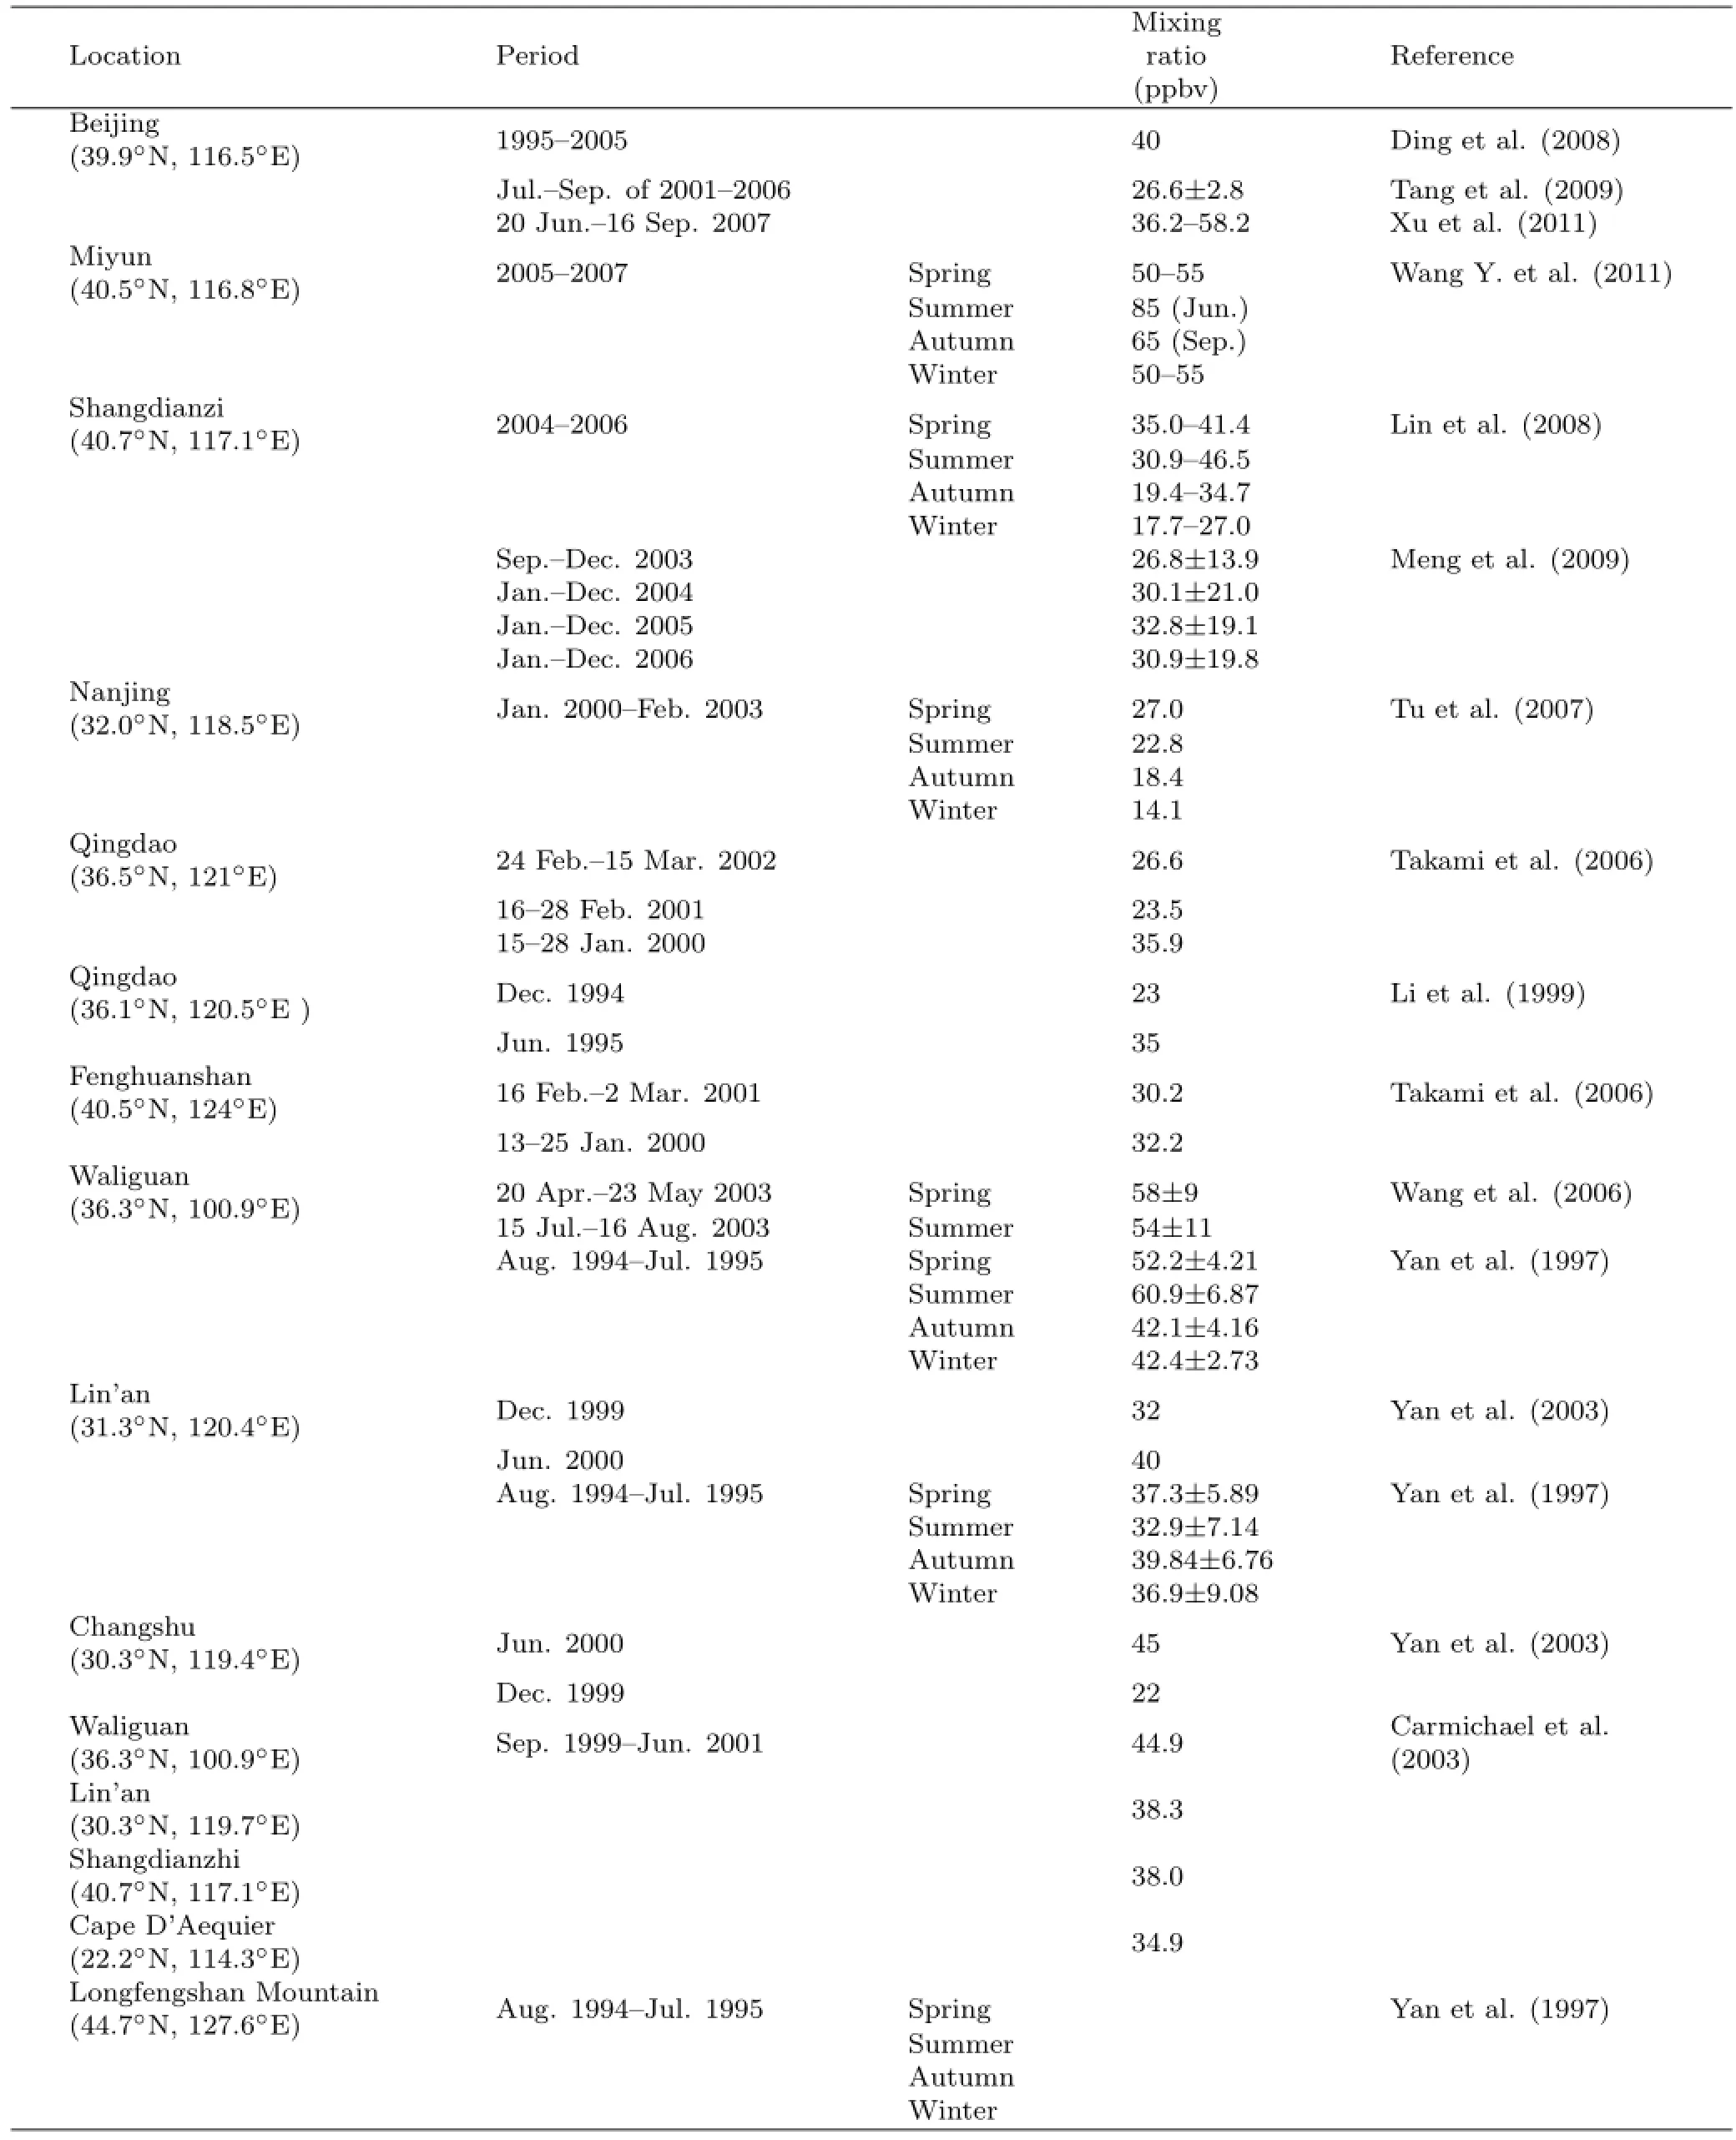
Table 6.Summary of ground measurements of ozone in China
3.4 Simulated climatic effect of tropospheric O3
Several studies examined climate responses to RF of tropospheric O3in China.Wang et al.(2004)used a coupled regional chemistry-climate model based on RegCM2 to simulate the concentrations and climatic effect of tropospheric O3in China.They reported that the monthly mean column burden of O3was about 30 DU and led to changes in surface air temperature by-0.8 to 0.8 K over eastern China.The negative changes in temperature were mainly associated with the feedback of clouds.Based on the transient climate simulations of the GISS ModelE,Hansen et al. (2007)predicted that the increases in surface air temperature by tropospheric O3were up to 0.5 K over eastern China from 1900 to 2003.On the basis of a globalcoupled chemistry-climate simulation,Chang et al.(2009)reported that the warming by tropospheric O3was 0.43 K in eastern China over 1950-2000.
The large changes in simulated surface air temperature reviewed above underscore the importance of considering O3in policies for mitigating global warming.It should be noted that many previous studies on regional climate changes in China did not account for the role of tropospheric O3,which would lead to low biases in simulated warming in China.
4.Mitigation of climate warming by reductions in black carbon and O3in China
Due to the warming effect of BC and tropospheric O3as reviewed above,reductions in short-lived BC and tropospheric O3have been proposed as a complementary strategy to reductions in greenhouse gases. Recent studies started to identify approaches to mitigate both air pollution and global warming by reducing concentrations of short-lived species such as tropospheric O3and BC(UNEP,2011;Shindell et al.,2012; Bond et al.,2013;Liao and Chang,2014;Zhang et al., 2014).BC and OC are always co-emitted,but in different proportions from different emission sources.BC is also co-emitted with other scattering aerosols such as sulfate from fossil fuel burning.As a result,the effect of BC mitigation depends on how BC and coemitted aerosol species affect cloud properties(cloud albedo,cloud amount,and cloud lifetime)and hence cloud radiative forcing.If such a perturbation were to result in a reduction in TOA cloud cooling,the amount of BC reduction would oppose the amount by which the TOA direct BC heating is also reduced.For example,Chen et al.(2010)considered two presentday mitigation scenarios:50%reduction of primary BC/OC mass and number emissions from fossil fuel combustion(referred to as HF),and 50%reduction of primary BC/OC mass and number emissions from all primary carbonaceous sources(fossilfuel,domestic biofuel,and biomass burning)(referred to as HC).The global mean TOA changes in radiative forcing for the two scenarios,relative to present day,were calculated to be 0.13±0.33 W m?2(HF)and 0.31±0.33 W m?2(HC),indicating the large uncertainty in the net effect of some BC control measures on global warming.
Few studies have examined the effect ofreductions in O3on global warming.As a short-lived species with lifetime of about 3 weeks(Liao and Seinfeld, 2005;Stevenson et al.,2006),a large fraction of O3in China can be attributed to background O3and anthropogenic emissions from foreign countries.Wang Y.et al.(2011)used the global chemical transport model GEOS-Chem to identify contributions of emissions from various source types(natural and anthropogenic)and regions(domestic and foreign)to the spatial distribution and seasonality of tropospheric O3in China.Assuming that total O3is the sum of total background O3(TBO;simulated with global natural emissions as well as anthropogenic emissions outside China)and China pollution O3(CPO;O3formation from anthropogenic emissions in China),the annual mean TBO over China was calculated to be 44.1 ppbv, with maximum value of 50.7 ppbv in MAM and minimum value of 40.9 ppbv in JJA,accounting for 93% and 81%of total surface O3in these seasons,respectively.Annual mean CPO was calculated to be 5.4 ppbv,ranging from 1.4 ppbv in DJF to 9.9 ppbv in JJA.Average over China,CPO contributed about 20% of total O3in JJA.These model results indicate that domestic reductions in O3through controlling O3pre-cursors(such as NOx,CO,and NMVOCs)may not be helpful for regional climate;it is important to establish emission control collaboration to achieve mutual benefits among different countries/regions.
Noted that while BC and O3affect the regional climate,climate change can affect their distributions and concentrations by altering naturalemissions, chemical reactions,transport,and deposition(Liao et al.,2006;Jiang H.et al.,2013;Qu et al.,2013;Wang et al.,2013).Such chemistry-aerosol-climate feedbacks need to be accounted for in policies for future emission reductions.
5.Science needs for reductions of short-lived greenhouse species
As presented in sections above,important advances have been made during the past decade in understanding concentrations and distributions of BC and tropospheric O3and their roles in climate change in China.Emissions inventories of tropospheric O3and aerosol precursors as well as aerosols have become available for China domain,which allow one to simulate concentrations of BC and tropospheric O3and estimate their climatic effects by using numerical models.Increasing availability of ground-based measurements and satellite measurements of short-lived species and their optical properties as well as cloud properties has provided datasets to constrain the simulated climatic effects ofaerosols and tropospheric O3. However,estimates of the net effect of BC and O3control measures on global warming are still subject to large uncertainties.The fundamental science needs pertaining to reductions in short-lived species to mitigate global warming are summarized in Fig.7 and described below.
(1)Quantification of emissions of BC and O3precursors from different sectors in China,which are required for making plans of control measures.It is also important to quantify allthe chemicalspecies that are co-emitted with BC or O3precursors can influence concentrations of both long-lived greenhouse gases and short-lived species.Such information will be helpful for estimating the net radiative forcing of a specific BC or O3control measure.
Fig.7.Fundamental science needs pertaining to reductions in short-lived species to mitigate global warming.
(2)Nationwide long-term measurements of size-resolved mass concentrations of BC and other aerosol species as well as number concentrations of aerosols. Since previous measurements(measurements at urban sites for short time periods)were mostly designed for air quality studies,nationwide long-term measurements are especially important for climate studies and need coordinated funding support.With fairly good funding support,satellite measurements have excellent spatial and temporal coverage,which are also useful for analyses of the physical/chemical/optical characteristics of O3and aerosols.These measurements are necessary for evaluation of emission inventories,development of chemistry-aerosol-climate models,and the assessment ofthe effect ofemission reduction measures (Wang et al.,2012;Xu et al.,2013).Better understanding of BC and tropospheric O3also requires satellite measurements of fires.One of the largest uncertainties with the fire observations is in estimating the actual amount of BC and O3precursors such as NOxthat are emitted.
(3)Improving the understanding of aerosol-cloud interactions.How chemical species co-emitted with BC influence clouds is one of the most difficult challenges,because the microphysical processes involved are very complex.Although the direct radiative effect of BC has been shown to be a strong warming,the semi-direct and indirect effects of BC have large uncertainties either with sign and magnitude.Considering that aerosol-cloud interactions have the largest uncertainties among the drivers of climate change(IPCC, 2013),quantification of aerosol-cloud interactions is critical for assessing the benefits of emission control measures.
(4)Continuous development of fully coupled chemistry-aerosol-climate models.As reported by IPCC(2013),a large fraction of climate models can simulate chemistry and transport of tropospheric O3and aerosols,but few of them have fully coupled meteorology-aerosol-cloud-radiative forcing feedbacks, especially with the consideration of all ma jor anthropogenic and natural aerosol species and the radiative effects of aerosols on distributions and concentrations of chemical species.
(5)Through atmospheric transport,pollutants can be carried from one location to another.Therefore,how different countries/regions are accountable for the emissions and how they can establish emission control collaboration to achieve mutual benefits are very important questions.These issues are relatively less studied in current literature and remain an important bottleneck affecting the effectiveness of emission control.
REFERENCES
Andreae,M.O.,O.Schmid,H.Yang,et al.,2008:Optical properties and chemical composition of the atmospheric aerosol in urban Guangzhou,China.Atmos. Environ.,42,6335-6350.
Bergin,M.H.,G.R.Cass,J.Xu,et al.,2001:Aerosolradiative,physical,and chemical properties in Beijing during June 1999.J.Geophys.Res.,106,17969-17980.
Bond,T.C.,S.J.Doherty,D.W.Fahey,et al.,2013: Bounding the role of black carbon in the climate system:A scientific assessment.J.Geophys.Res.,118,5380-5552.
Cao,G.L.,X.Y.Zhang,and F.C.Zheng,2006:Inventory of black carbon and organic carbon emissions from China.Atmos.Environ.,40,6516-6527.
Cao,J.J.,S.C.Lee,J.C.Chow,et al.,2007:Spatial and seasonal distributions of carbonaceous aerosols over China.J.Geophys.Res.,112,D22s11,doi: 10.1029/2006JD008205.
Cao,J.J.,Z.X.Shen,J.C.Chow,et al.,2009:Seasonal variations and sources of mass and chemical composition for PM10aerosol in Hangzhou,China. Particuology,7,161-168.
Cao,C.X.,S.Zheng,and R.P.Singh,2014:Characteristics of aerosol optical properties and meteorological parameters during three major dust events (2005-2010)over Beijing,China.Atmos.Res.,150, 129-142.
Carmichael,G.R.,M.Ferm,N.Thongboonchoo,et al., 2003:Measurements of sulfur dioxide,ozone and ammonia concentrations in Asia,Africa,and South America using passive samplers.Atmos.Environ.,37,1293-1308.
Chang Wenyuan,Liao Hong,and Wang Huijun,2009: Climate responses to direct radiative forcing of anthropogenic aerosols,tropospheric ozone,and long-lived greenhouse gases in eastern China over 1951-2000.Adv.Atmos.Sci.,26,748-762.
Chen,W.-T.,Y.H.Lee,P.J.Adams,et al.,2010:Will black carbon mitigation dampen aerosol indirect forcing?Geophys.Res.Lett.,37,L09801,doi: 10.1029/2010GL042886.
Cheng,Y.F.,A.Wiedensohler,H.Eichler,et al.,2008: Aerosol optical properties and related chemical apportionment at Xinken in Pearl River Delta of China.Atmos.Environ.,42,6351-6372.
Chung,S.H.,and J.H.Seinfeld,2005:Climate response of direct radiative forcing of anthropogenic black carbon.J.Geophys.Res.,110,doi: 10.1029/2004JD005441.
Cong,Z.Y.,S.C.Kang,S.P.Gao,et al.,2013:Historical trends of atmospheric black carbon on Tibetan Plateau as reconstructed from a 150-yr lake sediment record.Environ.Sci.Technol.,47,2579-2586.
Cui Zhenlei,Zhang Hua,and Yin Yan,2009:A modeling study with MATCH on the aerosol optical depth distribution over China in 2006.Remote Sensing Technology and Application,24,197-203.(in Chinese)
Ding,A.J.,T.Wang,V.Thouret,et al.,2008:Tropospheric ozone climatology over Beijing:Analysis of aircraft data from the MOZAIC program.Atmos. Chem.Phy.,8,1-13.
Dufour,G.,M.Eremenko,J.Orphal,et al.,2010:IASI observations of seasonal and day-to-day variations of tropospheric ozone over three highly populated areas of China:Beijing,Shanghai,and Hong Kong. Atmos.Chem.Phy.,10,3787-3801.
Fan Xuehua,Cheng Hongbin,Xia Xiangao,et al.,2010: Aerosol optical properties from the atmospheric radiation measurement mobile facility at Shouxian,China.J.Geophys.Res.,115,D00K33,doi: 10.1029/2010JD014650.
Gao Runxiang,Niu Shengjie,Zhang Hua,et al.,2008: An observational study of black carbon aerosol in Northwest China in the spring of 2006.J.Nanjing Inst.Meteor.,31,655-661.(in Chinese)
Garland,R.M.,O.Schmid,A.Nowak,et al.,2009: Aerosol optical properties observed during Campaign of Air Quality Research in Beijing 2006 (CAREBeijing-2006):Characteristic differences between the inflow and outflow of Beijing city air. J.Geophys.Res.,114,D00G04,doi:10.1029/ 2008JD010780.
Guo,L.,E.J.Highwood,L.C.Shaffrey,et al.,2013:The effect of regional changes in anthropogenic aerosols on rainfall of the East Asian summer monsoon.Atmos.Chem.Phy.,13,1521-1534.
Han,Y.M.,J.J.Cao,B.Z.Yan,et al.,2011:Comparison of elemental carbon in lake sediments measured by three different methods and 150-yr pollution history in eastern China.Environ.Sci.Technol.,45, 5287-5293.
Hansen,J.,M.Sato,R.Ruedy,et al.,2007:Climate simulations for 1880-2003 with GISS modelE.Climate Dyn.,29,661-696.
He,X.,C.C.Li,A.K.H.Lau,et al.,2009:An intensive study of aerosol optical properties in Beijing urban area.Atmos.Chem.Phy.,9,8903-8915.
IPCC,2013:Summary for Policymakers.Climate change 2013:The Physical Science Basis.Contribution of Working Group I to the Fifth Assessment Report of the Intergovernmental Panel on Climate Change, Stocker,T.F.,D.Qin,G.-K.Plattner,et al.,Eds., Cambridge University Press,Cambridge,United Kingdom and New York,NY,USA,2216 pp.
Jacobson,M.Z.,2004:Climate response of fossil fueland biofuel soot,accounting for soot’s feedback to snow and sea ice albedo and emissivity.J.Geophys.Res.,109,D21201,doi:10.1029/2004JD004945.
Jacobson,M.Z.,2005:Correction to control of fossilfuel particulate black carbon and organic matter, possibly the most effective method of slowing global warming.J.Geophys.Res.,110,D14105,doi: 10.1029/2005JD005888.
Janssens,I.A.,W.Dieleman,S.Luyssaert,et al.,2010: Reduction of forest soil respiration in response to nitrogen deposition.Nature Geoscience,3,315-322.
Jiang,H.,H.Liao,H.O.T.Pye,et al.,2013:Projected effect of 2000-2050 changes in climate and emissions on aerosol levels in China and associated transboundary transport.Atmos.Chem.Phy.,13, 7937-7960.
Jiang Yiquan,Liu Xiaohong,Yang Xiuqun,et al.,2013: A numerical study of the effect of different aerosol types on East Asian summer clouds and precipitation.Atmos.Environ.,70,51-63.
Kaufman,Y.J.,B.N.Holben,D.Tanr′e,et al.,2000: Will aerosol measurements from Terra and Aqua polar orbiting satellites represent the daily aerosol abundance and properties?Geophys.Res.Lett.,27,3861-3864.
Kim,D.-H.,B.-J.Sohn,T.Nakajima,et al.,2004: Aerosol optical properties over East Asia determined from ground-based sky radiation measurements.J.Geophys.Res.,109,D02209,doi: 10.1029/2003JD003387.
Koch,D.,M.Schulz,S.Kinne,et al.,2009:Evaluation of black carbon estimations in global aerosol models. Atmos.Chem.Phy.,9,9001-9026.
Kopacz,M.,D.L.Mauzerall,J.Wang,et al.,2011:Origin and radiative forcing of black carbon transported to the Himalayas and Tibetan Plateau.Atmos. Chem.Phy.,11,2837-2852,doi:10.5194/acp-11-2837-2011.
Lamarque,J.-F.,J.T.Kiehl,G.P.Brasseur,et al.,2005: Assessing future nitrogen deposition and carbon cycle feedback using a multimodel approach:Analysis of nitrogen deposition.J.Geophys.Res.,110, D19303,doi:10.1029/2005JD005825.
Lee,K.H.,Z.Q.Li,M.S.Wong,et al.,2007:Aerosol single scattering albedo estimated across China from a combination of ground and satellite measurements.J.Geophys.Res.,112,D22S15,doi: 10.1029/2007JD009077.
Li,C.,L.T.Marufu,R.R.Dickerson,et al.,2007:In situ measurements of trace gases and aerosol optical properties at a rural site in northern China during East Asian study of tropospheric aerosols:An international regional experiment 2005.J.Geophys. Res.,112,D22S04,doi:10.1029/2006JD007592.
Li Xingsheng,He Zhuanshi,Fang Xiumei,et al.,1999: Distribution of surface ozone concentration in the clean areas of China and its possible impact on crop yields.Adv.Atmos.Sci.,16,154-158.
Li,Z.Q.,H.Chen,M.Cribb,et al.,2007:Preface to special section on East Asian studies of tropospheric aerosols:An international regional experiment(EAST-AIRE).J.Geophys.Res.,112, D22S04,doi:10.1029/2006JD007592.
Liao,H.,and J.H.Seinfeld,2005:Global impacts of gas-phase chemistry-aerosol interactions on direct radiative forcing by anthropogenic aerosols and ozone.J.Geophys.Res.,110,D18208,doi: 10.1029/2005JD005907.
Liao,H.,W.-T.Chen,and J.H.Seinfeld,2006:Role of climate change in global predictions of future tropospheric ozone and aerosols.J.Geophys.Res.,111, D12304,doi:10.1029/2005jd006852.
Liao Hong and Chang Wenyuan,2014:Integrated assessment of air quality and climate change for policymaking:Highlights of IPCC AR5 and research challenges.National Science Review,1,176-179,doi: 10.1093/nsr/nwu005.
Lin,W.,X.Xu,X.Zhang,et al.,2008:Contributions of pullutants from North China Plain to surface ozone at the Shangdianzi GAW Station.Atmos.Chem. Phy.,8,5889-5898.
Liu,X.,K.Chang,C.E.Sioris,et al.,2006:First directly retrieved global distribution of tropospheric column ozone from GOME:Comparison with the GEOSCHEM model.J.Geophys.Res.,111,D02308,doi: 10.1029/2005JD006564.
Liu Jianjun,Zheng Youfei,Li Zhanqing,et al.,2008: Ground-based remote sensing of aerosol optical properties in one city in Northwest China.Atmos. Res.,89,194-205.
Lou Sijia,Liao Hong,and Zhu Bin,2014:Impacts of aerosols on surface-layer ozone concentrations in China through heterogeneous reactions and changes in photolysis rates.Atmos.Environ.,85,123-138.
Lu,Z.,Q.Zhang,and D.G.Streets,2011:Sulfur dioxide and primary carbonaceous aerosol emissions in China and India,1996-2010.Atmos.Chem.Phy.,11,9839-9864.
Lyapustin,A.,A.Smirnov,B.Holben,et al.,2011:Reduction of aerosol absorption in Beijing since 2007 from MODIS and AERONET.Geophys.Res.Lett.,38,L10803,doi:10.1029/2011GL047306.
Ma Jinghui,Zheng Youfei,and Zhang Hua,2007:The optical depth global distribution of black carbon aerosol and its possible reason analysis.Scientia Meteor.Sinica,27,549-556.(in Chinese)
Ma,N.,C.S.Zhao,A.Nowak,et al.,2011:Aerosol optical properties in the North China Plain during HaChi campaign:An in-situ optical closure study. Atmos.Chem.Phy.,11,5959-5973.
Meng,Z.Y.,X.B.Xu,P.Yan,et al.,2009:Characteristics of trace gaseous pollutants at a regional background station in northern China.Atmos.Chem. Phy.,9,927-936.
Menon,S.,J.Hansen,L.Nazarenko,et al.,2002:Climate effects of black carbon aerosols in China and India. Science,297,2250-2253.
Menon,S.,D.Koch,G.Beig,et al.,2010:Black carbon aerosols and the third polar ice cap.Atmos. Chem.Phy.,10,4559-4571,doi:10.5194/acp-10-4559-2010.
Ming,J.,H.Cachier,C.Xiao,et al.,2008:Black carbon record based on a shallow Himalayan ice core and its climatic implications.Atmos.Chem.Phy.,8, 1343-1352.
M¨uller,D.,M.Tesche,H.Eichler,et al.,2006:Strong particle light absorption over the Pearl River Delta (South China)and Beijing(North China)determined from combined Raman lidar and Sun photometer observations.Geophys.Res.Lett.,33, L20811,doi:10.1029/2006GL027196.
Prather,M.J.,C.D.Holmes,and J.Hsu,2012:Reactive greenhouse gas scenarios:Systematic exploration of uncertainties and the role of atmospheric chemistry.Geophys.Res.Lett.,39,L09803,doi: 10.1029/2012GL051440.
Qin,Y.,and S.D.Xie,2011:Estimation of county-level black carbon emissions and its spatial distribution in China in 2000.Atmos.Environ.,45,6995-7004. Qin,Y.,and S.D.Xie,2012:Spatial and temporal variation of anthropogenic black carbon emissions in China for the period 1980-2009.Atmos.Chem. Phy.,12,4825-4841.
Qiu Jinhuan,Yang Liquan,and Zhang Xiaoye,2004: Characteristics of the imaginary part and singlescattering albedo of urban aerosols in northern China.Tellus B,56,276-284.
Qiu Jinhuan and Yang Jingmei,2008:Absorption properties of urban/suburban aerosols in China.Adv. Atmos.Sci.,25,1-10.
Qu Wenjun,Zhang Xiaoye,Wang Yaqiang,et al.,2006: The physical and chemical characterization of carbonaceous aerosol at the atmospheric background site in Diqing,Yunnan.China Environ.Sci.,26, 266-270.(in Chinese)
Qu Wenjun,Wang Jun,Gao Shanhong,et al.,2013: Effect of the strengthened western Pacific subtropical high on summer visibility decrease over eastern China since 1973.J.Geophys.Res.,118,7142-7156,doi:10.1002/jgrd.50535.
Ramanathan,V.,P.J.Crutzen,J.T.Kiehl,et al.,2001: Aerosols,climate,and the hydrological cycle.Science,294,2119-2124.
Shindell,D.,J.C.I.Kuylenstierna,E.Vignati,et al., 2012:Simultaneously mitigating near-term climate change and improving human health and food security.Science,335,183-189.
Stevenson,D.S.,F.J.Dentener,M.G.Schultz,et al., 2006:Multimodel ensemble simulations of presentday and near-future tropospheric ozone.J.Geophys. Res.,111,D08301,doi:10.1029/2005JD006338.
Takami,A.,W.Wang,D.G.Tang,et al.,2006:Measurements of gas and aerosol for two weeks in northern China during the winter-spring period of 2000,2001, and 2002.Atmos.Res.,82,688-697.
Tang,G.,X.Li,Y.Wang,et al.,2009:Surface ozone trend details and interpretations in Beijing,2001-2006.Atmos.Chem.Phy.,9,8813-8823.
Tu Jun,Xia Zongguo,Wang Hesheng,et al.,2007:Temporal variations in surface ozone and its precursors and meteorological effects at an urban site in China. Atmos.Res.,85,310-337.
UNEP,2011:Integrated Assessment of Black Carbon and Tropospheric Ozone:Summary for Decision Makers.Nairobi,UNON,Publishing Services Section, 36 pp.
Wang Rong,Tao Shu,Wang Wentao,et al.,2012:Black carbon emissions in China from 1949 to 2050.Environ.Sci.Technol.,46,7595-7603.
Wang,T.,H.L.A.Wong,J.Tang,et al.,2006: On the origin of surface ozone and reactive nitrogen observed at a remote mountain site in the northeastern Qinghai-Tibetan Plateau,western China.J.Geophys.Res.,111,D08303,doi: 10.1029/2005JD006527.
Wang Tijian,Xie Min,Gao Lijie,et al.,2004:Development and preliminary application of a coupled regional climate-chemistry model system.J.Nanjing Univ.(Nat.Sci.),40,711-727.(in Chinese)
Wang Weiguo,Wu Jian,Liu Hongnian,et al.,2005: Researches on the influence of pollution emission on tropospheric ozone variation and radiation over China and its adjacent area.Chinese J.Atmos. Sci.,29,734-746.(in Chinese)
Wang Xin,Xu Baiqing,and Ming Jing,2014:An overview of the studies on black carbon and mineral dust deposition in snow and ice cores in East Asia. J.Meteor.Res.,28,354-370,doi:10.1007/s13351-014-4005-7.
Wang,Y.,Y.Zhang,J.Hao,et al.,2011:Seasonal and spatial variability of surface ozone over China:Contributions from background and domestic pollution. Atmos.Chem.Phy.,11,3511-3525.
Wang Yuxuan,Shen Lulu,Wu Shiliang,et al.,2013: Sensitivity of surface ozone over China to 2000-2050 global changes of climate and emissions.Atmos.Environ.,75,374-382,doi:10.1016/j.atmosenv.2013.04.045.
Wang Yuesi,Xin Jinyuan,Pan Yuepeng,et al.,2014: The Campaign on atmospheric Aerosol REsearch network of China:CARE-China.Bull.Amer.Meteor.Soc.,doi:10.1175/BAMS-D-14-00039.1.
Wang Zhili,Guo Pinwen,and Zhang Hua,2009:A numerical study of direct radiative forcing due to black carbon and its effects on the summer precipitation in China.Climatic Environ.Res.,14,161-171.(in Chinese)
Wang Zhili,Zhang Hua,and Shen Xueshun,2011:Radiative forcing and climate response due to black carbon in snow and ice.Adv.Atmos.Sci.,28, 1336-1344,doi:10.1007/s00376-011-0117-5.
Wendisch,M.,O.Hellmuth,A.Ansmann,et al.,2008: Radiative and dynamic effects of absorbing aerosol particles over the Pearl River Delta,China.Atmos. Environ.,42,6405-6416.
Wild,O.,and H.Akimoto,2001:Intercontinental transport of ozone and its precursors in a threedimensional global CTM.J.Geophys.Res.,106, 27729-27744.
Wu,J.,C.Fu,Y.Xu,et al.,2008:Simulation of direct effects of black carbon aerosol on temperature and hydrological cycle in Asia by a Regional Climate Model.Meteor.Atmos.Phys.,100,179-193.
Xia Xiang’ao,Chen Hongbin,Wang Pucai,et al.,2005: Aerosol properties and their spatial and temporal variations over North China in spring 2001.Tellus B,57,28-39.
Xia,X.A.,H.B.Chen,P.C.Wang,et al.,2006:Variation ofcolumn-integrated aerosolproperties in a Chinese urban region.J.Geophys.Res.,111,D05204, doi:10.1029/2005JD006203.
Xu,B.Q.,J.J.Cao,J.Hansen,et al.,2009:Black soot and the survival of Tibetan glaciers.Proc.Nat. Acad.Sci.USA,106,22114-22118.
Xu,J.,M.H.Bergin,X.Yu,et al.,2002:Measurement of aerosol chemical,physical and radiative properties in the Yangtze Delta region of China.Atmos. Environ.,36,161-173.
Xu Jin,M.H.Bergin,R.Greenwald,et al.,2004:Aerosol chemical,physical,and radiative characteristics near a desert source region of Northwest China during ACE-Asia.J.Geophys.Res.,109,D19S03,doi: 10.1029/2003JD004239.
Xu,J.,J.Z.Ma,X.L.Zhang,et al.,2011:Measurements of ozone and its precursors in Beijing during summertime:Impact of urban plumes on ozone pollution in downwind rural areas.Atmos.Chem.Phy.,11, 12241-12252.
Xu,X.,W.Lin,T.Wang,et al.,2008:Long-term trend of surface ozone at a regional background station in eastern China during 1991-2006:Enhanced variability.Atmos.Chem.Phy.,8,2595-2607.
Xu Xiaoguang,Wang Jun,D.K.Henze,et al.,2013: Constraints on aerosol sources using GEOS-Chem adjoint and MODIS radiances,and evaluation with multisensor(OMI,MISR)data.J.Geophys.Res.,118,6396-6413,doi:10.1002/jgrd.50515.
Yan Peng,Li Xingsheng,Luo Chao,et al.,1997:Observational analysis of surface O3,NOx,and SO2in China.J.Appl.Meteor.Sci.,8,53-61.(in Chinese)
Yan Peng,Wang Mulin,Cheng Hongbing,et al.,2003: Distributions and variations of surface ozone in Changshu,Yangtze Delta region.Acta Metallurgica Sinica,17,205-217.
Yan,P.,J.Tang,J.Huang,et al.,2008:The measurement of aerosol optical properties at a rural site in northern China.Atmos.Chem.Phy.,8,2229-2242.
Yu Xingna,Zhu Bin,and Zhang Meigen,2009:Seasonal variability of aerosol optical properties over Beijing. Atmos.Environ.,43,4095-4101.
Zhang Hua,Ma Jinghui,and Zheng Youfei,2008:The study of global radiative forcing due to black carbon aerosol.Chinese J.Atmos.Sci.,32,1147-1158.(in Chinese)
Zhang Hua,Wang Zhili,Guo Pinwen,et al.,2009:A modeling study of the effects of direct radiative forcing due to carbonaceous aerosol on the climate in East Asia.Adv.Atmos.Sci.,26,57-66.
Zhang Hua,Wang Zhili,Wang Zaizhi,et al.,2012:Simulation of direct radiative forcing of aerosols and their effects on East Asian climate using an interactive AGCM-aerosol coupled system.Climate Dyn.,38, 1675-1693,doi:10.1007/s00382-011-1131-0.
Zhang Hua,Xie Bing,Zhao Shuyun,et al.,2014:PM2.5and tropospheric O3in China and an analysis of the impact of pollutant emission control.Adv.Climate Change Res.,5,136-141.
Zhang Li,Liao Hong,and Li Jianping,2010a:Impacts of Asian summer monsoon on seasonal and interannual variations of aerosols over eastern China.J.Geophys.Res.,115,D00K05,doi: 10.1029/2009JD012299.
Zhang,L.,H.Liao,and J.Li,2010b:Impact of the Southeast Asian summer monsoon strength on the outflow of aerosols from South Asia.Annales Geophysicae,28,277-287.
Zhang,Q.,D.G.Streets,G.R.Carmichael,et al.,2009: Asian emissions in 2006 for the NASA INTEX-B mission.Atmos.Chem.Phy.,9,5131-5153.
Zhang,X.Y.,Y.Q.Wang,D.Wang,et al.,2005: Characterization and sources of regional-scale transported carbonaceous and dust aerosols from different pathways in coastal and sandy land areas of China.J.Geophys.Res.,110,D15301,doi: 10.1029/2004JD005457.
Zhang,X.Y.,Y.Q.Wang,X.C.Zhang,et al.,2008b: Carbonaceous aerosol composition over various regions of China during 2006.J.Geophys.Res.,113, D14111,doi:10.1029/2007JD009525.
Zhuang Bingliang,Wang Tijian,and Li Shu,2009:The first indirect radiative forcing ofblack carbon aerosol and its effect on regional climate of China.Plateau Meteor.,28,1095-1104.(in Chinese)
Zhuang,B.L.,L.Liu,F.H.Shen,et al.,2010a:Semidirect radiative forcing of internal mixed black carbon cloud droplet and its regional climatic effect over China.J.Geophys.Res.,115,D00K19,doi: 10.1029/2009JD013165.
Zhuang Bingliang,Jiang Fei,Wang Tijian,et al.,2010b: Investigation on the direct radiative effect of fossil fuel black-carbon aerosol over China.Theor.Appl. Climatol.,104,301-312.
Zhuang Bingliang,Liu Qian,Wang Tijian,et al.,2013: Investigation on semi-direct and indirect climate effects of fossil fuel black carbon aerosol over China. Theor.Appl.Climatol.,114,651-672.
Zhuang,B.L.,T.J.Wang,S.Li,et al.,2014:Optical properties and radiative forcing of urban aerosols in Nanjing,China.Atmos.Environ.,83,43-52.
Liao Hong and Shang Jingjing,2015:Regionalwarming by black carbon and tropospheric ozone: A review of progresses and research challenges in China.J.Meteor.Res.,29(4),525-545,
10.1007/s13351-015-4120-0.
Supported by the National(Key)Basic Research and Development(973)Program of China(2014CB441202)and Strategic Priority Research Program of the Chinese Academy of Sciences Strategic Priority Research Program(XDA05100503).
?hongliao@mail.iap.ac.cn.
?The Chinese Meteorological Society and Springer-Verlag Berlin Heidelberg 2015
November 24,2014;in final form April 10,2015)
猜你喜歡
Acta Mathematica Scientia(English Series)(2023年6期)2023-04-25 01:41:36
小學(xué)生學(xué)習指導(dǎo)(高年級)(2023年3期)2023-03-31 06:03:22
兒童故事畫報·自然探秘(2022年3期)2022-04-27 00:17:10
小學(xué)生學(xué)習指導(dǎo)(高年級)(2021年10期)2021-11-24 02:04:06
瘋狂英語·新悅讀(2021年5期)2021-06-08 01:54:06
閱讀(快樂英語高年級)(2021年2期)2021-04-26 21:11:28
藝術(shù)啟蒙(2020年12期)2020-12-24 02:34:54
作文評點報·低幼版(2020年32期)2020-07-23 06:46:25
青年生活(2019年3期)2019-09-10 16:57:14
兒童故事畫報·自然探秘(2019年10期)2019-01-14 02:44:04
 Journal of Meteorological Research2015年4期
- Journal of Meteorological Research的其它文章
- Information for Contributors
- Responses of Irrigated Winter Wheat Yield in North China to Increased Temperature and Elevated CO2Concentration
- An Example of Canal Formation in a Thick Cloud Induced by Massive Seeding Using Liquid Carbon Dioxide
- Numerical Simulations of Local Circulation and Its Response to Land Cover Changes over the Yellow Mountains of China
- Flux Footprint Climatology Estimated by Three Analytical Models over a Subtropical Coniferous Plantation in Southeast China
- Changes in Stratospheric ClO and HCl Concentrations Under Different Greenhouse Gas Emission Scenarios