
Phylogenetic Patterns of the Southeast Asian Tree Frog chiromantis hansenae in Thailand
2014-03-25 01:51:15*
Asian Herpetological Research 2014年3期
*
1Department of Zoology, Faculty of Science, Kasetsart University, Bangkok 10900, Thailand
2Sam Noble Oklahoma Museum of Natural History and Department of Biology, University of Oklahoma, Norman, OK 73072-7029, USA
3School of Biology, Institute of Science, Suranaree University of Technology, Nakhon Ratchasima 30000, Thailand
Phylogenetic Patterns of the Southeast Asian Tree Frog chiromantis hansenae in Thailand
Siriporn YODTHONG1, cameron D. SILER2, Pongpun PRASANKOK3and Anchalee AOWPHOL1*
1Department of Zoology, Faculty of Science, Kasetsart University, Bangkok 10900, Thailand
2Sam Noble Oklahoma Museum of Natural History and Department of Biology, University of Oklahoma, Norman, OK 73072-7029, USA
3School of Biology, Institute of Science, Suranaree University of Technology, Nakhon Ratchasima 30000, Thailand
Although landscape features such as mountains and rivers are recognized often as limiting factors to amphibian dispersal and gene flow, a limited number of studies have investigated such patterns across Southeast Asia. A perfect example of this is Thailand, located in one of the world’s biodiversity hotspot regions. Thailand represents the corridor between mainland Asia and the Sunda Shelf, a famous and widely recognized biogeographic region, and yet there are few studies on the genetic structure among populations of amphibian species distributed across Thailand. The Southeast Asian tree frog, chiromantis hansenae has been reported to possess a geographic range that is restricted to Thailand and, presumably, cambodia. Here, we investigate phylogenetic relationships among c. hansenae populations using partial sequences of the mitochondrial 16S rRNA gene and nuclear POMc gene. Our results reveal two distinct evolutionary lineages within c. hansenae populations in Thailand. The genetic divergence among populations between these two clades is considerable, and results support inter-population divergence, and high genetic differentiation (pairwise FST= 0.97), between two localities sampled in western Thailand (TK1 and TK2), separated from each other by 40 kilometers only. The results suggest that landscape features across Thailand may have a profound impact on patterns of diversification in the country, underscoring the urgent need for fine-scale investigations of genetic structure of endemic and “widespread” species.
16s rRNA, Genetic diversity, Isthmus of Kra, Landscape barriers, POMc, Southeast Asia
1. Introduction
The biodiversity of many complex landscapes is shaped by geologic events and climatic changes (Zink, 2002). Knowledge of the degree to which these environmental changes and conditions impact putatively widespread species provides critical information on the evolutionary trajectories of lineages (Hickerson et al., 2010) and the regional distribution of diversity. Today, a necessary firststep in exploring the impact these potential forces have on species diversification is to study phylogeographic diversity across a species distribution. From this baseline information, multi-taxon, or comparative phylogeographic studies based on ecological, demographic, and molecular data (e.g., Zink, 2002; Lessa et al., 2003; Feldman and Spicer, 2006), can then allow for more robust inferences about barriers to gene flow, concordance between population genetic structures, and the influences of geography and climate on the evolution of the ranges of species (Arbogast and Kenagy, 2001; Knowles and Alvarado-Serrano, 2010).
Southeast (SE) Asia has quickly become an intriguing system for investigating the effects of ecological, tectonic,
and climatic processes on vertebrate diversification because it has a complex geological history and diverse geography (Evans et al., 2003; Jansa et al., 2006; Brown et al., 2013). Within this region, the Thai-Malay Peninsula has been a classic system for studies investigating patterns and processes of diversification and faunal transitions, particularly the Isthmus of Kra (reviewed by Woodruff and Turner, 2009). The Isthmus of Kra (~10°30' N) covers a transition between two distinct zoogeographic subregions, the Indochinese and Sundaic (Woodruff and Turner, 2009). Researchers have documented high percentages of species turnover across this region; examples include birds (greater than 50% turnover; Hughes et al., 2003; Round et al., 2003; Woodruff, 2003a,b), plants (Wikramanayake et al., 2002; Woodruff and Turner, 2009), and mammals (for review, see Woodruff and Turner, 2009). Although the regional position of floral and faunal turnover across the Isthmus of Kra coincides with a major north-south climate gradient, recent studies indicate the factors driving these species transitions are more complex, and likely involve dramatic sea-level changes resulting from historical climate oscillations (Woodruff, 2003b; Pimvichai et al., 2014). These findings are consistent with a nascent body of literature focused on other regions of Southeast Asia (for review, see Siler et al., 2014; Brown et al., 2013). To date, few phylogenetic studies have focused on population- and species-level diversity across this historically famous ecotone (Pimvichai et al., 2014); however, arboreal frogs of the family Rhacophoridae represent an ideal group for such investigations.
Although our understanding of species-level diversity among frogs of the family Rhacophoridae has improved greatly over the last decade, largely as a result of numerous phylogenetic studies aimed at elucidating genetic, ecological and morphological diversity (Yu et al., 2009; Brown et al., 2010; Li et al., 2011, 2013; Hertwig et al., 2013; Gonzalez et al., 2014), it is clear that many genera within this family remain poorly understood. A prime example includes the enigmatic frogs of the genus chiromantis Peter, 1854. currently, 15 species are recognized in the genus chiromantis, with four species, c. vittatus (Boulenger, 1887), c. doriae (Boulenger, 1893), c. hansenae (cochran, 1927) and c. nongkhorensis (cochran, 1927), recognized to occur in Thailand (Taylor, 1962; chan-ard, 2003; Frost, 2013).
Of these species, chiromantis hansenae is a poorly understood, small-bodied (21–24 mm SVL) rhacophorid frog with brown or light lavender body coloration, and parallel cream, yellow or white dorsolateral stripes. This species is distributed in northern, east central and southeastern Thailand, and presumably occurs in adjacent cambodia and possibly Myanmar (Figure 1). The type locality of c. hansenae is recognized as Nong Khor, chonburi Province, southeastern Thailand (cochran, 1927; Taylor, 1962; Frost, 2013). This species has been recorded up to mid-elevations (ranging up to 900 m asl; Stuart et al., 2004), and is arboreal, inhabiting secondary and primary growth forests and breeding in small rain pools or ponds (Taylor, 1962; Sheridan and Ocock, 2008; chan et al., 2011). chiromantis hansenae deposits green eggs in gelatinous masses on plants above lentic water bodies, and display parental care behavior, with eggs guarded by the parental female until hatched (Sheridan and Ocock, 2008; Poo and Bickford, 2013).
The validity of c. hansenae as a unique species, distinct from c. vittatus, had been questioned by earlier studies (Wilkinson et al., 2002; Stuart and Emmet, 2006; chan et al., 2011), however, Aowphol et al. (2013) presented robust data supporting the recognition of c. hansenae on the basis of several distinct datasets: molecular, morphological, and bioacoustics. Furthermore, Aowphol et al. (2013) presented preliminary evidence supporting the presence of two distinct evolutionary lineages of c. hansenae within Thailand. However, prior to this study, sufficient geographic sampling to elucidate cryptic lineage diversity and describe interpopulation genetic structure within the species has not been available. In this study, we use newly collected and vouchered specimens from across Thailand, and novel molecular genetic datasets, to investigate patterns of genetic diversity among populations of c. hansenae.
2. Materials and Methods
2.1 Samplingchiromantis hansenae was sampled at nine distinct localities across Thailand during 2011–2013 field expeditions, representing the geographic range of this species (Figure 1, Table 1). The sampled localities include: Mae Hong Son (MHS), Tak1 (TK1), Tak2 (TK2), Loei (LE), Kanchanaburi (KcB), Nakhon Ratchasima (NRS), chonburi and chanthaburi (cB), Prachuap Khiri Khan (PK) and Surat Thani (SRT). Individuals were collected by locating calling males and by visual encounter surveys. Specimens were euthanized using MS-222, fixed in 10% formalin, and subsequently preserved in 70% ethyl alcohol. Liver or muscle tissues were removed from each individual prior to formalin preservation, and preserved in 95% ethyl alcohol and stored at 4°c for DNA extraction. Voucher specimens are deposited in the
herpetological collection, Zoological Museum, Kasetsart University, Bangkok, Thailand (ZMKU; Appendix A).
Based on these surveys, 135 individuals of chiromantis hansenae were available as ingroup samples. Sequence data for some ingroup samples were already available on GenBank and included in this study (GenBank accession numbers for 16S: Kc357625–Kc357634, Kc357636–Kc357645, Kc357647–Kc357669; Aowphol et al., 2013; Appendix A). Outgroup samples were chosen based on recent phylogenetic studies, and included Rhacophorus kio and Polypedates leucomystax (GenBank accession numbers: 16S, EU215532, AB728137; POMc, GQ285734, AB728240; Li et al., 2008, 2009; Kuraishi et al., 2013). Samples of c. vittatus was not included in the phylogenetic analyses following the results of Aowphol et al. (2013), which provided robust support for c. hansenae as a distinct species from c. vittatus based on the mitochondrial 16S ribosomal RNA gene.
2.2 DNA extraction, amplification and sequencingTotal genomic DNA was extracted from liver or muscle tissue samples using the DNeasy Blood & Tissue Kit (Qiagen, Inc.) following the manufacturer’s instructions. A partial fragment of the mitochondrial 16S ribosomal RNA (16S) gene was amplified via polymerase chain
reaction (PcR) using previously published primers and protocols (16Sc, 16Sd; Moriarty and cannetella, 2004). Additionally, a fragment of the nuclear DNA proopiomelanocortin (POMc) gene was amplified via PcR using published primers and protocols (POMc-1, POMc-7; Kuraishi et al., 2013). PcR amplifications were carried out in 25 μl volumes containing: 1 μl of DNA template, 10 nM dNTP, 10 μM of each primer, 50 nM Mgcl2, 10× PcR buffer, and 5U Taq DNA polymerase. Annealing temperatures for 16S and POMc were 52°c and 55°c, respectively. PcR products were purified using the Qiagen PcR Purification Kit (Qiagen, Inc.). Sequencing reactions were performed by Macrogen Inc. (Seoul, Korea) using an ABI 3730 automatic sequencer. Novel sequence data was deposited in GenBank (Accession numbers for 16S: KJ546807–KJ546839; POMc: KJ546672–KJ546806).

Table 1 Summary of chiromantis sampling (N), number of haplotypes (Nh), number of unique haplotype (Nu), haplotype diversity (h), and nucleotide diversity (π) based on the mitochondrial 16S rRNA dataset.
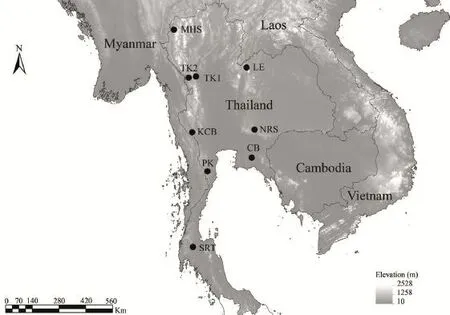
Figure 1 Map of Thailand showing sampling localities of chiromantis hansenae populations incorporated into this study: Mae Hong Son (MHS); Tak1 (TK1); Tak2 (TK2); Loei (LE); Kanchanaburi (KcB); Nakhon Ratchasima (NRS); chonburi and chanthaburi (cB); Prachuap Khiri Khan (PK); and Surat Thani (SRT).
2.3 Phylogenetic analysesInitial alignments were produced in Geneious v5.6.3 (Biomatter, Ltd.), with subsequent manual adjustments made visually. Fifteen base pairs of ambiguous alignments were excluded from analyses, and gaps from the alignment were treated as missing data. To assess phylogenetic congruence between the mitochondrial and nuclear data, we inferred the phylogeny for each subset independently using Bayesian analyses. Following the observation of several instances of strongly supported incongruence between datasets, we conducted separate phylogenetic analyses for each dataset.
Partitioned Bayesian analyses were conducted in MrBayes v3.2.1 (Ronquist and Huelsenbeck, 2003). We treated the 16S dataset as a single data partition, but partitioned POMc by codon position. The Akaike information criterion (AIc), as implemented in jModelTest v2.1.4 (Darriba et al., 2012), was used to select the best model of nucleotide substitution for each partition (16S = GTR + Γ; POMc position 1 = HKY + Γ, positions 2, 3 = GTR + Γ). A rate-multiplier model was used to allow substitution rates to vary among subsets, and default priors were used for all substitution parameters. We ran four independent Markov chain Monte carlo (McMc) analyses, each with four Metropoliscoupled chains, and an incremental heating temperature of 0.02 for 16S and POMc, respectively. All analyses were run for 10 million generations, with parameters and topologies sampled every 1000 generations. To assess chain stationarity, all sampled parameter values and log-likelihood scores from the cold Markov chain were plotted against generation time and compared among independent runs using Tracer v1.4 (Rambaut and Drummond, 2007). We conservatively discarded the first 25% of samples as burn-in.
2.4 Geographic and Population structureDue to the low intraspecific genetic diversity observed for the nuclear sequence data, only mitochondrial data (16S) was used for population structure analyses. To assess general population genetic diversity among and within sampled populations, we calculated haplotype diversity (h; Nei, 1987), nucleotide diversity (π; Nei and Tajima, 1981), the numbers of haplotypes (Nh), and the numbers of unique haplotypes (Nu) using DnaSP v5.10.01 (Librado and Rozas, 2009). Uncorrected pairwise sequence divergences (%, p-distances) were calculated in MEGA v5.2 (Tamura et al., 2011). Analyses of molecular variation (AMOVAs) were conducted using Arlequin v3.5.1.3 (Excoffier et al., 2005) with 1000 permutations to estimate the amount of genetic variation explained within sampled populations, between populations and between geographically separated groups of populations. Pairwise FSTvalues were calculated to explore genetic differentiation between paired populations. Analyses of isolation by distance (IBD) were conducted to investigate correlations between FST/ (1-FST) and logarithms of inter-population geographical distance, using IBDWS v3.23 (Jensen et al., 2005). To determine haplotype relationships and better visualize population genetic structure among populations, we constructed a median joining network using Network v4.6.0 (Fluxus Technology Ltd.). A phylogenetic network in the program SplitsTree v4.10 (Huson and Bryant, 2006) using the Neighbor-Net algorithm (Bryant and Moulton, 2004). To assess the support for inferred splits in the phylogenetic network, a bootstrap analysis was conducted with 1000 pseudoreplicates.
2.5 Demographic historyTo assess the demographic histories of the sampled populations for evidence of recent changes in effective population sizes, we calculated mismatch distributions in DnaSP. Each population mismatch distribution was assessed for ragged and/or multimodal distributions, which can show signs of structured versus smooth or unimodal populations. Unimodal distributions may be indicative of recent population expansion or sudden panmixia (Harpending et al., 1998). We estimated Fu’s Fs (Fu, 1997) and Tajima’s D (Tajima, 1989) to test for neutrality of populations and further assess the data for evidence of recent population expansion. Finally, we estimated a population-specific raggedness index (r) as a test of the expected distribution of population expansion in Arlequin.
3. Results
3.1 Genetic DiversityThe final dataset consisted of 871 bp of mitochondrial (16S), and 562 bp of nuclear (POMc), data from 135 individuals of chiromatis hansenae. Observed variable and parsimony informative sites for the two sampled genes were: 106/99 (16S); 43/29 (POMc). The numbers of observed haplotypes among sampled genes were quite similar, with 57 and 54 haplotypes identified for 16S and POMc, respectively. Overall, mitochondrial haplotype diversity (h) was 0.975 ± 0.004, and ranged from 0.667 ± 0.314 (PK) to 1.000 ± 0.500 (LE) and 1.000 ± 0.177 (TK2). There were 54 unique mitochondrial haplotypes among nine populations. The overall mitochondrial nucleotide diversity (π) was 0.03561 ± 0.00101, and ranged from 0.00078 ± 0.00037 (PK) to 0.00796 ± 0.00192 (TK2). Finally, the average frequency distributions of nucleotides for the mitochondrial dataset were A = 34.5%, c = 22.7%, G = 17.5% and T = 25.2%. The haplotype distribution among the nine localities is presented in Table 1.
3.2 Phylogenetic analysesBayesian phylogenetic analyses (BI) of the 16S dataset support the monophyly of sampled populations of chiromantis hansenae (Figure 2). Additionally, analyses of 16S data recover two genetically divergent clades within Thailand with strong support (Figure 2). clade A (posterior probability [PP]: 1.0) consisted of three groups of populations from PK (A1), KcB and TK2 (A2a), and MHS (A2b) distributed across the northwest and western regions of Thailand (Figure 1). clade B (PP: 0.97) consisted of two groups of populations from TK1 (B1a), SRT (B1b) and LE, NRS and cB (B2) distributed across the northeast, eastern and southern regions of Thailand (Figure 1). The PP of the nuclear POMc dataset (Figure 3) showed several, wellsupported inconsistencies with the 16S dataset (Figures 2–3).
The median-joining network of mitochondrial haplotypes resulted in observed intraspecific genetic structure (Figure 4). To better visualize haplotype structure across Thailand, we divided the network into two haplogroups consistent with the topology of the 16S gene tree (Figure 2). Haplogroup1 consists of haplotypes from MHS, TK2, KcB, and PK. Haplogroup2 consists of haplotypes from LE, NRS, cB and TK1 and SRT. The networks show a large number of unique haplotypes within individual sampling localities, and displayed a low degree of sharing among localities, with the exception of Haplotype H16 shared by two populations from NRS and LE, and the Haplotype H39 and H40 shared by two populations from NRS and cB. Phylogenetic networks of the 16S dataset produced by splitstree provide consistent support for seven well-supported genetic clusters (bootstrap support [BS] > 70%; Figure 5). comparatively, analyses of the sequenced portion of POMc recovered three genetic clusters (Figure 6).
3.3 Population genetic structurePairwise genetic divergences (%) among populations are presented in Table 2. The results revealed high mean genetic divergences (4.4%–6.3%) between the two major clades identified in phylogenetic analyses. Interestingly, genetic divergences between sampled localities from the supported clade of populations LE, NRS, cB, TK1 and SRT (0.0–3.4%) were observed to be lower than those between populations recovered in the clade of PK, KcB, TK2 and MHS (1.3%–5.0%). The AMOVA analysis (Table 3) supported similar amounts of significant genetic variation explained among and within populations (49.25% and 45.81%, respectively; P < 0.01). Most pairwise FSTvalues were observed to be significant (P < 0.01; Table 2). FSTvalues inferred for the cB, MHS, and TK1 populations with other populations showed significant differentiation including low gene flow among these populations. correlation of FST/ (1-FST) and the logarithms of interpopulation geographical distance (Figure 7) showed negative values of r and not significant in Mantel test analysis (r = –0.118, p = 0.675). Therefore, the genetic differentiation among populations did not relate with geographic distance among populations.
3.4 Population demographic historycalculated mismatch distributions of all populations were multimodal (Figure 8), and both sum of squared deviations (SSD) and Harpending’s raggedness indices (r) were not significant (SSD = 0.011, p > 0.01; r = 0.004, p > 0.01; Table 4). Tajima’s D tests and Fu’s Fs tests were negative and not significant (p > 0.01; Table 4) which support the results of mismatch distribution analyses. Populations at demographic equilibrium or decline should provide a multimodal distribution of pairwise differences (Slatkin and Hudson, 1991; Rogers and Harpending, 1992). Therefore, these results are in line with the possible inference of stable population dynamics among Thailand populations of c. hansenae.
4. Discussion
4.1 Phylogenetic relationships among populationsThe phylogenetic analyses of the mitochondrial dataset recovered multiple, genetically divergent, endemicThailand populations of c. hansenae. One well-supported clade (clade A) includes sampled populations from northwestern and western regions of Thailand, with a second clade (clade B) made up of populations from northeastern, eastern and southern regions of Thailand as well as a single population (TK1) from western regions of the country. In contrast, although phylogenetic analyses of the nuclear dataset were roughly consistent with analyses of 16S, given the low levels of genetic variation within the gene, several well-supported relationships were not concordant with the mtDNA gene tree (Figures 2–3).
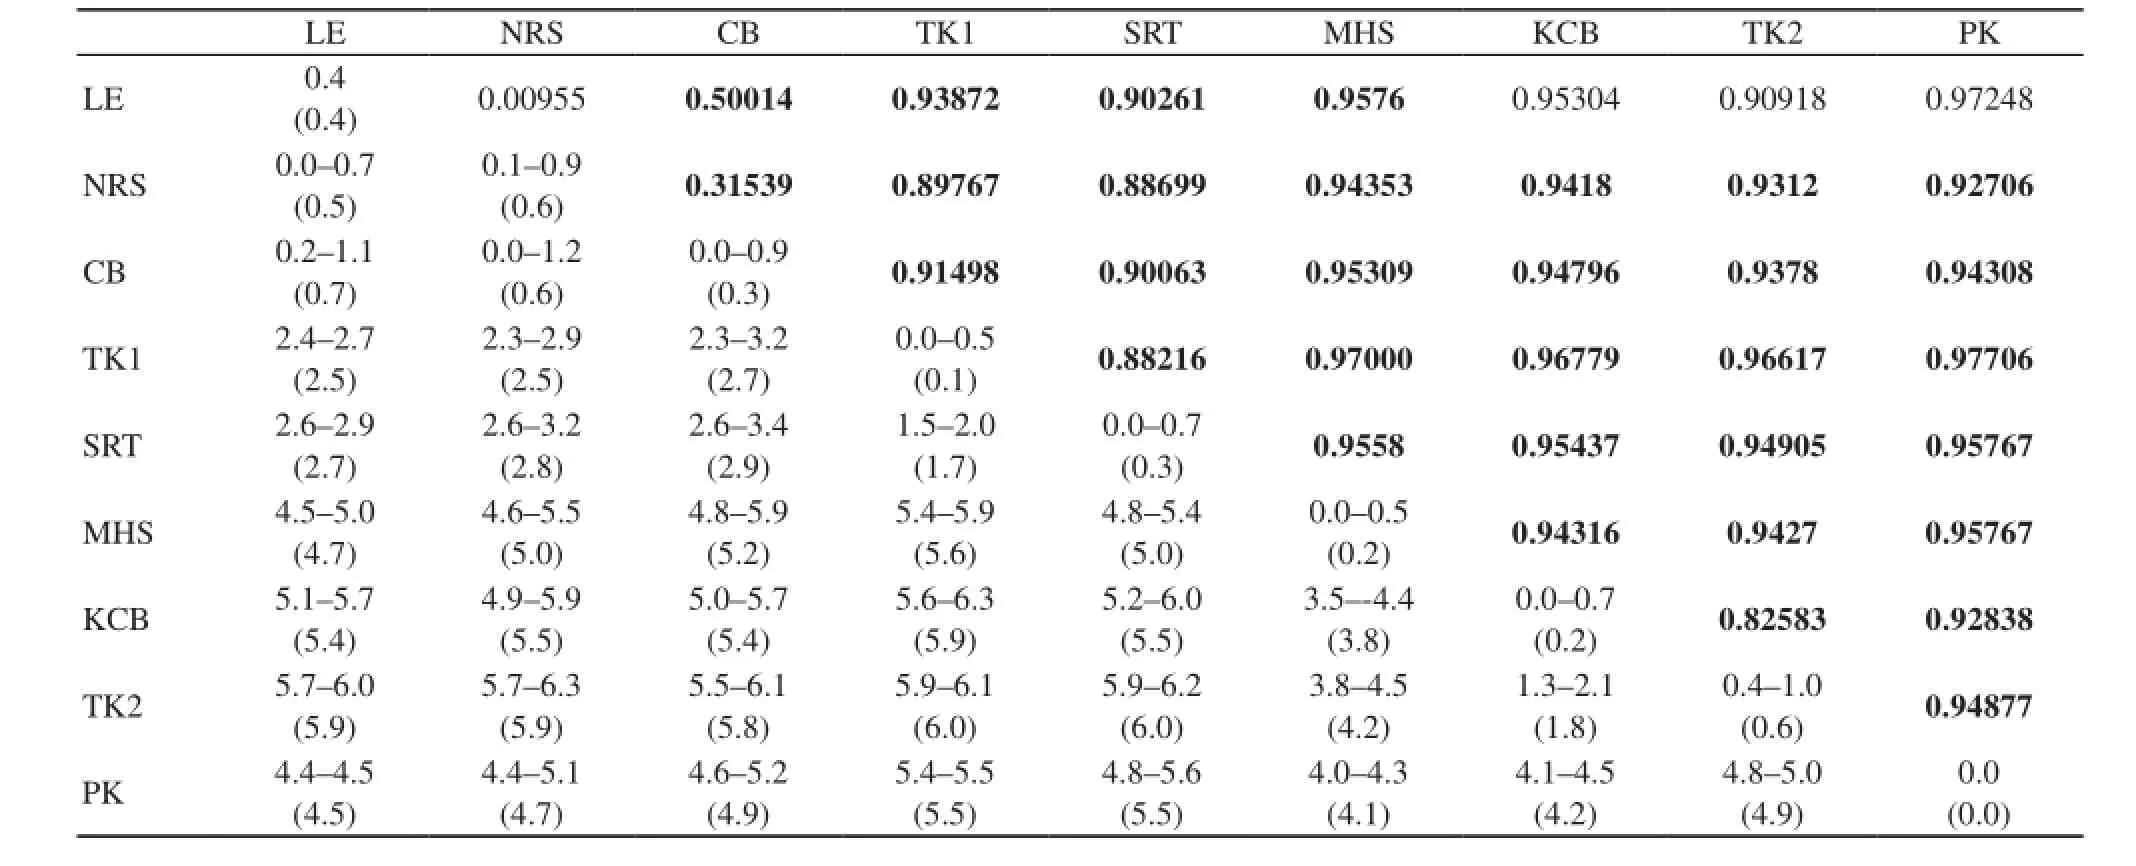
Table 2 Uncorrected pairwise sequence divergences (%) for the mitochondrial 16S rRNA dataset below diagonal, showing inter-population and intra-population genetic diversity for chiromantis hansenae across Thailand. Percentages on the diagonal represent intra-population genetic diversity. Mean pairwise genetic divergences shown in parentheses for reference. Pairwise FSTvalues among and within sampling localities of c. hansenae across Thailand shown above diagonal, based on the mitochondrial (16S) dataset. Significant FSTvalues (p-values < 0.05) are bolded for emphasis.

Table 3 Results of Analysis of Molecular Variance (AMOVA) of genetic differences in mtDNA sequences of sampled populations of chiromantis hansenae.

Table 4 Results of statistical tests of neutrality and mismatch distributions of sampled populations of chiromantis hansenae based on the mitochondrial 16S rRNA dataset. Significant values (p-values < 0.05) are bolded for emphasis.
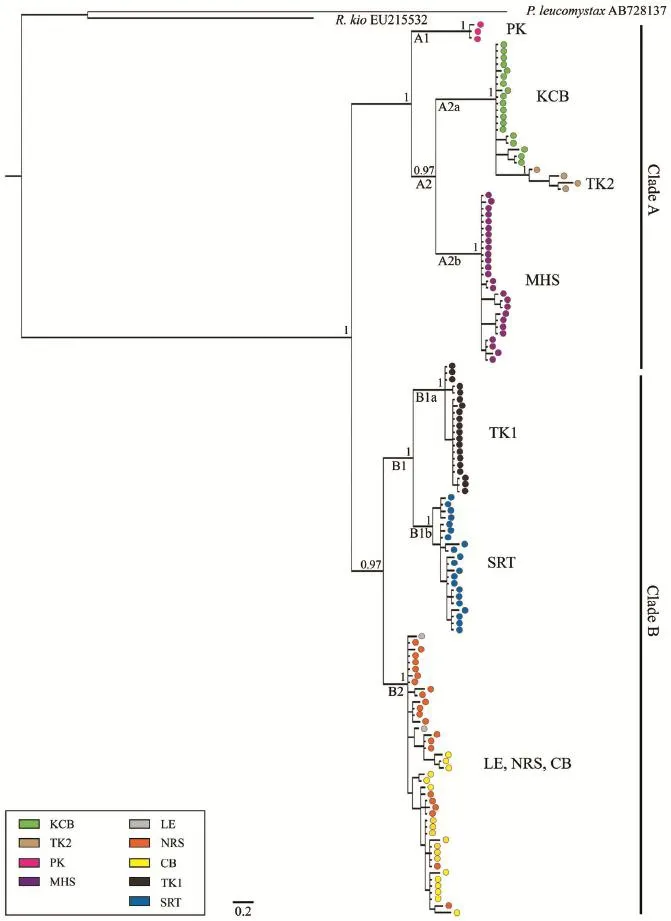
Figure 2 Hypothesized relationships of among sampled populations of chiromantis hansenae, illustrated by the maximum clade credibility tree resulting from Bayesian analyses of the mitochondrial 16S rRNA dataset. Bayesian posterior probabilities are shown above branches, with alphanumeric labels shown below branches referencing focal clades discussed in the Results and Discussion sections. Nodes supported by > 0.95 Bayesian PP were considered highly supported. Terminals are labeled with colors corresponding to sampling localities shown in Figure 1.

Figure 3 Hypothesized relationships of among sampled populations of chiromantis hansenae, illustrated by the maximum clade credibility tree resulting from Bayesian analyses of the nuclear POMc dataset. Bayesian posterior probabilities are above the branches. Nodes supported by > 0.95 Bayesian PP were considered highly supported. Terminals are labeled with colors corresponding to sampling localities shown in Figure 1.

Figure 4 Median joining 16S haplotype network (MJN) depicting hierarchical relationships among haplotypes represented by sampled populations of chiromantis hansenae. Each circle represents a haplotype and the size of circle is scaled to the number of individuals sharing that haplotype. White circles represent median vectors, and branch numbers represent the estimated number of mutational steps.

Figure 5 SplitsTree network (Huson and Bryant, 2006) with bootstrap support values for the mitochondrial (16S) dataset. colors correspond to the same colors on the phylogenies and in the other figures. Asterisks represent bootstrap support values greater than 70%.
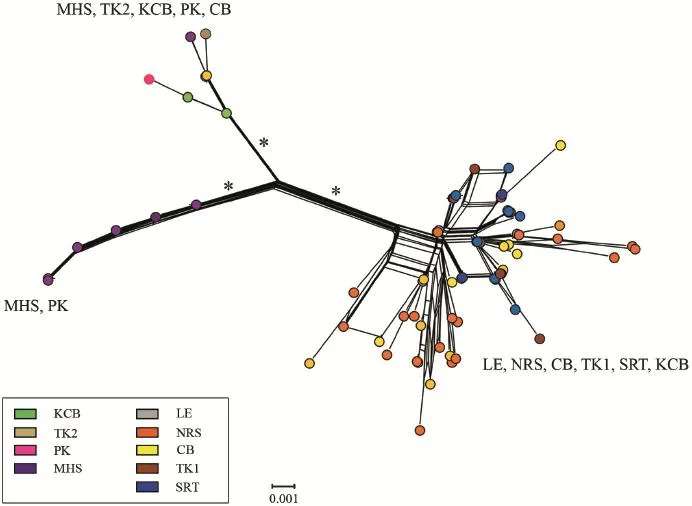
Figure 6 SplitsTree network (Huson and Bryant, 2006) with bootstrap support values for the nuclear (POMc) dataset. colors correspond to the same colors on the phylogenies and in the other figures. Asterisks represent bootstrap support values greater than 70%.
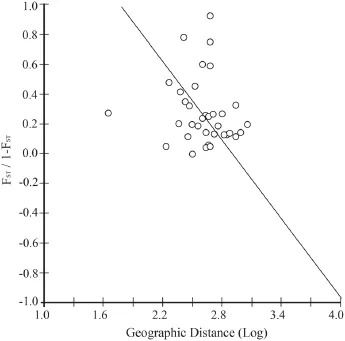
Figure 7 Isolation by distance plot of chiromantis hansenae populations showing relationship of pairwise genetic distance FST/ (1-FST) and logarithms of geographic distance between populations. A linear regression line based on data points overlays the scatter plot for reference.
Buckley et al. (2006), among others, have reviewed the relatively common observations of discordant mitochondrial and nuclear gene trees in the literature. There are several evolutionary processes that have been proposed as responsible for this conflict among gene trees, including, but not limited to, incomplete lineage sorting, genetic polymorphism, hybridization, and introgression (Buckley et al., 2006; Gompert et al., 2008; Bossu and Near, 2009; Leaché et al., 2009; Siler et al., 2010). Although currently it remains difficult to determine definitively which process, or processes, might be responsible for observed mito-nuclear gene tree discordance, the rapid development of genomic approaches to collecting datasets of many, unlinked loci will likely provide new insights into these patterns. For the focal species of chiromantis hansenae, additional data would be needed before any robust hypotheses could be made. However, given the low observed genetic diversity within the POMc dataset (Figure 3), and the shallow mtDNA divergences between many sampled populations in Thailand (Figure 2), we suspect that the gene tree conflicts are likely the result of incomplete lineage sorting in the nuclear marker.

Figure 8 Observed frequencies of pairwise nucleotide differences among mitochondrial sequences (dashed lines) and expected frequencies under a model of sudden population expansion (solid lines) (Rogers and Harpending, 1992). Mismatch distributions depict frequencies of pairwise differences for: (A) LE, (B) NRS, (c) cB, (D) TK1, (E) SRT, (F) MHS, (G) TK2, (H) KcB, (I) PK and (J) all samples of chiromantis hansenae.
4.2 Genetic structure ofchiromantis hansenae The populations of c. hansenae in Thailand revealed strong genetic structure based on the mtDNA dataset. The haplotype network displayed unique haplotypes in each population and did not reveal widespread haplotypes
with a few exceptions in populations LE, NRS, and cB populations (Figure 4). With sequence divergences (16S) among populations of c. hansenae inferred to be relatively high (Table 2), and AMOVA analyses supporting high amounts of genetic variation explained among geographic groups of populations and among populations within these groups (Table 3), the results suggest the possible presence of geographic barriers to dispersal and gene flow across Thailand.
Early studies on the home range sizes of amphibians suggested that they were limited to short-distances (less than 0.5 km; Zug, 1993). Additionally, Smith and Green (2005) reported amphibians as having limited dispersal abilities; with 44% of amphibian species they reviewed being capable of natural movement in excess of 400 m. Not only might low dispersal abilities potentially increase or maintain genetic differentiation among populations (e.g. Garcia-Paris et al., 2000; cabe et al., 2007; Martinez-Solano et al., 2007), but also, geographic barriers such as mountain ranges may naturally obstruct gene flow in certain amphibian taxa (Hagemann and Pr?hl, 2007; Zhang et al., 2010). Based on the geographic topology of Thailand, the northwestern and western regions of the country contain many continental steep mountain ranges that lay in north-south orientations with the Tenasserim and Thanon Thong chai mountain ranges that border Thailand and Myanmar. The average elevations of these mountain ranges are higher on the Myanmar side, with many mountain peaks reaching 1 000 m asl, while on the Thai side the highest summits remain around 800 m asl (Gupta, 2005). The northeastern and eastern regions of Thailand have lower elevations, with plateaus and isolated mountain chains (Inger, 1999). chiromantis hansenae is documented to occur in lowland (Sheridan and Ocock, 2008) to mid-elevation forest (~900 m asl; Stuart et al., 2004). Future studies on the microhabitat preferences or ecological requirements of this species may eventually reveal these as mechanisms limiting the dispersal ability of chiromantis populations across Thailand and Southeast Asia.
Within the SRT population in southern Thailand, phylogenetic analyses revealed populations to be most closely related to the northeastern and eastern populations sampled in this study. Although the SRT population currently is located more than 500 km from eastern Thailand, and is separated from other populations by the Gulf of Thailand, historically, these regions experienced cyclical connections during the Pleistocene. During glacial maxima, both regions were connected as sea levels dropped by more than 100 m (the depth of the Gulf of Thailand), providing a potential land bridge connection between these geographically distant populations (Hall, 1998; Voris, 2000; Sathiamurthy and Voris, 2006). This historical land positive connection might help explain some of the observed phylogenetic results, a possibility that has been supported by studies of allozyme variation in Rana nigrovittata across Thailand (Matsui et al., 2001). Moreover, this is congruent with the study of phylogenetic relationships among Hoplobatrachus rugulosus in the country (Pansook et al., 2012).
Populations from PK and SRT, which are located on the Thai-Malay Peninsula (~400 km apart), are geographically more proximate to each other than the population from SRT is to sampled populations in northeastern and eastern Thailand. However, the results of phylogenetic analyses do not support the monophyly of populations from PK and SRT. This result highlights the need to better understand the impact historical land connections across the Isthmus of Kra may have had on vertebrate diversification in Thailand, as populations PK and SRT are located to the north and south of the Isthmus of Kra, respectively. Not only is the Isthmus of Kra recognized as an ecotone between the Indochinese and Sundaic subregions (Hughes et al., 2003; Woodruff, 2003b; Woodruff and Turner, 2009), but also, this region represents a major faunal turnover zone across which species dispersal may be limited (for review, see Inger and Voris, 2001; Hughes et al., 2003; Woodruff and Turner, 2009). Future studies across this transition zone may support the region as a promoter of genetic divergence between northern and southern regions of Thailand.
Interestingly, two populations from Tak Province were recovered as genetically divergent, despite being geographically proximate to each other (roughly 45 kilometers apart). Our results support a close relationship between the TK1 population and populations from northeastern, eastern and southern Thailand, whereas we find support for TK2 being closely related to populations from northwestern and western Thailand. Furthermore, we observe high genetic divergence between these two populations (5.9%–6.1%), which further can be visualized in inferred haplotype networks (Figure 4). Preliminary data on external morphology does not readily distinguish these two lineages from each other (Yodthong and Aowphol, unpublished data; however, current sampling available for the TK2 population is limited. Additionally, analyses of mating call variation have yet to be performed between these two populations, and such data might reveal differences between these genetically divergent lineages. Biogeographically, the TK1 population was
sampled from regions within the Sam Ngao District and Mueang District in Tak Province, at elevations of 160 and 209 m asl, respectively. The TK2 population was sampled from Mae Sod District in Tak Province, at an elevation of 315 m asl. Additionally, population-level sampling across Thailand may reveal that these two divergent populations are separated by part of the Thanon Thong chai Mountain Range, which may present a moderate to high elevational barrier to dispersal for this species (~1 000 m asl).
Before broad scale conclusions can be reached about the influence of historical biogeographic processes on vertebrate diversification in Thailand, it is clear that studies are needed on many other vertebrate taxa recognized to span this biogeographic barrier (i.e., amphibians, reptiles, birds, mammals). Furthermore, future studies should focus on patterns of historical and modern gene flow between eastern continental and southern peninsula populations, investigating the impact of historical land bridge connections across the Gulf of Thailand on species diversification on the Sunda Shelf.
AcknowledgementsThis research was supported by Kasetsart University research grant (No. 28.56) from the Kasetsart University Research and Development Institute (KURDI) and ScRF grant (No. S14/2555) from Faculty of Science, Kasetsart University. Support for cameron D. SILER to develop new international collaborations with the Amphibians and Reptiles Ecology Laboratory, Kasetsart University was supported by international travel grants provided by the Department of Biology and college of Arts and Sciences at the University of Oklahoma. We would like to thank Virayuth LAUHAcHINDA, Wut TAKSINTUM (Kasetsart University), David S. McLEOD (University of Kansas) and Bryan L. STUART (North carolina Museum of Natural Science) for valuable advice on this research. We thank Taksin ARTcHAWAKOM for permission to conduct research at Sakaerat Environment Research Station. We thank Attapol RUJIRAWAN, Korkhwan TERMPRAYOON, Natee AMPAI, Suprawat MAITREEPAN and Somphouthone PHIMMAcHAK for assistance in fieldwork. Finally, we wish to thank J.-T. LI and two anonymous reviewers for providing helpful comments towards the improvement on the manuscript.
Aowphol A., Rujirawan A., Taksintum W., Arsirapot S., McLeod D. S.2013. Re-evaluating taxonomic status of chiromantis in Thailand using multiple lines of evidence (Amphibia: Anura: Rhacophoridae). Zootaxa, 3702: 101–123
Arbogast B. S., Kenagy G. J.2001. comparative phylogeography as an integrative approach to historical biogeography. J Biogeogr, 28: 819–825
Bossu c. M., Near T. J.2009. Gene trees reveal repeated instances of mitochondrial DNA introgression in orangethroat darters (Percidae: Etheostoma). Syst Biol, 58: 114–129
Brown R. M., Linkem c. W., Siler c. D., Sukumaran J., Esselstyn J. A., Diesmos A. c., Iskandar D. T., Bickford D., Evans B. J., McGuire J. A., Grismer L., Supriatna J., Andayani N.2010. Phylogeography and historical demography of Polypedates leucomystax in the islands of Indonesia and the Philippines: Evidence for recent human-mediated range expansion. Mol Phylogenet Evol, 57: 598–619
Brown R. M., Siler c. D., Oliveros c. H., Esselstyn J. A., Diesmos A. c., Hosner P. A., Linkem c. W., Barley A. J., Oaks J. R., Sanguila M. B., Welton L. J., Blackburn D. c., Moyle R. G., Peterson A. T., Alcala A. c.2013. Evolutionary Processes of diversification in a model island archipelago. Annu Rev Ecol Evol Syst, 44: 411–435
Buckley T. R., cordeiro M., Marshall D. c., Simon c.2006. Differentiating between hypotheses of lineage sorting and introgression in New Zealand alpine cicadas (Maoricicada Dugdale). Syst Biol, 55: 411–425
Bryant D., Mouthon V.2004. Neighbor-Net: An Agglomerative Method for the construction of Phylogenetic Networks. Mol Biol Evol, 21: 255–265
cabe P. R., Page R. B., Hanlon T. J., Aldrich M. E., connors L., Marsh D. M.2007. Fine-scale population differentiation and gene flow in a terrestrial salamander (Plethodon cinereus) living in a continuous habitat. Heredity, 98: 53–60
chan-ard T.2003. A photographic Guide to Amphibians in Thailand. Bangkok , Thailand. Darnsutha Press, 175 pp (In Thai)
chan K. O., Grismer L. L., Shahrul A. M. S., Quah E. S. H., Grismer J. L., Wood P. L. Jr., Norhayati A.2011. Additions to the herpetofauna of Perlis State Park in northern Peninsular Malaysia with the description of a new species of chiromantis Peter 1854 (Anura: Rhacophoridae). Russ J Herp, 18:253–259
cochran D. M.1927. New reptiles and batrachians collected by Dr. Hugh M. Smith in Siam. Proc Biol Soc Washington, 40: 179–192
Darriba D., Taboada G. L., Doallo R., Posada D.2012. jModelTest 2: more models, new heuristics and parallel computing. Nat Met, 9: 772
Evans B. J., Supriatna J., Andayani N., Setiadi M. I., cannatella D. c., Melnick D. J.2003. Monkeys and toads define areas of endemism on Sulawesi. Evolution, 57: 1436–1443
Excoffier L., Laval G., Schneider S.2005. Arlequin version. 3.0: an integrated software package for population genetics data analysis. Evol Bioinf Online, 1: 47–50
Feldman c. R., Spicer G. S.2006. comparative phylogeography of woodland reptiles in california: repeated patterns of cladogenesis and population expansion. Mol Ecol, 15: 2201–2222
Frost D. R.2013. Internet references. Retrieved from http:// research.amnh.org/herpetology/amphibia/index.html 23/10/2013
Fu Y. X.1997. Statistical tests of neutrality of mutations against population growth, hitchhiking and background selection. Genetics, 147: 915–925
Gompert Z., Forister M. L., Fordyces J. A., Nice c. c.2008. Widespread mito-nuclear discordance with evidence for
introgressive hybridization and selective sweeps in Lycaeides. Mol Ecol, 17: 5231–5244
Gonzalez P., Su Y. c., Siler c. D., Barley A. J., Sanguila M. B., Diesmos A. c., Brown R. M.2014. Archipelago colonization by ecologically dissimilar amphibians: evaluating the expectation of common evolutionary history of geographical diffusion in codistributed rainforest tree frogs in islands of Southeast Asia. Mol Phylogenet Evol, 72:35–41
Gracia-Paris M., Good D. A., Parra-Olea G., Wake D. B.2000. Biodoversity of costa Rican salamanders: Implications of high levels of genetic differentiation and phylogeographic structure for species formation. PNAS, 97: 1640–1647
Gupta A.2005. The Physical Geography of Southeast Asia. London, England. Oxford University Press, 468 pp
Hagemann S., Pr?hl H.2007. Mitochondrial paraphyly in a polymorphic poison frog species (Dendrobatidae: D. pumilio). Mol Phylogenet Evol, 45: 740–747
Hall R.1998. The plate tectonics of cenozoic SE Asia and the distribution of land and sea. 99–131. In Hall R., Holloway J. D. (Eds), Biogeography and Geological Evolution of SE Asia. Leiden, The Netherlands: Backhuys Publishers
Harpending H. c., Batzer M. A., Gurven M., Jorde L. B., Rogers A. R., Sherry S. T.1998. Genetic traces of ancient demography. PNAS, 95: 1961–1967
Hertwig S. T., Schweizer M., Das I., Hass A.2013. Diversification in a biodiversity hotspot – The evolution of Southeast Asian rhacophorid tree frogs on Borneo (Amphibia: Anura: Rhacophoridae). Mol Phylogenet Evol, 68: 567–581
Hickerson M. J., carstens B. c., cavender-Bares J., crandall K. A., Graham c. H., Johnson J. B., Rissler L., Victoriano P. F., Yoder A. D.2010. Phylogeography’s past, present, and future: 10 years after Avise, 2000. Mol Phylogenet Evol, 54: 291–301
Hughes J. B., Round P. D., Woodruff D. S.2003. The Indochinese-Sundaic faunal transition at the Isthmus of Kra: an analysis of resident forest bird species distribution. J Biogeogr, 30: 569–580
Huson D. H., Bryant D.2006. Application of phylogenetic networks in evolutionary studies. Mol Biol Evol, 23: 245–267
Inger R. F.1999. Distribution of Amphibians in Southern Asia and Adjacent Islands. 445–482. In Duellman W. E. (Ed), Patterns of Distribution of Amphibians. Baltimore and London, England. The Johns Hopkins University Press
Inger R. F., Voris H. K.2001. The biogeographical relations of the frogs and snakes of Sundaland. J Biogeogr, 28: 863–891
Jansa S. A., Barker F. K., Heaney L. R.2006. The pattern and timing of diversification of Philippine endemic rodents: evidence from mitochondrial and nuclear gene sequences. Syst Biol, 55: 73–88
Jensen J. L., Bohonak A. J., Kelley S. T.2005. Isolation by distance, web service version 3.23. BMc Genetics, 6: 13
Knowles L. L., Alvarado-Serrano D. F.2010. Exploring the population genetic consequences of the colonization process with spatio-temporally explicit models: insights from coupled ecological, demographic and genetic models in montane grasshoppers. Mol Ecol, 19: 3727–3745
Kuraishi N., Matsui M., Hamidy A., Belabut D. M., Ahmad N., Panha S., Sudin A., Yong H. S., Jiang J. P., Ota H.,Thong H. T., Nishikawa K.2013. Phylogenetic and taxonomic relationships of the Polypedates leucomystax complex (Amphibia). Zool Scr, 42: 54–70
Leaché A. D., Koo M. S., Spencer c. L., Papenfus T. J., Fisher R. N., McGuire J. A.2009. Quantifying ecological, morphological, and genetic variation to delimit species in the coast horned lizard species complex (Phrynosoma). PNAS, 106: 12418–12423
Lessa E. P., cook J. A., Patton J. L.2003. Genetic footprints of demographic expansion in North America, but not Amazonia, during the Late Quaternary. PNAS, 100: 10331–10334
Li J. T., che J., Bain R. H., Zhao E. M., Zhang Y. P.2008. Molecular phylogeny of Rhacorphoridae (Anura): A framework of taxonomic reassigsment of species within the genera Aquixalus, chiromantis, Rhacophorus and Philautus. Mol Phylogenet Evol, 48: 302–312
Li J. T., che J., Murphy R. W., Zhao H., Zhao E. M., Rao D. Q., Zhang Y. P.2009. New insights to the molecular phylogenetic and generic assessment in the Rhacophoridae (Amphibia: Anura) based on five nuclear and three mitochondrial gene, with comments on the evolution of reproduction. Mol Phylogenet Evol, 53: 509–522
Li J. T., Li Y., Klaus S., Raw D. Q., Hillis D. M., Zhang Y. P.2013. Diversification of rhacophorid frogs provides evidence for accelerated faunal exchange between India and Eurasia during the Oligocene. PNAS, 110: 3441–3446
Li J. T., Rao D. Q., Murphy R. W., Zhang Y. P.2011. The systematic status of Rhacophirid frogs. Asian Herpetol Res, 2: 1–11
Librado P., Rozas, J.2009. DnaSP v5: A software for comprehensive analysis of DNA polymorphism data. Bioinformatics, 25: 1451–1452
Martinez-Solano I., Jockusch E. L., Wake D. B.2007. Extreme population subdivision throughout a continuous range: phylogeography of Batrachoseps attenuates (caudata: Plethodontidae) in western North America. Mol Ecol, 16: 4335–4355
Matsui M., Nishikawa K., Khonsue W., Panha S., Nabhitabhata J.2001. Allozymic Variation in Rana nigrovittata (Amphibia: Anura) within Thailand with special reference to the taxonomic status of R. mortenseni. Nat Hist J chulalongkorn Univ, 1: 15–22
Moriarty E. c., cannatella D. c.2004. Phylogenetic relationships of the North American chorus frog (Pseudacris: Hylidae). Mol Phylogenet Evol, 30: 409–420
Nei M.1987. Molecular evolutionary genetics. New York, USA . columbia University Press, 512 pp
Nei M., Tajima F.1981. DNA polymorphism detectable by restriction endonuclease. Genetics, 97: 145–163
Pansook A., Khonsue W., Piyapattanakorn S., Pariyanonth P.2012. Phylogenetic Relationships among Holobatrachus rugulosus in Thailand as Inferred from Mitochondrial DNA Sequence of the cytochrome-b Gene (Amphibian, Anura, Dicroglossidae). Zool Sci, 29: 54–59
Pimvichai P., Enghoff H., Panha S.2014. Molecular phylogeny of the Thyropygus allevatus group of giant millipedes and some closely related groups. Mol Phylogenet Evol, 71: 170–183
Poo S., Bickford D. P.2013. The Adaptive significance of egg attendance in a South-East Asian tree frog. Ethology, 119: 671–679
Rambaut A., Drummond A. J.2007. Internet references. Retrieved from http://beast.bio.ed.ac.uk/Tracer 16/12/2013
Rogers A. R., Harpending H.1992. Population growth makes waves in the distribution of pairwise genetic difference. Mol Biol Evol, 9: 552–569
Ronquist F., Huelsenbeck J. P.2003. MrBayes 3: Bayesian phylogenetic inference under mixed models. Bioinformatics, 19: 1572–1574
Round P. D., Hughes J. B., Woodruff D. S.2003. Latitudinal range limits of resident forest birds in Thailand and the Indochinese–Sundaic zoogeographic transition. Nat Hist Bull Siam Soc, 51: 69–96
Sathiamurthy E., Voris H. K.2006. Map of Holocene sea level transgression and submerged lakes on the Sunda shelf. Nat Hist J chulalongkorn Univ Suppl, 2: 1–44
Sheridan J. A., Ocock J. F.2008. Parental care in chiromantis hansenae (Anura; Rhacophoridae). copeia, 2008: 733–736
Siler c. D., Oaks J. R., Esselstyn J. A., Diesmos A. c., Brown R. M.2010. Phylogeny and biogeography of Philippine benttoed geckos (Gekkonidae: cyrtodactylus) contradict a prevailing model of Pleistocene diversification. Mol Phylogenet Evol, 55: 699–710
Siler, c. D., Oaks J. R., cobb K., Ota H., Brown, R. M.2014. critically endangered island endemic or peripheral population of a widespread species? conservation genetics of Kikuchi's gecko and the global challenge of protecting peripheral oceanic island endemic vertebrates. Divers Distrib, DOI:10.1111/ddi.12169
Slatkin M., Hudson R. R.1991. Pairwise comparisons of mitochondrial DNA sequences in stable and exponentially growing populations. Genetics, 129: 555–562
Smith M. A., Green D. M.2005. Dispersal and the metapopulation paradigm in amphibian ecology and conservation: Are all amphibian populations metapopulations. Ecography, 28: 110–128
Stuart B. L., Emmett D. A.2006. A collection of amphibians and reptiles from the cardamom Mountains, southwestern cambodia. Fieldiana Zool, 109: 1–27
Stuart B. L., Ohler A., van Dijk P. P.2004. Internet references. Retrieved from http://www.iucnredlist.org 23/10/2013
Tajima F.1989. Statistical method for testing the neutral mutation hypothesis by DNA polymorphism. Genetics, 123: 585–595
Tamura K., Peterson D., Peterson N., Stecher G., Nei M.,Kumar S.2011. MEGA5: Molecular evolutionary genetics analysis using maximum likelihood, evolutionary distance, and maximum parsimony methods. Mol Biol Evol, 28: 2731–2739
Taylor E. H.1962. The amphibian fauna of Thailand. Univ Kansas Sci Bull, 43: 265–599
Voris H. K.2000. Map of Pleistocene sea levels in Southeast Asia: shorelines, river systems and time durations. J Biogeogr, 27: 1153–1167
Wikramanayake E., Dinerstein E., Loucks c. J., Olson D., Morrison J., Lamoreux J., McKnight M., Hedao P.2002. Terrestrial ecoregions of the Indo-Pacific: a conservation assessment. Washington, Dc, the United State of America: Island Press, 643 pp
Wilkinson J. A., Drewes R. c., Tatum O. L.2002. A molecular phylogenetic analysis of the family Rhacophoridae with an emphasis on the Asian and African genera. Mol Phylogenet Evol, 24: 265–273
Woodruff D. S.2003a. The location of the Indochinese–Sundaic biogeographic transition in plants and birds. Nat Hist Bull Siam Soc, 51: 97–108
Woodruff D. S.2003b. Neogene marine transgressions, palaeogeography and biogeographic transitions on the Thai-Malay peninsula. J Biogeogr, 30: 551–567
Woodruff D. S., Turner L. M.2009. The Indochinese-Sundaic zoogeographic transition: a description and analysis of terrestrial mammal species distributions. J Biogeogr, 36: 803–821
Yu G. H., Rao D. Q., Zhang M. W., Yang J. X.2009. Reexamination of the phylogeny of Rhacophoridae (Anura) based on mitochondrial and nuclear DNA. Mol Phylogenet Evol, 50: 571–579
Zhang M. W., Rao D. Q., Yang J. X., Yu G. H., Wilkinson J. A.2010. Molecular phylogeography and population structure of a mid-elevation montane frog Leptobracium ailaonnicum in a fragmented habitat of southwest china. Mol Phylogenet Evol, 54: 47–58
Zink R. M.2002. Methods in comparative phylogeography, and their application to studying evolution in the North American Aridlands. Integr comp Biol, 42: 953–959
Zug G. R.1993. Herpetology: An Introduction Biology of Amphibians and Reptiles. california, USA: Academic Press, 527 pp

Appendix A Sample and sequence used in this study.

(continued Appendix A)
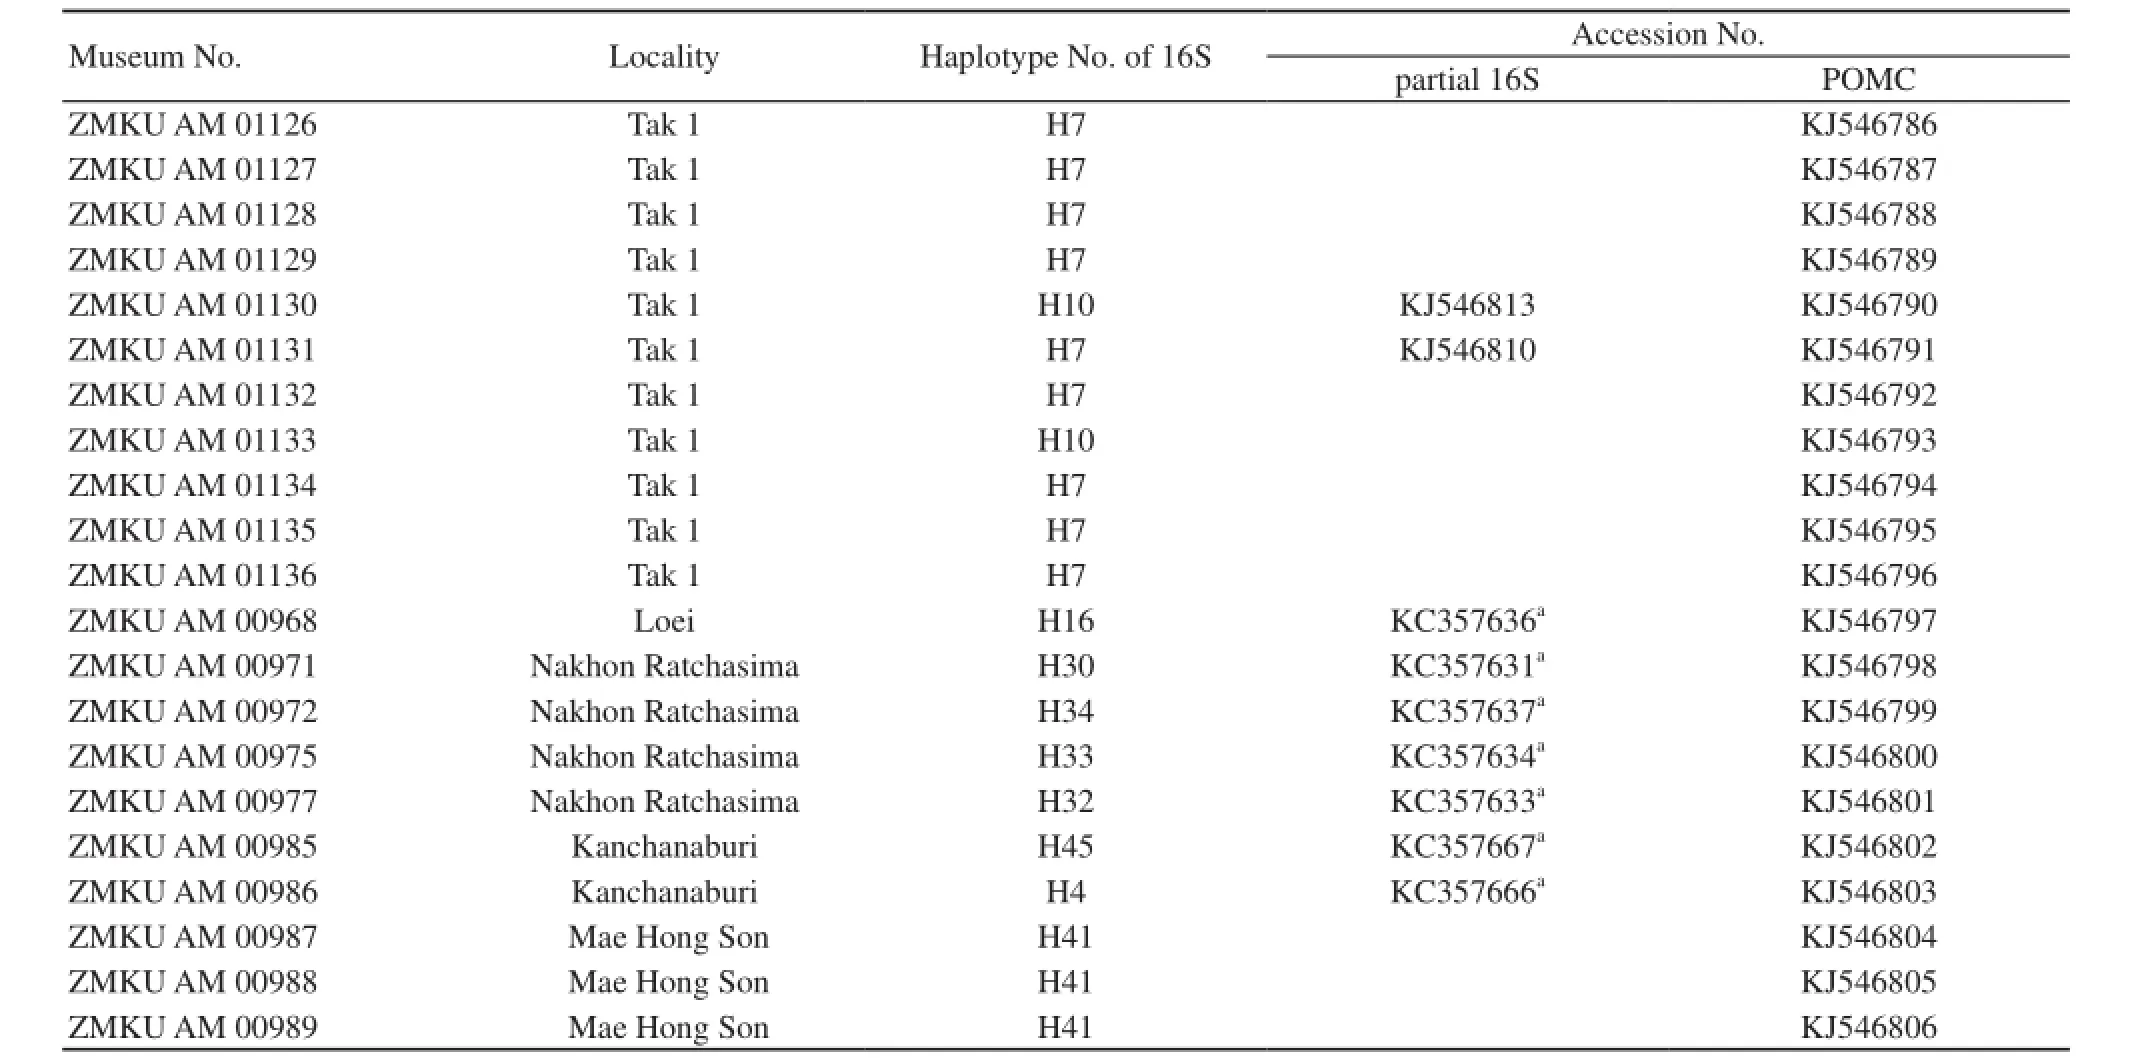
(continued Appendix A)
*corresponding author: Dr. Anchalee Aowphol, from Department of Zoology, Faculty of Science, Kasetsart University, Bangkok, Thailand, with her research focusing on systematics and ecology of amphibians and reptiles in Asia.
E-mail: fsciacl@ku.ac.th
Received: 9 April 2014 Accepted: 15 August 2014
 Asian Herpetological Research2014年3期
- Asian Herpetological Research的其它文章
- First Record of the Gekkonid Genus cnemaspis Strauch, 1887 from Gunung Mulu National Park, Northern Sarawak, East Malaysia may Represent an Undescribed Species
- Microbiological and Histological Examinations of Endangered Neurergus kaiseri Tissues Displaying Red-leg Syndrome
- The Seasonal Acclimatisation of Locomotion in a Terrestrial Reptile, Plestiodon chinensis (Scincidae)
- New Karyological and Morphometric Data on Poorly Known Bufo surdus and Bufo luristanicus in comparison with Data of Diploid Green Toads of the Bufo viridis complex from South of Iran
- Distribution and Environmental Suitability of the Smallscaled Rock Agama, Paralaudakia microlepis (Sauria: Agamidae) in the Iranian Plateau
- Description of a New Species of the Genus Brachytarsophrys Tian and Hu, 1983 (Amphibia: Anura: Megophryidae) from Southern china Based on Molecular and Morphological Data